Changes in the Terms of Trade and Canada’s Productivity Performance
Revised April 14, 2008 W. Erwin Diewert1
Discussion Paper 08-05 Department of Economics University of British Columbia
Vancouver, Canada, V6T 1Z1 Email: [email protected]
Abstract
Using new data from Statistics Canada, the paper shows that the productivity performance of the business sector of the Canadian economy has been reasonably satisfactory over the past 46 years. In particular, traditional gross income Total Factor Productivity (TFP) growth averaged 1.14 percentage points per year over the period 1961-2006 and when a net income framework was used, TFP growth averaged 1.26 percentage points per year. The focus of the study is on the real income generated by the business sector of the Canadian economy. Two concepts of income are used: a gross concept that includes depreciation as a part of income and a more appropriate net concept where depreciation is excluded from income. In both the gross and net income frameworks, the growth of quality adjusted labour input growth was the main driver of growth in real income followed by TFP growth, followed by growth in capital input and then by falling real import prices. However, in recent years, the contribution of falling real import prices turned out to be more than twice as important as capital deepening. The study encountered many data problems which should be addressed in future work on Canadian business sector productivity performance.
Journal of Economic Literature Classification Numbers
C43, C67, C82, D24, E22, E43.
Keywords
Total factor productivity, real income, terms of trade effects, measurement of capital, measurement of inventory change, user costs, real interest rates.
1 The financial assistance of Industry Canada is gratefully acknowledged. The author also thanks John
Baldwin, Serge Coulombe, Wulong Gu, Ulrich Kohli, Danny Leung, Alice Nakamura, Andrew Sharpe and Jianmin Tang for helpful comments. None of the above are responsible for any views expressed in this paper.
1. Introduction
Many observers have noted that an improvement in a country’s terms of trade has effects that are similar to an improvement in a country’s productivity growth. However, it is not straightforward to work out the exact magnitude of each source of gain. Diewert (1983), Diewert and Morrison (1986), Morrison and Diewert (1990) and Kohli (1990) (1991) (2003) (2004a) (2004b) (2006) (2007) developed production theory methodologies which enable one to obtain index number estimates of the contribution of each type of gain. In Appendix 1 below, we adapt this methodology and show how it can be used to measure the determinants of growth in an economy’s gross and net real income. In sections 2-4 of the main text, we apply this methodology to the business sector of the Canadian economy over the years 1961-2006.
Appendix 2 below describes how the Canadian business sector data was developed from Statistics Canada sources. Section 2 of the main text aggregates up the data from Appendix 2 and develops conventional measures of Canadian business sector Total Factor Productivity for the years 1961-2006.
However, productivity growth, while perhaps the most important source of growth in living standards, is not the entire story. If a country’s export prices increase more rapidly than its import prices, then it is well known that this has an effect that is similar to a productivity improvement.2 Thus in section 3, we measure the relative contributions of productivity improvements, changes in real export and import prices and growth of labour and capital input to the growth of (gross) real income generated by the business sector in Canada using the methodology explained in sections 1-4 of Appendix 1. However, this is not the end of the story. GDP is an (imperfect) measure of productive potential, not welfare.3 For welfare measurement purposes, it is generally conceded that Net Domestic Product (NDP) is a better measure of output, since investment that just meets depreciation means that society is not made any better off from the viewpoint of sustainable final consumption possibilities. Hence, in the second part of the paper, we subtract depreciation off from gross investment and use consumption plus sales to the nonbusiness sector plus net investment plus the trade balance as our business sector output concept. Thus depreciation will be treated as an intermediate input in this model of production. Section 5 of Appendix 1 explains this real net product approach and adapts a translog model of production based on the work of Diewert and Morrison (1986) and Kohli (1990) to this new model of market sector real net income generation.4 This
2 See for example Diewert and Morrison (1986).
3 For a more extensive discussion of the merits of GDP versus net income, see Diewert (2006a).
4 For previous implementations of this model of real net income to Japan and Australia, see Diewert,
approach is implemented for the Canadian business sector in section 4 of the main text. The main determinants of growth in real net income generated by the business or market sector of the economy are:
• Technical progress or improvements in Total Factor Productivity;
• Growth in domestic output prices or the prices of internationally traded goods and
services relative to the price of consumption; and
• Growth in primary inputs.
It turns out that productivity growth becomes a more important factor for explaining real net income growth compared to explaining real gross income growth. Also the importance of capital deepening is greatly reduced in the net income framework compared to the gross income framework. Somewhat surprisingly, for the years 2000-2006, improvements in the terms of trade made almost the same contribution to real income growth as capital deepening in the gross income framework and in the net income framework, the effects of falling real import prices contributed substantially more to real income growth than capital deepening over the period 2000-2006.
Appendix 3 compares our methodology for determining the effects of improvements in the terms of trade on real income growth with the methodology worked out by Kohli (2006).
Appendix 4 compares our estimates of TFP growth with the business sector Multifactor Productivity Growth estimates recently developed by the Statistics Canada KLEMS program; see Baldwin, Gu and Yan (2007) for a description of the methodology used in the KLEMS program.
Section 5 concludes.5
2. Output and Input Aggregates and Conventional Productivity Growth for Canada
In Appendix 2, we constructed price and quantity series for 11 net outputs and 8 primary inputs for the business sector of the Canadian economy for the years 1961-2006. The 11 net outputs are:
• Domestic consumption (excluding market residential rents and the services of
owner occupied housing);
• Government investment;
5 The final section of Appendix 1 has some new material on how the real net income model used in the
present paper can be extended from a single production sector to the case of many industries. Also the final section of Appendix 4 has some suggestions for improving the measurement of productivity by Statistics Canada but these recommendations may be useful for other official productivity programs. The next revision of the System of National Accounts 1993 will introduce capital services into the accounts so that price and quantity decompositions of primary inputs will be possible, which will greatly facilitate the measurement of productivity by sector. However, the introduction of capital services into the main production accounts will not be easy and it will be necessary for statistical agencies to do a considerable amount of preparatory work.
• Business sector investment in residential structures; • Business sector investment in nonresidential structures; • Business sector investment in machinery and equipment; • Inventory change;
• Sales of goods and services by the business sector to the nonmarket sector less
sales of goods and services from the nonmarket sector to the business sector;
• Exports of goods; • Exports of services;
• Imports of goods (the quantities are indexed with a minus sign) and • Imports of services (the quantities are indexed with a minus sign).
The eight primary inputs into the business sector are:
• The labour services of workers with primary or secondary education
• The labour services of workers with some or completed post secondary certificate
or diploma;
• The labour services of workers with a university degree or above;6
• The stock of machinery and equipment available to the business sector at the start
of each year;
• The starting stock of business sector nonresidential structures;
• The stock of nonagricultural, nonresidential land used by the business sector; • The stock of agricultural land used by the business sector and
• The starting stocks of inventories used by the business sector.
As is explained in Appendix 2, user cost prices for the last five primary inputs were constructed, using balancing or endogenous real rates of return that made the value of net output produced by the business sector equal to the value of primary inputs used by the business sector. All of the price and quantity series for the above 19 outputs produced and inputs used by the Canadian business sector are listed in Appendix 2.
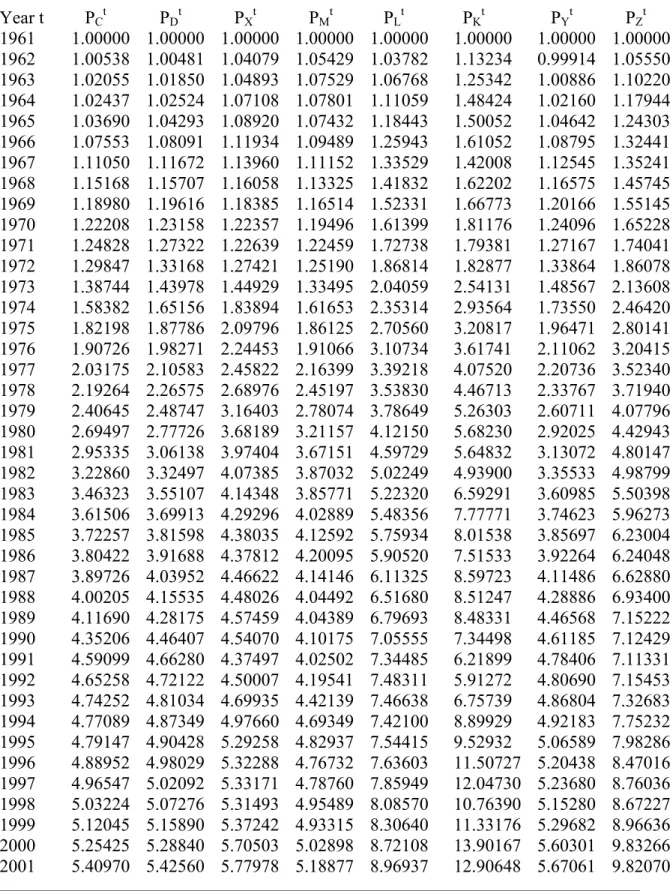
In this section, we will aggregate the above net outputs and primary inputs into D, domestic output, equal to an aggregate of the first seven net outputs listed above; X, exports equal to an aggregate of exports of goods and services; M, imports equal to an aggregate of imports of goods and services; L, labour services equal to an aggregate of the three types of labour and K, capital services equal to an aggregate of the five types of capital services. Once these aggregates have been constructed, we further aggregate the three net outputs, D+X−M, into real gross domestic product Y and aggregate the two inputs, L and K, into domestic input Z and finally construct a conventional measure of productivity Y/Z. The aggregations were performed using chained Törnqvist price indexes.7 The results are listed in Tables 1 and 2 below.
Table 1: Prices of Canadian Business Sector Output and Input Aggregates
6 These three types of labour input are taken directly from Statistics Canada recent KLEMS program; see
Baldwin, Gu and Yan (2007; 26-27) for a description of these data.
Year t PCt PDt PXt PMt PLt PKt PYt PZt 1961 1.00000 1.00000 1.00000 1.00000 1.00000 1.00000 1.00000 1.00000 1962 1.00538 1.00604 1.04079 1.05429 1.03782 1.07866 1.00119 1.05019 1963 1.02055 1.02047 1.04893 1.07529 1.06768 1.15414 1.01219 1.09369 1964 1.02437 1.03043 1.07108 1.07801 1.11059 1.29428 1.02740 1.16537 1965 1.03690 1.05086 1.08920 1.07432 1.18443 1.32443 1.05415 1.22651 1966 1.07553 1.08973 1.11934 1.09489 1.25943 1.40672 1.09618 1.30371 1967 1.11050 1.12467 1.13960 1.11152 1.33529 1.32261 1.13258 1.33255 1968 1.15168 1.16183 1.16058 1.13325 1.41832 1.43747 1.16968 1.42527 1969 1.18980 1.20312 1.18385 1.16514 1.52331 1.49218 1.20821 1.51488 1970 1.22208 1.24102 1.22357 1.19496 1.61399 1.59733 1.24955 1.61015 1971 1.24828 1.28420 1.22639 1.22459 1.72738 1.61830 1.28315 1.69437 1972 1.29847 1.34270 1.27421 1.25190 1.86814 1.66927 1.34913 1.80669 1973 1.38744 1.44951 1.44929 1.33495 2.04059 2.08558 1.49015 2.05625 1974 1.58382 1.66194 1.83894 1.61653 2.35314 2.40261 1.73605 2.37045 1975 1.82198 1.88606 2.09796 1.86125 2.70560 2.65389 1.96247 2.69075 1976 1.90726 1.99309 2.24453 1.91066 3.10734 2.92888 2.10552 3.05088 1977 2.03175 2.11743 2.45822 2.16399 3.39218 3.23324 2.20694 3.34276 1978 2.19264 2.28009 2.68976 2.45197 3.53830 3.53313 2.34394 3.54211 1979 2.40645 2.50051 3.16430 2.78074 3.78649 4.04780 2.60589 3.88194 1980 2.69497 2.78540 3.68189 3.21157 4.12150 4.40228 2.91090 4.22415 1981 2.95335 3.07520 3.97404 3.67151 4.59729 4.58375 3.13761 4.59923 1982 3.22860 3.33538 4.07385 3.87032 5.02249 4.39571 3.36479 4.80577 1983 3.46323 3.53148 4.14348 3.85771 5.22320 5.20880 3.58558 5.23463 1984 3.61506 3.66530 4.29296 4.02889 5.48356 5.80907 3.70980 5.62172 1985 3.72257 3.77548 4.38035 4.12592 5.75934 5.97382 3.81494 5.85783 1986 3.80422 3.86808 4.37812 4.20095 5.90520 5.77499 3.87756 5.87940 1987 3.89726 3.97810 4.46622 4.14146 6.11325 6.31252 4.04688 6.20607 1988 4.00205 4.08604 4.48026 4.04492 6.51680 6.32027 4.20445 6.47093 1989 4.11690 4.20482 4.57459 4.04389 6.79693 6.36304 4.36602 6.66789 1990 4.35206 4.36935 4.54070 4.10175 7.05555 5.89282 4.49949 6.66390 1991 4.59099 4.51357 4.37497 4.02502 7.34485 5.29918 4.61930 6.62419 1992 4.65258 4.56253 4.50007 4.19541 7.48311 5.17213 4.63861 6.66114 1993 4.74252 4.64763 4.69935 4.42139 7.46638 5.60256 4.70077 6.81843 1994 4.77089 4.72176 4.97660 4.69349 7.42100 6.65009 4.76752 7.19244 1995 4.79147 4.75262 5.29258 4.82937 7.54415 6.96045 4.89248 7.38760 1996 4.88952 4.82071 5.32288 4.76732 7.63603 7.86537 5.01269 7.78656 1997 4.96547 4.86150 5.33171 4.78760 7.85949 8.14277 5.04667 8.03215 1998 5.03224 4.91712 5.31493 4.95489 8.08570 7.64057 4.98891 7.98590 1999 5.12045 4.98119 5.37242 4.93315 8.30640 7.86796 5.10149 8.21103 2000 5.25425 5.09408 5.70503 5.02898 8.72108 9.01480 5.36189 8.90816 2001 5.40970 5.21531 5.77978 5.18877 8.96937 8.63241 5.42583 8.91600 2002 5.47743 5.29828 5.67251 5.21950 9.09698 8.74127 5.42233 9.03742 2003 5.61543 5.37928 5.60179 4.88445 9.26199 8.62922 5.66586 9.09575 2004 5.69263 5.46192 5.72405 4.76048 9.48930 9.66050 5.90257 9.63757 2005 5.80796 5.59965 5.88377 4.70288 9.87728 10.35423 6.17961 10.14775
2006 5.90800 5.72495 5.89047 4.66574 10.26222 10.49052 6.34295 10.43827 Note that we have also listed the price of our household consumption aggregate, PCt, in Table 1, which will play a role in subsequent sections. The productivity level in year t of the Canadian business sector Tt can be defined as the aggregate year t output, QYt divided by aggregate year t input, QZt:8
(1) Tt ≡ QYt/QZt ; t = 1961, ..., 2006. Productivity growth for year t, τt, is defined as the productivity level in year t divided by the previous year’s productivity level:
(2) τt ≡ Tt/Tt−1 ; t = 1962, ..., 2006. Table 2 lists the quantities that match up to the prices in Table 1 and it also lists productivity levels and growth rates.
Table 2: Quantities of Canadian Business Sector Output and Input Aggregates, TFP Levels and TFP Growth Rates
Year t QDt QXt QMt QLt QKt QYt QZt Tt τt 1961 28553 7310 -8180 19202 8481 27683 27683 1.00000 ____ 1962 30697 7639 -8370 20012 8566 29973 28574 1.04894 1.04894 1963 31767 8323 -8513 20542 8717 31608 29253 1.08053 1.03011 1964 34490 9465 -9602 21444 8894 34384 30313 1.13429 1.04975 1965 37709 9890 -10905 22383 9191 36697 31540 1.16350 1.02575 1966 40538 11233 -12376 23547 9627 39409 33135 1.18933 1.02220 1967 40824 12426 -13055 24022 10198 40230 34193 1.17656 0.98926 1968 42754 13925 -14404 24122 10642 42329 34738 1.21851 1.03566 1969 45856 15050 -16278 24696 10992 44712 35660 1.25382 1.02898 1970 46098 16447 -16005 24779 11403 46583 36150 1.28858 1.02772 1971 48725 17212 -17073 25303 11782 48922 37049 1.32048 1.02475 1972 51835 18694 -19554 26041 12156 51099 38158 1.33916 1.01415 1973 56896 20568 -22397 27562 12533 55285 40064 1.37989 1.03042 1974 61516 19655 -24652 28524 13073 56755 41566 1.36543 0.98952 1975 63743 18031 -23889 28504 13741 57880 42214 1.37110 1.00416 1976 68060 19422 -25376 28490 14419 62103 42859 1.44899 1.05681 1977 71010 20646 -25281 28777 15090 66338 43798 1.51466 1.04532 1978 72172 22694 -26058 29989 15736 68990 45653 1.51117 0.99770 1979 75729 23523 -27910 31726 16318 71447 47961 1.48968 0.98578 1980 75289 23748 -27013 32803 17082 72278 49807 1.45115 0.97414 1981 78730 24170 -27702 33691 17795 75362 51412 1.46584 1.01012 1982 70788 23789 -23204 32044 18716 72281 50608 1.42825 0.97436 1983 74223 25195 -25549 32267 19086 74730 51188 1.45991 1.02217 1984 78814 29833 -29968 33481 19386 79846 52690 1.51537 1.03799 1985 83764 31267 -32486 34856 19824 83663 54486 1.53550 1.01328
1986 86839 32607 -34820 36368 20368 85719 56533 1.51626 0.98747 1987 92299 33566 -36671 38149 20912 90247 58848 1.53354 1.01140 1988 98137 36570 -41604 39886 21617 94316 61281 1.53907 1.00360 1989 102477 36930 -44024 40932 22568 96612 63260 1.52722 0.99231 1990 99919 38654 -44876 40977 23574 95128 64231 1.48103 0.96976 1991 95966 39352 -45982 39695 24283 90973 63439 1.43403 0.96826 1992 95238 42175 -48154 39296 24793 91038 63396 1.43602 1.00139 1993 96615 46743 -51718 40147 25038 93608 64535 1.45049 1.01008 1994 101167 52672 -55933 41702 25236 100113 66360 1.50864 1.04009 1995 102221 57152 -59169 42913 25690 102719 68026 1.50999 1.00090 1996 107694 60353 -62199 44189 26249 108503 69850 1.55337 1.02873 1997 117236 65384 -71100 45611 26977 114561 71979 1.59157 1.02459 1998 119529 71347 -74731 47066 28283 119598 74714 1.60073 1.00575 1999 122519 78969 -80562 48740 29521 124890 77594 1.60953 1.00550 2000 130510 86010 -87116 50524 30704 133798 80534 1.66138 1.03221 2001 130835 83474 -82635 51230 32034 135654 82552 1.64325 0.98908 2002 136452 84475 -84039 52278 32939 140807 84482 1.66670 1.01427 2003 139200 82558 -87489 53274 33666 138361 86187 1.60536 0.96320 2004 148475 86537 -94812 55151 34326 144844 88710 1.63278 1.01708 2005 156678 88443 -101927 55936 35336 148613 90500 1.64213 1.00573 2006 164655 89077 -107002 56885 36637 152627 92746 1.64565 1.00214 The average rate of TFP growth over the 45 years 1962-2006 is 1.14% per year,9 which is
much higher than the 0.5 to 0.7% per year range that Diewert and Lawrence (2000) found over the period 1962-1996. The present 1.14% average rate of TFP growth can also be compared with Statistics Canada’s recent KLEMS program average Multifactor Productivity Growth over the same years of 0.43% per year,10 which is a rather substantial difference! In Appendix 4 below, we attempt to determine why our results are so different from the official Statistics Canada results.11
Over the golden years 1962-1973, TFP growth averaged 2.73% per year; over the dismal years, 1974-1991, TFP growth averaged only 0.25% per year but over the remainder of the nineties, 1992-1999, TFP growth nicely recovered to average a very respectable
9 This rate of TFP growth is reasonably close to the average rate of productivity growth for Australia
obtained by Diewert and Lawrence (2006) using a similar methodology and over a similar period. The Diewert and Lawrence market sector average rate of TFP growth for Australia over the period 1961-2004 was 1.49% per year. However, there is an upward bias in the Diewert and Lawrence results due to the fact that they essentially used hours worked as their measure of labour input instead of a quality adjusted measure of labour input for Australia (which was not available).
10 See CANSIM II series V41712881, Canada, Multifactor Productivity, Business Sector, table 3830021,
Multifactor Productivity, Value Added, Capital Input and Labour Input in the Aggregate Business Sector and Major Sub-Sectors. Comparing levels of TFP with the starting level being 1 in 1961, our TFP ended up at 1.65 in 2006 whereas KLEMS Multifactor Productivity ended up at 1.20 in 2006. This is a very substantial difference.
11 Our measures of business sector output and capital input were different from the KLEMS measures
because we excluded rental housing from our measure of value added and we excluded the land and residential structures inputs from our measure of capital services, whereas the KLEMS measures included rental housing in their output and capital input measures. Our measures of labour input were identical and it turned out that the average rate of growth of our business sector value added measure was very close to the corresponding KLEMS average growth rate. The capital services growth rates differed substantially.
1.46% per year. During the naughts, 2000-2006, TFP growth again fell off to average only 0.34% per year. There were two recent poor productivity growth years, 2001 and 2003, where drops of 1.09% and 3.68% occurred and if these years are excluded, the average TFP growth rate during the remaining years of the naughts is 1.43% per year. Hopefully the Canadian productivity recovery since the recession of 1991 is not a statistical mirage and it will continue into the future.
However, productivity growth is not necessarily the entire story behind the growth in living standards: if the price of Canadian exports increases more rapidly than the price of Canadian imports, then the real income generated by the business sector should increase. This terms of trade effect is not taken into account in the above productivity computations. Thus in the following section, we implement the translog real income methodology explained in sections 1- 4 of Appendix 1 below and this approach will enable us to assess the contribution to Canadian living standards of improvements in Canada’s terms of trade.
3. Explaining Real Income Growth Generated by the Canadian Business Sector: the Gross Output Approach
The basic methodology used in this section can easily be explained in nontechnical terms. The business sector faces (exogenous) domestic and international prices for the net outputs it produces: domestic outputs, exports and (minus) imports. The business sector also utilizes inputs of labour and capital in order to produce its outputs. The value of outputs produced by the business sector less the value of imports used (value added) must eventually flow back to the labour and capital primary inputs that were used to produce value added. This is the (gross) income generated by the business sector. We divide this gross income in year t by the price of consumption in year t, PCt, in order to turn this nominal income into real income ρt; this real income is the number of consumption bundles that could be purchased by the owners of the labour and capital inputs that were used in year t by the Canadian business sector. We also divide each of the prices PDt, PXt, PMt, PLt and PKt by the price of consumption, PCt, in order to form the corresponding real output and input prices facing the Canadian business sector in each year. Our measure of the (gross) real income generated by the business sector ρt and the corresponding real output and input prices are listed in Table 3.
Table 3: Gross Real Income Generated by the Canadian Business Sector and Real Output and Input Prices
Year t ρt PDt/PCt PXt/PCt PMt/PCt PLt/PCt PKt/PCt 1961 27683 1.00000 1.00000 1.00000 1.00000 1.00000 1962 29848 1.00065 1.03522 1.04865 1.03226 1.07288 1963 31349 0.99992 1.02781 1.05363 1.04618 1.13090 1964 34486 1.00592 1.04560 1.05236 1.08417 1.26349 1965 37307 1.01347 1.05044 1.03608 1.14228 1.27730 1966 40165 1.01320 1.04074 1.01800 1.17099 1.30793
1967 41030 1.01276 1.02620 1.00092 1.20243 1.19101 1968 42990 1.00882 1.00773 0.98400 1.23152 1.24815 1969 45404 1.01119 0.99500 0.97927 1.28031 1.25414 1970 47630 1.01550 1.00122 0.97781 1.32069 1.30705 1971 50289 1.02878 0.98247 0.98102 1.38380 1.29643 1972 53093 1.03407 0.98132 0.96413 1.43872 1.28557 1973 59377 1.04473 1.04458 0.96217 1.47076 1.50319 1974 62210 1.04932 1.16108 1.02065 1.48574 1.51697 1975 62343 1.03517 1.15147 1.02155 1.48498 1.45660 1976 68558 1.04500 1.17684 1.00178 1.62921 1.53565 1977 72059 1.04217 1.20990 1.06509 1.66959 1.59135 1978 73750 1.03988 1.22672 1.11827 1.61371 1.61136 1979 77368 1.03908 1.31492 1.15554 1.57347 1.68206 1980 78069 1.03355 1.36621 1.19169 1.52933 1.63352 1981 80063 1.04126 1.34561 1.24317 1.55664 1.55205 1982 75330 1.03307 1.26180 1.19876 1.55562 1.36149 1983 77370 1.01971 1.19642 1.11391 1.50819 1.50403 1984 81938 1.01390 1.18752 1.11447 1.51687 1.60691 1985 85739 1.01421 1.17670 1.10835 1.54714 1.60476 1986 87372 1.01679 1.15086 1.10429 1.55228 1.51805 1987 93711 1.02074 1.14599 1.06266 1.56860 1.61973 1988 99086 1.02099 1.11949 1.01071 1.62836 1.57926 1989 102458 1.02136 1.11117 0.98227 1.65098 1.54559 1990 98351 1.00397 1.04334 0.94248 1.62120 1.35403 1991 91534 0.98314 0.95295 0.87672 1.59984 1.15426 1992 90764 0.98064 0.96722 0.90174 1.60838 1.11167 1993 92784 0.97999 0.99090 0.93229 1.57435 1.18135 1994 100042 0.98970 1.04312 0.98378 1.55547 1.39389 1995 104884 0.99189 1.10458 1.00791 1.57450 1.45267 1996 111236 0.98593 1.08863 0.97501 1.56171 1.60862 1997 116434 0.97906 1.07376 0.96418 1.58283 1.63988 1998 118568 0.97712 1.05617 0.98463 1.60678 1.51832 1999 124427 0.97280 1.04921 0.96342 1.62220 1.53658 2000 136539 0.96952 1.08579 0.95713 1.65982 1.71572 2001 136059 0.96407 1.06841 0.95916 1.65802 1.59573 2002 139391 0.96729 1.03562 0.95291 1.66081 1.59587 2003 139604 0.95795 0.99757 0.86983 1.64938 1.53670 2004 150185 0.95947 1.00552 0.83625 1.66695 1.69702 2005 158122 0.96413 1.01305 0.80973 1.70065 1.78277 2006 163864 0.96902 0.99703 0.78973 1.73700 1.77565
Thus the gross real income generated by the Canadian business sector has grown from $27,683 million dollars worth of 1961 consumption bundles in 1961 to $163,864 million in 2006, a 5.92 fold increase. Looking at the change in real input and output prices, the real price of domestic output has fallen to .969 times the starting level (due to the fact that machinery and equipment prices have risen less rapidly than the price of consumption)
and the real price of exports has fallen slightly to .997 times the starting level. However, the real price of imports has fallen substantially to .790 times the starting level. This probably reflects the “China factor”; i.e., the growth of lower priced imports from Asia in recent years. The quality adjusted real wages of business sector workers have risen to 1.74 times their initial 1961 levels. The real price of capital services has risen 1.78 fold, reflecting rapidly rising prices of agricultural land and nonagricultural business land as well as upward trends in machinery and equipment depreciation rates and in real rates of return; see Appendix 2 for details.12
There are six quantitative factors that can be used to explain the real income ρt generated by the business sector in year t:
• The price of domestic production (an aggregate of C+I+G) relative to the price of
consumption in year t, PDt/PCt;
• The price of exports relative to the price of consumption in year t, PXt/PCt; • The price of imports relative to the price of consumption in year t, PMt/PCt; • The quantity of labour used by the business sector in year t, QLt;
• The quantity of capital used by the business sector in year t, QKt and • The level of technology of the business sector in year t.
The formal model outlined in Appendix 1, based on the work of Diewert and Morrison (1986) and Kohli (1990), allows us to decompose the growth of real income from year t−1 to t, ρt/ρt−1, into multiplicative year to year contribution factors αDt, αXt, αMt, βLt, βKt and τt that describe the effects of changes in the six explanatory variables listed above going from year t−1 to t. The model outlined in Appendix 1 leads to the following equation which decomposes the year to year growth in real income generated by the business sector, ρt/ρt−1, into a product of six year to year explanatory contribution factors:13
(3) ρt/ρt−1 =
τt αDtαXtαMtβLtβKt ; t = 1962, 1963,...,2006. Thus if αDt is greater than one, this means that the domestic price of output grew faster than the price of consumption going from year t−1 to t and αDt measures the contribution of rising real domestic output prices to the growth in real income. Similarly, if αXt is greater than one, this means that Canadian export prices grew faster than the price of consumption going from year t−1 to t and αXt measures the contribution of rising real export prices to the growth in real income generated by the Canadian business sector. However, if if αMt is greater than one, this means that Canadian import prices did not increase as quickly as the price of consumption going from year t−1 to t and αMt
12 The volatility of the real price of capital services reflects the fact that we have used balancing real rates
of return in our user costs and these real rates are subject to a considerable amount of measurement error. One would expect the aggregate real price of capital services to decline, reflecting the decline in the real price of machinery and equipment, but this decline is offset by a large increase in the real price of land services.
13 See equations (42), (51) and (56) in Appendix 1 in order to derive this equation. All of the variables in
measures the contribution of falling real import prices to the growth in real income generated by the Canadian business sector. If βLt is greater than one, then business sector labour input increased going from year t−1 to t and βLt measures the contribution of the increase in labour input to the growth in real income generated by the Canadian business sector. Similarly, if βKt is greater than one, then business sector capital services input increased going from year t−1 to t and βKt measures the contribution of the increase in capital input to the growth in real income generated by the Canadian business sector. Finally, if τt is greater than one, then the efficiency of the Canadian business sector increased from year t−1 to t and τt measures the contribution of the efficiency increase to the growth in real income generated by the Canadian business sector. These year to year contribution factors are listed in Table 4 along with the averages of these contribution factors in the last two rows of the Table.14
Table 4: Business Sector Year to Year Growth in Real Income and Year to Year Contribution Factors Year t ρt/ρt−1 τt αDt αXt αMt βLt βKt αXMt 1962 1.07821 1.04894 1.00067 1.00920 0.98609 1.02905 1.00306 0.99516 1963 1.05029 1.03011 0.99925 0.99807 0.99863 1.01817 1.00547 0.99670 1964 1.10006 1.04975 1.00605 1.00481 1.00035 1.02964 1.00643 1.00517 1965 1.08182 1.02575 1.00762 1.00131 1.00466 1.02955 1.01060 1.00597 1966 1.07661 1.02220 0.99973 0.99736 1.00544 1.03541 1.01465 1.00279 1967 1.02153 0.98927 0.99956 0.99578 1.00536 1.01396 1.01772 1.00112 1968 1.04777 1.03566 0.99609 0.99423 1.00554 1.00293 1.01297 0.99974 1969 1.05614 1.02898 1.00239 0.99584 1.00164 1.01642 1.00996 0.99747 1970 1.04903 1.02772 1.00427 1.00211 1.00051 1.00235 1.01137 1.00262 1971 1.05583 1.02475 1.01294 0.99357 0.99891 1.01456 1.01014 0.99249 1972 1.05576 1.01415 1.00516 0.99960 1.00599 1.02036 1.00938 1.00559 1973 1.11836 1.03041 1.01037 1.02234 1.00073 1.04019 1.00940 1.02309 1974 1.04771 0.98952 1.00448 1.03927 0.97762 1.02367 1.01349 1.01601 1975 1.00214 1.00416 0.98587 0.99710 0.99965 0.99952 1.01609 0.99675 1976 1.09970 1.05681 1.00996 1.00729 1.00748 0.99967 1.01562 1.01482 1977 1.05105 1.04532 0.99720 1.00947 0.97745 1.00676 1.01503 0.98670 1978 1.02348 0.99770 0.99775 1.00501 0.98144 1.02767 1.01430 0.98636 1979 1.04906 0.98577 0.99922 1.02735 0.98678 1.03732 1.01276 1.01377 1980 1.00906 0.97414 0.99464 1.01572 0.98731 1.02171 1.01642 1.00283 1981 1.02555 1.01012 1.00753 0.99378 0.98234 1.01749 1.01447 0.97623 1982 0.94088 0.97436 0.99216 0.97446 1.01464 0.96754 1.01739 0.98873 1983 1.02708 1.02215 0.98739 0.97925 1.02743 1.00449 1.00696 1.00611 1984 1.05903 1.03799 0.99443 0.99694 0.99980 1.02334 1.00587 0.99674
14 The fifth row from the bottom gives the average over the years 1962-2006 and the remaining rows give
the averages over the years 1962-1973, 1974-1991, 1992-1999 and 2000-2006. The careful reader will notice that the productivity growth rates τt listed in Table 4 do not quite agree with those listed in Table 2.
The reason for these small differences is that when calculating τt in Table 4, the input aggregate is a direct Törnqvist quantity index whereas in Table 2, the input aggregate was an implicit quantity index; i.e., the value of inputs was deflated by the Törnqvist input price index.
1985 1.04639 1.01328 1.00031 0.99607 1.00228 1.02544 1.00843 0.99834 1986 1.01904 0.98748 1.00254 0.99051 1.00158 1.02744 1.00986 0.99208 1987 1.07256 1.01140 1.00392 0.99822 1.01658 1.03119 1.00947 1.01477 1988 1.05736 1.00360 1.00024 0.99041 1.02128 1.02923 1.01177 1.01149 1989 1.03403 0.99231 1.00037 0.99697 1.01215 1.01717 1.01486 1.00909 1990 0.95991 0.96976 0.98263 0.97480 1.01777 1.00073 1.01460 0.99212 1991 0.93069 0.96826 0.97873 0.96354 1.03198 0.97848 1.00939 0.99435 1992 0.99159 1.00139 0.99739 1.00641 0.98716 0.99300 1.00636 0.99348 1993 1.02225 1.01008 0.99932 1.01154 0.98351 1.01486 1.00307 0.99486 1994 1.07823 1.04006 1.01001 1.02729 0.97166 1.02559 1.00264 0.99817 1995 1.04840 1.00090 1.00217 1.03350 0.98654 1.01867 1.00632 1.01959 1996 1.06056 1.02872 0.99422 0.99136 1.01865 1.01871 1.00795 1.00986 1997 1.04673 1.02459 0.99324 0.99182 1.00635 1.01984 1.01045 0.99812 1998 1.01833 1.00576 0.99805 0.98983 0.98739 1.01994 1.01770 0.97734 1999 1.04942 1.00550 0.99570 0.99570 1.01364 1.02250 1.01568 1.00929 2000 1.09734 1.03221 0.99682 1.02340 1.00405 1.02271 1.01485 1.02755 2001 0.99648 0.98908 0.99479 0.98925 0.99873 1.00864 1.01628 0.98800 2002 1.02449 1.01427 1.00314 0.98020 1.00379 1.01271 1.01054 0.98391 2003 1.00153 0.96320 0.99081 0.97747 1.05240 1.01188 1.00820 1.02869 2004 1.07580 1.01708 1.00152 1.00465 1.02134 1.02172 1.00739 1.02609 2005 1.05285 1.00573 1.00462 1.00429 1.01706 1.00862 1.01146 1.02142 2006 1.03631 1.00214 1.00489 0.99120 1.01306 1.01018 1.01449 1.00415 A62-06 1.0410 1.0114 0.99934 0.99974 1.0028 1.0160 1.0111 1.0023 A62-73 1.0660 1.0273 1.0037 1.0012 1.0012 1.0210 1.0101 1.0023 A74-91 1.0253 1.0025 0.99663 0.99756 1.0025 1.0133 1.0126 0.99985 A92-99 1.0394 1.0146 0.99876 1.0059 0.99436 1.0166 1.0088 1.0001 A00-06 1.0407 1.0034 0.99951 0.99578 1.0158 1.0138 1.0119 1.0114
Looking at the sample averages listed in the fifth last row of Table 4, it can be seen that the (gross) real income generated by the Canadian business sector over the entire sample period grew at 4.10 percent per year over the 46 years 1961-2005. The biggest contributor to this growth was the growth of quality adjusted labour input at 1.6 percentage points per year. Next was Total Factor Productivity growth, τt, which contributed on average 1.14 percentage points per year, followed by capital services growth (1.11 percentage points per year) and declines in real import prices (0.28 percentage points per year). Declines in real domestic output prices and real export prices gave rise to negative average contribution factors, − 0.07 and −0.03 percentage points per year respectively. The last column in Table 4 gives the product of the real export and real import price contribution factors, αXMt , defined as:
(4) αXMt ≡ αXt αMt .
Roughly speaking, αXMt is a terms of trade contribution factor; it gives the contribution to real income growth of the combined effects of real changes in the international prices
facing the Canadian business sector.15 It can be seen that the effects of changing real international prices are not negligible for Canada: on average, changing real export and import prices contributed 0.23 percentage points per year to real income growth over the entire sample period.16 However, for shorter periods, the effects of changing real international prices can be far more important in explaining changes in the real income generated by the market sector of an economy. Thus if we restrict our attention to the period 2000-2006, it can be seen by looking at the last row of Table 4 that the effects of improvements in Canada’s terms of trade become almost as important as the effects of capital deepening; i.e., during this period, the average annual growth in the real income generated by the Canadian business sector was 4.07 percent per year and the following factors explained this growth rate: decreases in the real price of imports (1.58), increases in quality adjusted labour input (1.38), increases in capital services input, 1.19) and improvements in TFP (0.34). There were small negative contributors to market sector real income growth during the naughts: decreases in the real price of domestically produced goods and services (−0.05) and decreases in the real price of exports (−0.42). Thus decreases in the real price of imports proved to be the most important factor in explaining the growth in real income generated by the market sector during this period. Overall, the joint effects of changes in real export and import prices contributed about 1.14 percentage points per year on average to the growth of market sector real income during the naughts, which was very close to the contribution of capital deepening over this period (which was 1.19 percentage points per year on average).17
The last four rows of Table 4 present the various growth factors for 4 subperiods:
• The 12 golden years for the Canadian economy, 1962-1973, when the real income
generated by the business sector grew by 6.60% per year and TFP growth was a stellar 2.73% per year;
• The 18 dismal years for the Canadian economy, 1974-1991, characterized by
stagflation, oil shocks and rapidly increasing tax rates when the real income generated by the business sector grew by 2.53% per year and TFP growth was a disappointing 0.25% per year;
• The 8 years in the nineties after the recession of 1991, 1992-1999, when real
income growth recovered to 3.94% per year and TFP growth also recovered to 1.46% per year and
• The 7 years in the present century, 2000-2006, when TFP growth dropped off to
0.34% per year but real income growth was still strong at 4.07% per year due to the very strong contribution made by falling real import prices during this period, which contributed on average 1.58% per year to real income growth.
15 Ulrich Kohli has pointed out that this is a slight abuse of terminology. Strictly speaking, the terms of
trade is the price of exports over the price of imports and hence involves only two prices. Our definition of
αXMt involves three prices: the price of exports, the price of imports and the price of domestic consumption.
Our terms of trade contribution factor is the rate of change counterpart to Kohli’s (2006; 50) trading gains factor. See Appendix 3 for a discussion of the differences between our approach and that of Kohli.
16 Thus the contribution of falling real import prices outweighs the effects of falling real export prices. 17 These results are very similar to the results obtained for Australia using a similar framework by Diewert
and Lawrence (2006); i.e., both Australia and Canada have had very favourable changes in their terms of trade in recent years which contributed greatly to real income growth during the naughts.
The annual change information in Table 4 can be converted into levels using equations (46) in Appendix 1 (with obvious extensions to multiple inputs and outputs). Thus let Tt, ADt, AXt, AMt, BLt, BKt and AXMt be the cumulated products of the annual link factors τt, αDt, αXt, αMt, βLt, βKt and αXMt respectively. Using these definitions and cumulating equations (3) leads to the following equation, which explains the cumulative growth in real gross income generated by the Canadian business sector relative to the base year 1961:
(5) ρt/ρ1961 = Tt ADt AXt AMt BLt BKt ; t = 1962, 1963, ... , 2006. The cumulated variables that appear in (5) above are reported in Table 5 below along with the cumulated terms of trade contribution factor, AXMt defined to be the product of the two cumulated international price factors, AXt and AMt.
Table 5: Business Sector Cumulated Growth in Real Income and Cumulated Contribution Factors Year t ρt/ρ1961 Tt ADt AXt AMt BLt BKt AXMt 1961 1.00000 1.00000 1.00000 1.00000 1.00000 1.00000 1.00000 1.00000 1962 1.07821 1.04894 1.00067 1.00920 0.98609 1.02905 1.00306 0.99516 1963 1.13243 1.08053 0.99992 1.00725 0.98474 1.04774 1.00855 0.99188 1964 1.24574 1.13429 1.00598 1.01210 0.98508 1.07880 1.01503 0.99700 1965 1.34766 1.16350 1.01365 1.01342 0.98967 1.11068 1.02579 1.00295 1966 1.45090 1.18933 1.01337 1.01075 0.99506 1.15001 1.04083 1.00575 1967 1.48214 1.17656 1.01292 1.00648 1.00039 1.16605 1.05927 1.00687 1968 1.55294 1.21852 1.00896 1.00067 1.00594 1.16947 1.07301 1.00661 1969 1.64012 1.25382 1.01136 0.99651 1.00758 1.18867 1.08370 1.00406 1970 1.72054 1.28858 1.01568 0.99861 1.00810 1.19146 1.09602 1.00669 1971 1.81659 1.32048 1.02883 0.99219 1.00700 1.20882 1.10713 0.99914 1972 1.91789 1.33916 1.03413 0.99179 1.01304 1.23343 1.11752 1.00472 1973 2.14490 1.37988 1.04486 1.01395 1.01378 1.28301 1.12802 1.02792 1974 2.24723 1.36542 1.04954 1.05377 0.99109 1.31337 1.14324 1.04438 1975 2.25203 1.37110 1.03470 1.05071 0.99074 1.31274 1.16163 1.04098 1976 2.47656 1.44898 1.04501 1.05837 0.99815 1.31230 1.17978 1.05641 1977 2.60299 1.51465 1.04208 1.06839 0.97564 1.32117 1.19751 1.04236 1978 2.66411 1.51116 1.03974 1.07374 0.95753 1.35773 1.21464 1.02814 1979 2.79480 1.48967 1.03893 1.10311 0.94487 1.40840 1.23014 1.04230 1980 2.82011 1.45114 1.03336 1.12045 0.93288 1.43898 1.25034 1.04525 1981 2.89215 1.46583 1.04115 1.11348 0.91641 1.46416 1.26843 1.02040 1982 2.72118 1.42824 1.03299 1.08504 0.92983 1.41662 1.29050 1.00890 1983 2.79487 1.45988 1.01996 1.06253 0.95533 1.42298 1.29948 1.01507 1984 2.95987 1.51533 1.01428 1.05927 0.95514 1.45619 1.30711 1.01176 1985 3.09719 1.53546 1.01459 1.05510 0.95732 1.49323 1.31813 1.01008 1986 3.15615 1.51623 1.01717 1.04509 0.95884 1.53420 1.33112 1.00207 1987 3.38516 1.53351 1.02116 1.04324 0.97473 1.58205 1.34373 1.01688
1988 3.57932 1.53904 1.02141 1.03323 0.99548 1.62829 1.35954 1.02856 1989 3.70111 1.52720 1.02178 1.03010 1.00758 1.65624 1.37974 1.03791 1990 3.55274 1.48101 1.00403 1.00414 1.02548 1.65746 1.39989 1.02973 1991 3.30651 1.43401 0.98267 0.96752 1.05828 1.62179 1.41304 1.02391 1992 3.27871 1.43600 0.98011 0.97372 1.04469 1.61044 1.42203 1.01724 1993 3.35165 1.45047 0.97944 0.98496 1.02746 1.63437 1.42639 1.01200 1994 3.61385 1.50858 0.98925 1.01183 0.99834 1.67620 1.43015 1.01016 1995 3.78877 1.50994 0.99140 1.04573 0.98490 1.70749 1.43920 1.02994 1996 4.01820 1.55331 0.98567 1.03670 1.00327 1.73944 1.45064 1.04009 1997 4.20598 1.59151 0.97901 1.02822 1.00964 1.77394 1.46579 1.03814 1998 4.28306 1.60067 0.97710 1.01777 0.99691 1.80932 1.49173 1.01462 1999 4.49471 1.60947 0.97291 1.01339 1.01051 1.85003 1.51513 1.02404 2000 4.93225 1.66132 0.96981 1.03711 1.01461 1.89205 1.53764 1.05226 2001 4.91489 1.64318 0.96475 1.02596 1.01332 1.90839 1.56267 1.03963 2002 5.03524 1.66664 0.96778 1.00564 1.01716 1.93264 1.57914 1.02290 2003 5.04294 1.60530 0.95888 0.98299 1.07046 1.95560 1.59208 1.05225 2004 5.42519 1.63271 0.96034 0.98756 1.09331 1.99809 1.60385 1.07970 2005 5.71189 1.64206 0.96478 0.99179 1.11196 2.01530 1.62223 1.10283 2006 5.91929 1.64558 0.96949 0.98307 1.12648 2.03582 1.64574 1.10741 Looking at the last row of Table 5, it can be seen that the gross real income generated by the business sector grew 5.92 fold over the years 1961-2006. The main factors explaining this growth are growth of quality adjusted labour input (cumulative growth factor 2.04), productivity increases (cumulative growth factor 1.65), growth of capital services (cumulative growth factor 1.65) and lower real import prices (cumulative growth factor 1.13). There were negative contributions from declining real domestic output prices (cumulative growth factor 0.97) and declining real export prices (cumulative growth factor .98). In recent years, the real prices of Canada’s raw materials exports have increased dramatically. However, these increases do not show up in the AXt column of Table 5; i.e., the overall real price of Canadian exports has remained relatively constant in recent years. This apparent contradiction can be explained by falling real prices for Canadian exports of manufactured goods. As already noted above, the effects of falling real import prices in recent years have been substantial.
As is noted in section 5 of Appendix 1, the income concept used in this section is biased upwards. The problem is that depreciation payments are part of the user cost of capital for each asset but depreciation does not provide households with any sustainable purchasing power. Hence the measure of real income ρt that is used in this section is overstated. In the following section, we implement the net real income model that is described in more detail in section 5 of Appendix 1.
4. Explaining Real Income Growth Generated by the Canadian Business Sector: the Net Output Approach
The overstatement of income problem that is implicit in the approach used in the previous section can readily be remedied: all we need to do is to take the user cost formula for an asset that has investment price PIt in year t and decompose it into two parts:
• One part that represents depreciation and foreseen obsolescence, δPItKt, and • The remaining part that is the reward for postponing consumption, rt PIt Kt.
The depreciation part δPItKt, will be removed from the user cost and treated as an intermediate input as an offset to gross investment. We now explain this rather simple idea in more detail below.
In our empirical work thus far (described in detail in Appendix 2), our user costs took the following form:
(6) Ut = (rt +
δt + τBt)PIt
where rt is the balancing period t real rate of interest, δt is a geometric depreciation rate for period t, τBt is an appropriate business taxation rate on the asset (including property taxes if applicable) and PIt is the period t investment price for the asset. However, in the net product approach to the measurement of income,18 we split up each (gross product) user cost times the beginning of the period stock Kt into the depreciation component δtPItKt and the remaining term (rt+τBt)PItKt and we regard the second term as a genuine income component but we treat the first term as an intermediate input cost for the business sector and treat it as an offset to gross investment made by the business sector during the year under consideration. Thus in the present section, our new aggregate for domestic output will aggregate the same C+I+G components as before, but now we add the depreciation series for business structures and for machinery and equipment as negative outputs of the business sector. As noted above, the machinery and equipment and nonresidential structures user costs are also changed since the depreciation terms are now omitted. Thus the new investment aggregate I is a net investment aggregate (gross investment components were indexed with a positive sign in the aggregate and depreciation components were indexed with a negative sign in the aggregate) and the new capital services aggregate is now a “reward for waiting” capital services aggregate.19 The above changes mean that our aggregate data series have changed somewhat. The new net product counterparts to the old gross product Tables 1-3 are presented below as Tables 6-8.20
18 See Diewert (2006a) for a more detailed discussion of the net income approach to income measurement. 19 This approach seems to be broadly consistent with an approach advocated by Rymes (1968) (1983), who
stressed the role of waiting services: “Second, one can consider the ‘waiting’ or ‘abstinence’ associated with the net returns to capital as the nonlabour primary input.” T.K. Rymes (1968; 362). Denison (1974) also advocated a net product approach to productivity measurement.
20 The TFP growth rates
τt in Tables 7 and 9 differ slightly because when calculating τt in Table 9, the input
aggregate is a direct Törnqvist quantity index whereas in Table 7, the input aggregate was an implicit quantity index; i.e., the value of inputs was deflated by the Törnqvist input price index. Both the direct and implicit Törnqvist indexes are superlative and hence will generally approximate each other very closely; see Diewert (1978).
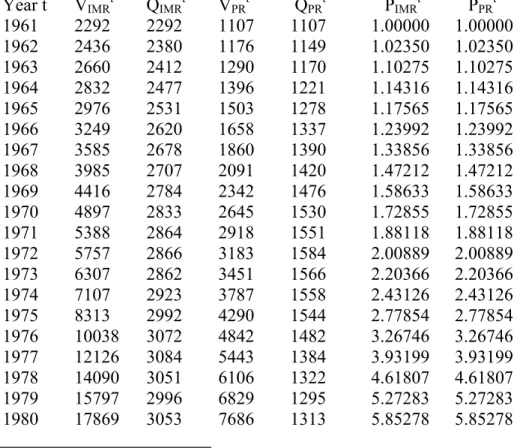
Table 6: Prices of Canadian Business Sector (Net) Output and Input Aggregates Year t PCt PDt PXt PMt PLt PKt PYt PZt 1961 1.00000 1.00000 1.00000 1.00000 1.00000 1.00000 1.00000 1.00000 1962 1.00538 1.00481 1.04079 1.05429 1.03782 1.13234 0.99914 1.05550 1963 1.02055 1.01850 1.04893 1.07529 1.06768 1.25342 1.00886 1.10220 1964 1.02437 1.02524 1.07108 1.07801 1.11059 1.48424 1.02160 1.17944 1965 1.03690 1.04293 1.08920 1.07432 1.18443 1.50052 1.04642 1.24303 1966 1.07553 1.08091 1.11934 1.09489 1.25943 1.61052 1.08795 1.32441 1967 1.11050 1.11672 1.13960 1.11152 1.33529 1.42008 1.12545 1.35241 1968 1.15168 1.15707 1.16058 1.13325 1.41832 1.62202 1.16575 1.45745 1969 1.18980 1.19616 1.18385 1.16514 1.52331 1.66773 1.20166 1.55145 1970 1.22208 1.23158 1.22357 1.19496 1.61399 1.81176 1.24096 1.65228 1971 1.24828 1.27322 1.22639 1.22459 1.72738 1.79381 1.27167 1.74041 1972 1.29847 1.33168 1.27421 1.25190 1.86814 1.82877 1.33864 1.86078 1973 1.38744 1.43978 1.44929 1.33495 2.04059 2.54131 1.48567 2.13608 1974 1.58382 1.65156 1.83894 1.61653 2.35314 2.93564 1.73550 2.46420 1975 1.82198 1.87786 2.09796 1.86125 2.70560 3.20817 1.96471 2.80141 1976 1.90726 1.98271 2.24453 1.91066 3.10734 3.61741 2.11062 3.20415 1977 2.03175 2.10583 2.45822 2.16399 3.39218 4.07520 2.20736 3.52340 1978 2.19264 2.26575 2.68976 2.45197 3.53830 4.46713 2.33767 3.71940 1979 2.40645 2.48747 3.16403 2.78074 3.78649 5.26303 2.60711 4.07796 1980 2.69497 2.77726 3.68189 3.21157 4.12150 5.68230 2.92025 4.42943 1981 2.95335 3.06138 3.97404 3.67151 4.59729 5.64832 3.13072 4.80147 1982 3.22860 3.32497 4.07385 3.87032 5.02249 4.93900 3.35533 4.98799 1983 3.46323 3.55107 4.14348 3.85771 5.22320 6.59291 3.60985 5.50398 1984 3.61506 3.69913 4.29296 4.02889 5.48356 7.77771 3.74623 5.96273 1985 3.72257 3.81598 4.38035 4.12592 5.75934 8.01538 3.85697 6.23004 1986 3.80422 3.91688 4.37812 4.20095 5.90520 7.51533 3.92264 6.24048 1987 3.89726 4.03952 4.46622 4.14146 6.11325 8.59723 4.11486 6.62880 1988 4.00205 4.15535 4.48026 4.04492 6.51680 8.51247 4.28886 6.93400 1989 4.11690 4.28175 4.57459 4.04389 6.79693 8.48331 4.46568 7.15222 1990 4.35206 4.46407 4.54070 4.10175 7.05555 7.34498 4.61185 7.12429 1991 4.59099 4.66280 4.37497 4.02502 7.34485 6.21899 4.78406 7.11331 1992 4.65258 4.72122 4.50007 4.19541 7.48311 5.91272 4.80690 7.15453 1993 4.74252 4.81034 4.69935 4.42139 7.46638 6.75739 4.86804 7.32683 1994 4.77089 4.87349 4.97660 4.69349 7.42100 8.89929 4.92183 7.75232 1995 4.79147 4.90428 5.29258 4.82937 7.54415 9.52932 5.06589 7.98286 1996 4.88952 4.98029 5.32288 4.76732 7.63603 11.50727 5.20438 8.47016 1997 4.96547 5.02092 5.33171 4.78760 7.85949 12.04730 5.23680 8.76036 1998 5.03224 5.07276 5.31493 4.95489 8.08570 10.76390 5.15280 8.67227 1999 5.12045 5.15890 5.37242 4.93315 8.30640 11.33176 5.29682 8.96636 2000 5.25425 5.28840 5.70503 5.02898 8.72108 13.90167 5.60301 9.83266 2001 5.40970 5.42560 5.77978 5.18877 8.96937 12.90648 5.67061 9.82070
2002 5.47743 5.51553 5.67251 5.21950 9.09698 13.04603 5.65565 9.95111 2003 5.61543 5.64652 5.60179 4.88445 9.26199 13.01170 5.98321 10.07433 2004 5.69263 5.75059 5.72405 4.76048 9.48930 15.46161 6.27518 10.76826 2005 5.80796 5.91458 5.88377 4.70288 9.87728 17.06379 6.60960 11.41094 2006 5.90800 6.06936 5.89047 4.66574 10.26222 17.38831 6.81227 11.78403 Comparing Table 6 with Table 1, we see that the 2006 price of domestic absorption, PD, has increased to 6.07 from its earlier 2006 gross approach level of 5.72. This is due to the fact that net investment is considerably smaller than gross investment and so the relatively low inflation price of machinery and equipment gets a much smaller weight in net domestic absorption compared to its weight in gross domestic absorption. The other striking difference between Tables 1 and 6 is that the price of waiting services, PKt, in Table 6 grew 17.4 fold over the sample period whereas the price of traditional capital services, PKt, in Table 1, grew only 10.5 fold. This difference in growth rates is explained by the fact that the price of machinery and equipment services gets a much lower weight in the Table 6 capital services aggregate compared to its weight in the Table 1 capital services aggregate because the corresponding user cost for the net concept of capital services now excludes the very large depreciation term in the net user cost. Thus the price of agricultural land and business nonagricultural land gets a much higher weight in the net user cost compared to the gross concept user cost.21 However, even though the land components now get a much higher weight in weighting services compared to machinery and equipment, the overall price increase in input prices has only increased to 11.8 fold (compared to the gross output model 10.4 fold increase in input prices) over the sample period due to the fact that the importance of capital services dramatically shrinks relative to labour services in the net output framework.
Table 7: Quantities of Canadian Business Sector Net Output and Input Aggregates, TFP Levels and TFP Growth Rates
Year t QDt QXt QMt QLt QKt QYt QZt Tt τt 1961 24559 7310 -8180 19202 4487 23689 23689 1.00000 _____ 1962 26652 7639 -8370 20012 4537 25929 24544 1.05641 1.05641 1963 27654 8323 -8513 20542 4635 27498 25169 1.09252 1.03419 1964 30284 9465 -9602 21444 4730 30183 26144 1.15451 1.05674 1965 33336 9890 -10905 22383 4874 32324 27211 1.18789 1.02891 1966 35916 11233 -12376 23547 5085 34787 28576 1.21735 1.02480 1967 35830 12426 -13055 24022 5342 35241 29327 1.20166 0.98712 1968 37450 13925 -14404 24122 5522 37032 29620 1.25023 1.04041 1969 40333 15050 -16278 24696 5683 39193 30357 1.29109 1.03268 1970 40319 16447 -16005 24779 5885 40819 30658 1.33146 1.03127 1971 42695 17212 -17073 25303 6051 42905 31350 1.36860 1.02789 1972 45559 18694 -19554 26041 6213 44829 32250 1.39005 1.01568 1973 50360 20568 -22397 27562 6365 48744 33903 1.43778 1.03434 1974 54582 19655 -24652 28524 6581 49807 35078 1.41988 0.98755
21 From Table 10 in Appendix 2, we estimate that the price of agricultural land increased 18.6 fold and the
price of business nonagricultural land increased 48.5 fold over the period 1961-2006. For comparison purposes, the price of residential land increased 78.1 fold over this period.
1975 56328 18031 -23889 28504 6864 50461 35390 1.42587 1.00421 1976 60134 19422 -25376 28490 7135 54172 35684 1.51811 1.06469 1977 62599 20646 -25281 28777 7424 57928 36291 1.5962 1.05144 1978 63312 22694 -26058 29989 7720 60145 37801 1.59107 0.99678 1979 66440 23523 -27910 31726 7973 62173 39748 1.56417 0.98309 1980 65412 23748 -27013 32803 8298 62443 41167 1.51680 0.96972 1981 68222 24170 -27702 33691 8553 64904 42320 1.53366 1.01112 1982 59483 23789 -23204 32044 8898 61063 41076 1.48659 0.96931 1983 62511 25195 -25549 32267 8991 63109 41391 1.52471 1.02564 1984 66809 29833 -29968 33481 9112 67926 42676 1.59166 1.04391 1985 71421 31267 -32486 34856 9322 71420 44215 1.61527 1.01483 1986 74066 32607 -34820 36368 9558 73060 45924 1.59089 0.98491 1987 79016 33566 -36671 38149 9772 77093 47856 1.61094 1.01261 1988 84187 36570 -41604 39886 10039 80531 49810 1.61675 1.00360 1989 87664 36930 -44024 40932 10380 82017 51210 1.60160 0.99063 1990 84354 38654 -44876 40977 10741 79795 51655 1.54478 0.96452 1991 79923 39352 -45982 39695 10966 75197 50574 1.48688 0.96252 1992 78795 42175 -48154 39296 11115 74845 50286 1.48839 1.00102 1993 79844 46743 -51718 40147 11147 77048 51192 1.50509 1.01122 1994 84040 52672 -55933 41702 11204 83135 52781 1.57509 1.04651 1995 84708 57152 -59169 42913 11378 85308 54136 1.57580 1.00045 1996 89578 60353 -62199 44189 11595 90473 55590 1.62750 1.03281 1997 98340 65384 -71100 45611 11910 95853 57300 1.67284 1.02786 1998 99610 71347 -74731 47066 12417 99795 59295 1.68302 1.00608 1999 101508 78969 -80562 48740 12853 103931 61396 1.69278 1.00580 2000 108143 86010 -87116 50524 13226 111456 63512 1.75489 1.03669 2001 107390 83474 -82635 51230 13702 112218 64796 1.73186 0.98688 2002 111934 84475 -84039 52278 13977 116330 66115 1.75950 1.01596 2003 113963 82558 -87489 53274 14234 113423 67362 1.68377 0.95696 2004 122094 86537 -94812 55151 14407 118897 69287 1.71601 1.01915 2005 129046 88443 -101927 55936 14755 121683 70483 1.72642 1.00607 2006 135575 89077 -107002 56885 15215 124528 71989 1.72982 1.00197 Thus the level of business sector Total Factor Productivity using the net approach
increased 1.73 fold over the period 1961-2006 and the average rate of net TFP growth was 1.26 percent per year. Recall that using the gross approach, the level of business sector Total Factor Productivity increased 1.65 fold over the period 1961-2006 and the average rate of gross product TFP growth was 1.14 percent per year. Thus switching to the more appropriate net approach increases Canadian business sector TFP growth by about 0.12 percentage points per year, which is not large but it does represent a 10% increase in the average rate of TFP growth. For a more detailed breakdown of net TFP growth, see the last rows of Table 9 below, which is the net product counterpart to Table 4 above.
The net counterpart to Table 3 above is Table 8 below; ρt now represents the net real income generated by the Canadian business sector in year t.
Table 8: Net Real Income Generated by the Canadian Business Sector and Real Output and Input Prices
Year t ρt PDt/PCt PXt/PCt PMt/PCt PLt/PCt PKt/PCt 1961 23689 1.00000 1.00000 1.00000 1.00000 1.00000 1962 25768 0.99944 1.03522 1.04865 1.03226 1.12628 1963 27183 0.99800 1.02781 1.05363 1.04618 1.22818 1964 30102 1.00085 1.04560 1.05236 1.08417 1.44893 1965 32621 1.00582 1.05044 1.03608 1.14228 1.44712 1966 35188 1.00500 1.04074 1.01800 1.17099 1.49742 1967 35716 1.00560 1.02620 1.00092 1.20243 1.27878 1968 37484 1.00468 1.00773 0.98400 1.23152 1.40839 1969 39584 1.00535 0.99500 0.97927 1.28031 1.40169 1970 41450 1.00777 1.00122 0.97781 1.32069 1.48252 1971 43709 1.01998 0.98247 0.98102 1.38380 1.43702 1972 46216 1.02558 0.98132 0.96413 1.43872 1.40840 1973 52196 1.03772 1.04458 0.96217 1.47076 1.83165 1974 54577 1.04277 1.16108 1.02065 1.48574 1.85352 1975 54414 1.03067 1.15147 1.02155 1.48498 1.76081 1976 59948 1.03956 1.17684 1.00178 1.62921 1.89666 1977 62935 1.03646 1.20990 1.06509 1.66959 2.00576 1978 64123 1.03334 1.22672 1.11827 1.61371 2.03733 1979 67357 1.03367 1.31492 1.15554 1.57347 2.18705 1980 67663 1.03053 1.36621 1.19169 1.52933 2.10848 1981 68802 1.03658 1.34561 1.24317 1.55664 1.91251 1982 63460 1.02985 1.26180 1.19876 1.55562 1.52976 1983 65781 1.02536 1.19642 1.11391 1.50819 1.90369 1984 70391 1.02325 1.18752 1.11447 1.51687 2.15148 1985 73998 1.02509 1.17670 1.10835 1.54714 2.15318 1986 75334 1.02961 1.15086 1.10429 1.55228 1.97553 1987 81397 1.03650 1.14599 1.06266 1.56860 2.20597 1988 86302 1.03830 1.11949 1.01071 1.62836 2.12703 1989 88966 1.04004 1.11117 0.98227 1.65098 2.06061 1990 84559 1.02574 1.04334 0.94248 1.62120 1.68770 1991 78360 1.01564 0.95295 0.87672 1.59984 1.35461 1992 77328 1.01475 0.96722 0.90174 1.60838 1.27085 1993 79087 1.01430 0.99090 0.93229 1.57435 1.42485 1994 85765 1.02151 1.04312 0.98378 1.55547 1.86533 1995 90194 1.02354 1.10458 1.00791 1.57450 1.98881 1996 96299 1.01856 1.08863 0.97501 1.56171 2.35346 1997 101091 1.01117 1.07376 0.96418 1.58283 2.42622 1998 102186 1.00805 1.05617 0.98463 1.60678 2.13899 1999 107510 1.00751 1.04921 0.96342 1.62220 2.21304 2000 118854 1.00650 1.08579 0.95713 1.65982 2.64579 2001 117631 1.00294 1.06841 0.95916 1.65802 2.38580 2002 120115 1.00696 1.03562 0.95291 1.66081 2.38178 2003 120851 1.00554 0.99757 0.86983 1.64938 2.31713 2004 131065 1.01018 1.00552 0.83625 1.66695 2.71608
2005 138478 1.01836 1.01305 0.80973 1.70065 2.93800 2006 143589 1.02731 0.99703 0.78973 1.73700 2.94318
Note that from Table 8, the starting level of net real income in 1961, $23,689 million, is less than the corresponding starting level of gross real income in 1961 from Table 3, which was $27,683 million. This makes sense since we now subtract depreciation from the previous estimates of gross income. Net real income generated by the Canadian business sector grew 6.06 fold over the period 1961-2006, which is 2.4 percent greater than the 5.92 fold growth of gross real income. The real price of waiting capital services grew 2.94 fold, which is more rapid than the previous 1.78 fold increase in the real price of gross capital services from Table 3. This difference is due to the fact that depreciation gave the price of machinery and equipment (which decreases in real terms) a larger role in the price of gross capital services but when depreciation is regarded as an intermediate input, the price of land (which increases in real terms) gets a much bigger weight in the price of waiting capital services.
The same translog contributions methodology explained in Appendix 1 can be applied to the net output model used in the present section. Thus equation (3) in the previous section is applicable to our new measure of real income generated by the Canadian business sector and Table 9 below is the net income counterpart to Table 4 in the previous section.
Table 9: Business Sector Year to Year Growth in Net Real Income and Net Year to Year Contribution Factors
Year t ρt/ρt−1 τt αDt αXt αMt βLt βKt αXMt 1962 1.08774 1.05641 0.99942 1.01071 0.98384 1.03388 1.00213 0.99438 1963 1.05493 1.03418 0.99852 0.99777 0.99841 1.02103 1.00437 0.99619 1964 1.10737 1.05672 1.00290 1.00554 1.00040 1.03414 1.00443 1.00594 1965 1.08368 1.02891 1.00505 1.00150 1.00533 1.03390 1.00670 1.00684 1966 1.07871 1.02480 0.99916 0.99698 1.00622 1.04056 1.00921 1.00319 1967 1.01498 0.98714 1.00061 0.99517 1.00614 1.01600 1.01010 1.00128 1968 1.04952 1.04041 0.99907 0.99338 1.00636 1.00336 1.00662 0.99970 1969 1.05601 1.03268 1.00068 0.99523 1.00188 1.01886 1.00590 0.99710 1970 1.04714 1.03127 1.00241 1.00242 1.00058 1.00270 1.00720 1.00300 1971 1.05451 1.02789 1.01197 0.99261 0.99875 1.01676 1.00571 0.99137 1972 1.05736 1.01568 1.00551 0.99954 1.00689 1.02345 1.00515 1.00643 1973 1.12938 1.03426 1.01192 1.02558 1.00084 1.04608 1.00500 1.02644 1974 1.04562 0.98755 1.00497 1.04484 0.97455 1.02699 1.00748 1.01825 1975 0.99702 1.00421 0.98776 0.99668 0.99960 0.99945 1.00944 0.99628 1976 1.10171 1.06469 1.00910 1.00834 1.00856 0.99962 1.00870 1.01698 1977 1.04982 1.05144 0.99691 1.01084 0.97424 1.00774 1.00921 0.98480 1978 1.01887 0.99678 0.99691 1.00575 0.97873 1.03182 1.00949 0.98436 1979 1.05043 0.98309 1.00032 1.03150 0.98482 1.04301 1.00814 1.01584 1980 1.00454 0.96972 0.99694 1.01812 0.98540 1.02504 1.01041 1.00326 1981 1.01684 1.01113 1.00594 0.99279 0.97957 1.02030 1.00753 0.97251
1982 0.92235 0.96932 0.99353 0.97005 1.01722 0.96195 1.00898 0.98676 1983 1.03658 1.02551 0.99578 0.97553 1.03249 1.00531 1.00248 1.00722 1984 1.07008 1.04390 0.99800 0.99642 0.99977 1.02736 1.00360 0.99619 1985 1.05125 1.01483 1.00176 0.99543 1.00265 1.02960 1.00628 0.99807 1986 1.01805 0.98492 1.00441 0.98901 1.00183 1.03188 1.00655 0.99082 1987 1.08048 1.01260 1.00675 0.99794 1.01919 1.03613 1.00573 1.01709 1988 1.06026 1.00361 1.00175 0.98898 1.02450 1.03367 1.00693 1.01322 1989 1.03087 0.99063 1.00171 0.99652 1.01399 1.01977 1.00817 1.01046 1990 0.95046 0.96455 0.98592 0.97089 1.02060 1.00085 1.00781 0.99088 1991 0.92669 0.96255 0.98987 0.95763 1.03738 0.97496 1.00419 0.99342 1992 0.98683 1.00102 0.99909 1.00751 0.98498 0.99181 1.00252 0.99237 1993 1.02275 1.01121 0.99954 1.01355 0.98068 1.01746 1.00055 0.99397 1994 1.08443 1.04638 1.00719 1.03199 0.96693 1.03000 1.00113 0.99786 1995 1.05165 1.00045 1.00196 1.03912 0.98434 1.02178 1.00382 1.02285 1996 1.06768 1.03277 0.99536 0.99000 1.02165 1.02172 1.00505 1.01143 1997 1.04976 1.02786 0.99299 0.99058 1.00733 1.02291 1.00767 0.99784 1998 1.01083 1.00610 0.99697 0.98825 0.98543 1.02309 1.01145 0.97385 1999 1.05211 1.00580 0.99948 0.99502 1.01582 1.02612 1.00908 1.01077 2000 1.10551 1.03667 0.99906 1.02703 1.00468 1.02623 1.00803 1.03183 2001 0.98971 0.98688 0.99676 0.98762 0.99854 1.00996 1.01016 0.98618 2002 1.02112 1.01596 1.00371 0.97710 1.00439 1.01474 1.00553 0.98139 2003 1.00613 0.95696 0.99867 0.97396 1.06092 1.01377 1.00503 1.03329 2004 1.08451 1.01913 1.00436 1.00535 1.02460 1.02504 1.00346 1.03008 2005 1.05656 1.00607 1.00765 1.00491 1.01954 1.00986 1.00733 1.02454 2006 1.03690 1.00197 1.00844 0.98996 1.01492 1.01163 1.00963 1.00473 A62-06 1.0418 1.0126 1.0006 0.99968 1.0032 1.0185 1.0065 1.0027 A62-73 1.0684 1.0309 1.0031 1.0014 1.0013 1.0242 1.0060 1.0027 A74-91 1.0240 1.0023 0.99880 0.99707 1.0031 1.0153 1.0073 0.99980 A92-99 1.0408 1.0164 0.99907 1.0070 0.99340 1.0194 1.0052 1.0001 A00-06 1.0429 1.0034 0.0027 0.99513 1.0182 1.0159 1.0070 1.0131
The net real income generated by the Canadian business sector grew at an annual rate of 4.18 percent on average over the 46 year period 1961-2006, which is a bit more than the gross real income growth rate of 4.10 percent. Real domestic output prices averaged a tiny positive contribution to the growth in real net income of 0.06 per year and falling real export prices made a tiny negative contribution of −0.03 per year. Positive average contributions to the growth of real net income were due to productivity improvements (1.26 per year compared to 1.14 in the gross income framework), growth of labour input (1.85 per year compared to the previous gross income 1.60), growth of capital input (0.65 per year compared to the previous 1.11) and falls in real import prices (0.32 per year compared to the previous 0.28). Comparing these average contribution growth rates in the gross and net real income frameworks leads to the following important observations: