University of Arkansas, Fayetteville University of Arkansas, Fayetteville
ScholarWorks@UARK
ScholarWorks@UARK
Theses and Dissertations
8-2019
Estimating Demand Elasticities for Rice in Benin
Estimating Demand Elasticities for Rice in Benin
Ogoudele Simon CodjoUniversity of Arkansas, Fayetteville
Follow this and additional works at: https://scholarworks.uark.edu/etd
Part of the Agribusiness Commons, Agricultural Economics Commons, and the Food Security Commons
Recommended Citation Recommended Citation
Codjo, Ogoudele Simon, "Estimating Demand Elasticities for Rice in Benin" (2019). Theses and Dissertations. 3394.
https://scholarworks.uark.edu/etd/3394
This Thesis is brought to you for free and open access by ScholarWorks@UARK. It has been accepted for inclusion in Theses and Dissertations by an authorized administrator of ScholarWorks@UARK. For more information, please contact [email protected].
Estimating Demand Elasticities for Rice in Benin
A thesis submitted in partial fulfillment of the requirements for the degree of Master of Science in Agricultural Economics
by
Ogoudele Simon Codjo University of Parakou
Agricultural Economics Engineer Diploma, 2011
August 2019 University of Arkansas
This thesis is approved for recommendation to the Graduate Council.
_____________________________________ Alvaro Durand Morat, Ph.D.
Thesis Director
_____________________________________ _____________________________________ Lawton Lanier Nalley, Ph.D.
Committee Member Rodolfo N. Nayga, Jr., Ph.D. Committee Member _____________________________________ Eric J. Wailes, Ph.D. Committee Member
ABSTRACT
Rice consumption in Benin is increasing along with shifting consumer demand toward higher quality rice. In this context of changing demands, experimental estimation methods provide an effective way to estimate the current state of consumer preferences. We conducted a hypothetical choice experiment in 15 open markets in Benin to analyze the demand for rice and its substitutes. The results reveal that consumers value quality rice, even those in the low-income class. While high income consumers are more likely to choose high quality imported rice, low- and middle-income consumers are more likely to select high quality domestic rice among the set of rice available. In the high-income group, the demand for high quality imported and domestic rice is price inelastic. High quality domestic rice is almost as likely as high quality imported rice to be selected by urban consumers. In the rural area, consumers are highly responsive to rice price change. Whereas, the demand for rice in the urban area is price inelastic. Consumers are not responsive to corn price changes across the three income groups, although corn is the most likely commodity to be chosen by low- and middle-income consumers. The results suggest that any increase in rice prices could have an untoward effect on rice consumption in urban area.
ACKNOWLEDGEMENTS
I owe the success of this thesis to the contribution of many people and the support of the Fulbright program. I would like to say a special thanks to the William J. Fulbright scholarship program for this exceptional opportunity to study in the United States. I might never have
obtained the opportunity to study in the United States and have the chance to expand my cultural background without Fulbright scholarship.
I owe a special thanks to my supervisor, Dr. Alvaro Durand-Morat, for his support during my Master’s degree program. He ceaselessly invested efforts to comment on the drafts of my proposal and thesis. His pertinent and rigorous comments helped me improve my research work and my knowledge. By looking at the first draft and the final version of my thesis, I realized a huge gap and I owe this achievement to the guidance of Dr. Durand-Morat. I am also grateful to Dr. Lanier Nalley who was of a special support throughout my proposal development and my data analysis. His insightful advice was helpful to overcome many hurdles to this thesis.
I would like to thank the faculty members who taught me various classes or provided me with support to improve my knowledge during my stay at University of Arkansas. I would like to acknowledge Dr. Bruce Dixon, Dr. Eric Wailes, and Dr. Rodolfo Nayga. My thankfulness also goes to Dr. Daniel Rainey and Ms. Alicia Minden for their support about the different
administrative processes during my program. Also, I cannot forget the assistance that I received from Mr. Grant West and Mr. Wei Yang. Both of them devoted time to assist me in my research design and for the data analysis.
Finally, I am thankful for the support of my siblings, Victor, Elvire, Emma, Evariste, Eustache, Martine, Sabine, and Mathieu Codjo.
DEDICATION
To my father, Ogoudaré Samuel Codjo; to my mother, Salomé Bola Etienne; to my Spouse, Irene Ayaba Noudehou, and to my son, Ayomidé Nael Albert Codjo.
TABLE OF CONTENTS
1 INTRODUCTION ... 1
2 DATA AND METHODOLOGY ... 3
2.1 Source of data ... 3
2.2 Experimental design ... 5
2.3 Field experiment ... 8
2.4 Econometric model ... 8
2.5 Estimation of price elasticity of demand for rice ... 10
3 RESULTS ... 12
3.1 Characteristics of respondents by income group and by location ... 12
3.2 Results of the random parameter logit model by income group and by location... 15
3.3 Estimation of market shares by income group and by location ... 19
3.4 Estimation of direct and cross elasticities by income group and by location ... 20
3.5 Implied demand curves for rice by income group and by location ... 24
4 DISCUSSION AND CONCLUSION... 26
REFERENCES ... 30
LIST OF FIGURES
Figure 1: Geographical distribution of rice production in 2017 and selected urban and rural markets included in the survey based on Benin direction of agricultural statistics data. ... 4 Figure 2: Implied Demand Curves for Rice by Income Group and by Location ... 25
LIST OF TABLES
Table 1. Distribution of the Respondents Across the Fifteen Markets Surveyed in Benin ... 5 Table 2. Physical Quality Indicators of the Rice Used in the Choice Experiment ... 6 Table 3. Prices Used for the Choice Experiment Design (FCFA/kg) ... 7 Table 4. Socioeconomics Characteristics of Respondents by Income Group and by Location ... 14 Table 5. Estimates of Random Parameter Model per Income Group and by Location ... 17 Table 6. Estimated Market Shares (%) per Income Group and by Location ... 20 Table 7. Arc Price Elasticities by Income Group and by Location ... 22 Table 8: Percentage Change in the Demand of the Selected Staples Due to a 10% Increase in the Price of High Quality Imported Rice ... 28 Table 9 : Percentage Change in the Demand of the Selected Staples Due to a 10% Decrease in the Price of Domestic Rice ... 29
1 1 INTRODUCTION
In Benin, rice consumption is growing faster than that of any other food commodity. Between 1992 and 2002, per capita rice consumption increased by 25.25% and between 2003 and 2013, it surged to 150.42% (FAOSTAT, 2018). This rapid growth in total rice consumption is linked to urbanization, increasing incomes, and shifting urban consumer preferences that favor rice consumption (Fofana, Goundan, & Domgho, 2014; Demont & Neven, 2013). According to FAOSTAT (2018), rice is the main source of calories for consumers in Benin and contributed in 2013 approximately 21% of the daily caloric intake, followed by yam, corn, and cassava, which provide around 16%, 13%, and 12% of the daily caloric intake, respectively. Accordingly, rice plays a vital role in maintaining food security in Benin, and any shock that negatively affects rice price and availability might result in social instability (Seck et al, 2013), and worsen food
insecurity. In Benin, 9.6% of households are food insecure and 42% are at the edge of food security, meaning that they can become food insecure when severe shocks occur (WFP, 2017).
Despite the formidable growth in rice production in the last decade since the rice market crisis of 2007/08, domestic production supplies only a quarter of the national rice demand since 2014 (USDA, 2018). One of the major reasons for the dependence on imports is the low
investments in the domestic rice sector needed to increase production. West African countries endowed with ports, including Benin, find it more affordable to import rice instead of investing in the domestic rice sector (Rutsaert, Demont, &Verbeke, 2013; Aker et al, 2010; Bezemer & Headey, 2008). Such reliance on imports may jeopardize long run food security, making the domestic market vulnerable to global rice price volatility (Laroche, Dupraz & Postolle, 2013). A blatant example is the 2007 food crisis that exacerbated food insecurity in both rural and urban areas of developing countries (Demont & Neven, 2013). However, policies protecting domestic
2 production can negatively affect households’ welfare, primarily low-income households that use a large share of income on food, especially if prices rise as a result of the policies (Gyimah-Brempong & Kuku-Shittu, 2016). Price-related shocks could adversely affect Benin’s rural and urban consumers since they spend about 51% and 47 % of their income on food, respectively (WFP, 2014). Hence, policy makers need to have appropriate information to design sound and balanced rice policies to expand domestic production without compromising consumers’ welfare.
The design of suitable rice policies that ensures households’ food security and enhance their welfare requires a clear understanding of rice consumption patterns and the welfare implications of sectoral policies. According to Lusk and Tonsor (2016), new dimensions of demand might arise over time along with new information and economic conditions. The fast-growing rice consumption in Benin requires the understanding of the new dynamic of rice demand that can help in the formulation of more effective interventions. Moreover, the impact of changes in households’ purchasing power requires an understanding of the differences in
consumer preferences by income groups. (Leathers & Foster, 2004; Pinstrup-Andersen and Caicedo, 1978, Cuevas et al, 2016; Lusk and Tonsor, 2016). Elasticity estimates for population’s income profiles could aid policymakers in the formulation of better policies that account for the possible differences/sensibilities across income groups. Despite the rapidly changing and growing rice market, there are no recent studies on rice demand estimation in Benin.
One of the challenges of estimating a food demand system in Benin is the quality and availability of data. Systematic historical information on food prices and consumption in Benin are not available, but this shortcoming can be addressed using a consumer survey approach such as choice experiment (Lusk and Tonsor, 2016). In addition, aggregate disappearance data might not be perfectly correlated with actual consumption and may not exhibit much information on
3 preferences heterogeneity (Piggott and Marsh 2004; Tonsor, Mintert, and Schroeder 2010). According to Unnevehr et al (2010), new methods such as experimental survey have cropped up in recent years to improve the prediction of consumers’ preferences and choices. As a result, changes in consumers’ preferences can be identified and the effect of policies on consumers’ welfare predicted. The fast-growing Benin rice consumption and the rapidly changing consumers preference suggest that the use of demand estimation method, like experimental modelling, can be the most appropriate approach to assess consumer preferences. This study uses data from a hypothetical choice experiment to: (i) estimate the own and cross price elasticities of demand for staple foods in Benin; (ii) evaluate consumers substitution pattern between the different staples; and (iii) determine the variation of substitution pattern across income groups in Benin and between rural and urban area.
2 DATA AND METHODOLOGY 2.1 Source of data
A consumer survey was conducted in January 2019 in fifteen open markets, including seven urban markets, across the southern, central, and northern regions of Benin (Figure 1). In southern Benin, the surveys were mainly conducted in Cotonou, the main rice consumption area. In the central Benin, the Collines department, the second largest rice production area in the country, was selected. The northern areas selected for this study encompasses some minor rice production zones, such as Barienou and Kolokondé. A total of three hundred and three (303) consumers were interviewed. Table 1 presents the distribution of the respondents in the sample.
4 Figure 1: Geographical distribution of rice production in 2017 and selected urban and rural markets included in the survey based on Benin direction of agricultural statistics data.
5 Table 1. Distribution of the Respondents Across the Fifteen Markets Surveyed in Benin
Region Total Location Market names
Number of respondents Total Southern 107 Urban Dantokpa 40 107 Gbegamey 37 Cococodji 30 Central 104 Urban Savalou 24 50 Dassa 26 Rural Gobé 25 54 Kpataba 11 Gouka 18 Northern 92 Urban
Grand marché Djougou 21
27 Petit marché Djougou 06
Rural Paparapanga 16 65 Kolokonde 13 Barienou 12 Copargo 14 Partago 10 Total 303 303 303 2.2 Experimental design
This study uses a hypothetical choice experiment to gather data on consumer preferences for the selected staple foods, including rice and its substitutes. Respondents were presented with nine choice sets and were asked to select one option from each choice set. Each choice set has seven
6 alternatives: high quality imported rice, high quality domestic rice, standard quality domestic rice, yam, corn, cassava, and a “no purchase” alternative. Following Demont, Fiamohe, and Kinkpe (2017), we considered the variety Nerica 2, IR841, and Gino rice as the standard quality rice, high-quality domestic rice, and high-high-quality imported rice, respectively. The variety IR841 is processed using modern milling technology. However, the variety Nerica is processed using the traditional milling equipment. Gino is the most popular imported rice brand in urban areas and is notorious for its high quality (Demont, Fiamohe, and Kinkpe, 2017). The samples of the rice used in this study underwent physical analysis in the rice lab of Food Science Department of University of Arkansas. The lab analysis of the physical attributes of Nerica 2, IR841, and Gino rice are presented in table 2. Based on International Rice Research Institute (IRRI) grain classification system, the rice considered are all long grain rice However, the high-quality imported rice is classified as slender and both qualities domestic rice are of intermediate shape. In addition, imported rice displays less chalk and broken rate than the high and standard quality domestic rice.
Table 2. Physical Quality Indicators of the Rice Used in the Choice Experiment Rice Length1 (mm) Width (mm) Shape2 (Length/width) Chalk impact Broken rate (%)
High quality imported (Gino) 6.72 2.14 3.14 0.6 1.6
High quality domestic (IR841) 6.79 2.38 2.85 5.12 7.4
Standard domestic (NERICA2) 6.04 2.39 2.53 19.63 17.7
1 Rice grain length classification based on IRRI classification system: short (< 5.50 mm), medium/intermediate (5.51–6.60 mm), long (6.61–7.50 mm), and very long (> 7.50 mm). 2 Rice grain shape classification based on IRRI classification system: bold (< 2.0), medium (2.1–3.0), and slender (> 3.0)
Each choice set displays the same alternatives, but different prices levels. The substitutes and the no-buy alternative are purposely included in the choice experiment to allow rice
7 consumers to shift out of rice into other food alternatives or a no buy alternative as part of their choice, thus reflecting real market experiences more accurately (Lusk and Tonsor, 2016).Three levels of prices were considered for each product (low, mid, and high price). The mid-price is the average market price of the product published by the National Institute of Statistic and Economic Analysis from November 12 to November 18 (INSAE, 2018). For some products, such as
standard quality rice, which are not included in the market aforementioned report, we estimated the market price from a survey of 3 open markets conducted in Cotonou in, in Glazoué, and Djougou in November of 2018. The December market prices of the products were not used because of the possible distortion in price due to the Christmas and new year celebration. To obtain the low and high price of each product, 200 CFA francs (FCFA) were subtracted from and added to the mid-price. Table 3 presents the details of the price levels of the products used for the choice experiment.
Table 3. Prices Used for the Choice Experiment Design (FCFA/kg)
Products Low Mid High
High quality imported rice 900 1100 1300
High quality domestic rice 300 500 700
Standard quality domestic rice 150 350 550
Corn 50 200 400
Cassava 75 250 450
Yam 100 300 500
Average exchange rate December 2018 = 576 FCFA/US$
An orthogonal factorial experimental design was used to develop 27 choice tasks. Three blocks of nine choices were constructed using the 27 choice tasks, and each respondent was randomly
8 assigned to one block. Throughout the survey, the order of the alternatives was randomly varied across respondents.
2.3 Field experiment
To ensure that the survey accurately reflected market experiences, we conducted face-to-face surveys in market stands selling staples in the selected open markets. We compensated stand owners for shelf space to display the six staple foods considered in this study. We standardized the presentation of the products (e.g., the containers used to hold the staples were of the same color and size) to make the experiment condition homogenous. We randomly selected consumers that came to the market to buy staples, but before they completed the purchase. The invitation consisted of explaining the objective of the study to the respondent and the benefit of
participating in the experiment. Participants received 1,500 FCFA (US$3) as compensation for their time. Each participant was randomly assigned a choice task block and responded nine choice sets question. Respondents were allowed to visually inspect the six staple foods, but were not told about the quality indicators of the different kind of rice considered in this study.
Respondents completed a socioeconomic questionnaire before conducting the choice experiment.
2.4 Econometric model
Random utility maximization (RUM) model is used as guidelines for the choice data analysis (McFadden 1973). The RUM model presumes that agent utility is composed of a deterministic component and a stochastic unobserved error component. Given this framework, the utility Uij that a decision maker i derives from consuming alternative j may be portioned into a deterministic and observed component, Vij, and a stochastic and unobserved component, εij , such that:
9
𝑈𝑖𝑗 = 𝑉𝑖𝑗 + 𝜀𝑖𝑗 (1) The choice of the model of estimation of 𝑈𝑖𝑗 depends on assumptions about the
distribution of the unmodeled component, 𝜀𝑖𝑗 . Assuming that the 𝜀𝑖𝑗 follow a type 1 extreme value distribution and are independently and identically distributed (IID) across i and j, then the conventional multinomial logit model (MNL) can be used to model the choice probability associated with alternative j. Equation 2 presents the choice probability of alternative j:
𝑃𝑟𝑜𝑏(𝑖 𝑐ℎ𝑜𝑜𝑠𝑒 𝑗) = 𝑒
𝑉𝑖𝑗
∑7 𝑒𝑉𝑖𝑘 𝑘=1
(2)
The observed component, 𝑉𝑖𝑗 , is assumed to be linear in parameters such that:
𝑉𝑖𝑗 = 𝛽𝑗𝑥𝑖𝑗 (3)
Where 𝑥𝑖𝑗 is a vector of observed variables describing alternative j, and 𝛽𝑗 are the
coefficients associated with these variables. The MNL exhibits two main limitations in its use for elasticities computation (Luck and Tensor, 2016). First, all cross-price elasticities for an
alternative are identical because of the independence of the irrelevant alternative (IIA) property of the MNL. Second, the deterministic component of the utility function, Vij, assumes that the marginal utility of a price change is constant and identical for all alternatives. A less restrictive utility function can be obtained by modifying the functional form of Vij as follows:
𝑉𝑖𝑗 = 𝛽𝑗+ 𝛼𝑃𝑗 (4) Where 𝑃𝑗 is the price of alternative j, 𝛼 is the marginal utility of price change, and 𝛽𝑗 is the alternative specific constant associated with alternative j. Although equation 4 is less
restrictive, the IIA assumption of the MNL still prevails. One option to relax the IIA assumption is to use a random parameter logit (RPL) which assumes that preferences may vary across
10 respondents (Henser, Rose, and Greene, 2015). Moreover, the RPL model can approximate any RUM model (McFadden and Train, 2000). It allows for the variation of random taste,
substitution patterns without restriction, and unobserved factors correlation (Train, 2009). In this study, we adopted the following functional form of the observed utility function:
𝑉𝑖𝑗 = 𝛽𝑗 + ∑ 𝜔𝑗𝑡𝑑𝑖𝑡 6
𝑡=1
+ 𝛼𝑗𝑃𝑗 (5)
Where, as before, 𝛽𝑗 represents the alternative specific constant associated with
alternative j, 𝑃𝑗 is the price of alternative j, and 𝛼𝑗 the marginal utility of price change associated with alternative j. The terms 𝑑𝑖𝑡~𝑁(0,1) and 𝜔𝑗𝑡 are the elements of the lower triangular
Cholesky matrix associated with the covariance matrix of the random parameters.
2.5 Estimation of price elasticity of demand for rice
This study focusses on both the own and the cross-price demand elasticities. In this econometric framework, the own-price demand elasticity is assessed as the percentage change in the likelihood of selecting alternative j in the choice set with respect to the percentage change in
the price of j. Similarly, cross-price elasticities are estimated as the percentage change in the
likelihood of selecting alternative j in the choice set with respect to the percentage change in the
price of alternative k (Louvier et al, 2000). To estimate these elasticities, we first estimated the
market share as the probability of purchase for individual i and food option j at different price levels. Second, the demand curve is constructed using the market share as a function of price. Finally, the elasticity or percentage change in the market share of good j that results from a 1%
11 i) Estimation of market share
The market shares are estimated by plugging the observable component of utility, 𝑉̂𝑖𝑗, in the probability equation (2):
𝑆𝑖𝑗|𝑑𝑖 =
𝑒𝑉̂𝑖𝑗
∑7 𝑒𝑉̂𝑖𝑘 𝑘=1
(6)
Where Sij is the market share or probability of purchase for individual i and food option j, and 𝑑𝑖 is a vector containing the terms 𝑑𝑖𝑡. Equation 6 cannot be directly evaluated because it contains the random terms 𝑑𝑖𝑡~𝑁(0,1), and simulation must be used to approximate the mean share. For a set of 𝑁 draws from 𝑑𝑖𝑡~𝑁(0,1), the unconditional market share for food option j,
𝑆𝑗, can be approximated as follows:
𝑆𝑗 = 1 𝑁∑ 𝑒𝑉𝑖𝑗̂ ∑7𝑘=1𝑒𝑉𝑖𝑘̂ 𝑁 𝑡=1 (7)
ii) Construction of demand curve
The demand curve for good j is constructed by evaluating equation (7) at different good
j’s prices holding the price of other goods at their mean value. For instance, we build the demand
curve for standard quality rice by evaluating its market share at 150, 250, 350, 450, and 550 FCFA kg-1, keeping the price of high quality imported rice, high quality domestic rice, yam, cassava, and corn at 1100, 500, 350, 300, 250, 200 FCFA. The prices considered for each staple food should vary within the price range used in the experimental design. The implied demand curve for each staple food is constructed by plotting the prices and associated market shares.
12 iii) Estimation of elasticities or change in market share
The final value of the elasticity, defined as the percentage change in the share of good 𝑗
that results from a 1% increase in the price of good 𝑘 is calculated as:
𝑒𝑗𝑘 = 𝑆𝑗′−𝑆̅𝑗
𝑆̅𝑗 1
0.1 (8)
Where 𝑒𝑗𝑘 the arc elasticity of demand for good 𝑗, or percentage change in the share of good 𝑗 that results from a 1% increase in the price of good 𝑘, 𝑆̅𝑗 is the market share of good 𝑗 evaluated at the midpoint price level, and 𝑆𝑗′ is the new market share of good 𝑗 resulting from a 10% increase in the price of good 𝑘.
3 RESULTS
3.1 Characteristics of respondents by income group and by location
Table 4 presents the socio-economic characteristics of the respondents by income group. We grouped respondents into low, middle, and high-income groups following the distribution presented in the report of the Benin global analysis of vulnerability and food security (WFP, 2014). The categorization per income group in this study suggests that 45%, 39%, and 16% of the respondents are in the low, middle, and high-income groups, respectively. Thus, our sample resembles the national distribution reported by AGSVA (2014), by which 40%, 40%, and 20% of households are in the low, middle, and high-income categories. A Kruskal-Wallis test revealed that there is a significant (P<0.01) difference in the rice purchase price, per capita rice
consumption, and household size across income groups. The average purchase price of rice increases from the low to the high-income class: high-income consumers pay 41.2% and 35.7% more than low and middle-income households. The average annual per capita consumption of rice is estimated at 29 kg, which is less than the 42 Kg per capita per year estimated by Fiamohe
13 and Kinkpe (2016). High income respondents consume more rice than low- and middle-income consumers. The average household size is 4.98, 6.00, and 6.02 for low, middle, and high-income consumers, respectively. The average respondents’ household size is 5.55, which is close to the national average of 5.85 (RGPH, 2013). Twenty eight percent of the respondents did not have any formal education. The high-income class presents the highest proportions of university level respondents, while the low-income respondents had the highest proportion of illiterate.
A Wilcoxon test revealed that there is a significant (P<0.01) difference between the rice purchase price, per capita rice consumption, and the size of rural and urban households. Rice is much cheaper in rural areas, which may be explained by the fact that cheaper domestic rice may be more popular in rural areas than in urban areas. Rural households display a larger size, which reflects the national profile of households distribution. The national average households’ size is estimated at 5.01 and 6.08 for urban and rural areas, respectively. Likewise, urban area
households consume more rice than rural area households. This may be explained by
urbanization that stimulates the consumption of foods, such as rice, that are easier to cook and need less preparation time. With urbanization, the opportunity cost of women’s time increases since they have a greater chance to work outside home. Furthermore, many people have their lunch outside home and rice is a convenient food. Lastly, urban households are more literate than their rural counterpart.
14 Table 4. Socioeconomics Characteristics of Respondents by Income Group and by Location
Income Group Location
Pooled Low Income1 Middle Income2 High Income3 Rural Area Urban Area Rice price (FCFA/kg) 525
(236.07) 484.9 (214.9) 504.9 (205.5) 684.9 (289.6) 433.78 (154.35) 584.13 (260) Rice consumption (kg/capita) 28.95 (17.55) 29.09 (19.73) 27.87 (14.25) 31.21 (18.23) 25.38 (14.03) 31.27 (19.14) Household size 5.55 (2.49) 4.98 (2.14) 6.00 (2.51) 6.02 (2.94) 6.1 (2.7) 5.19 (2.27) Formal education (%) Yes 72.27 62.23 73.95 95.92 62.19 78.80 No 27.72 37.77 26.05 4.08 37.81 21.19 Marital status (%) Yes 74.25 67.41 81.51 75.51 77.31 72.28 No 25.75 32.59 18.49 24.49 22.69 27.77 Number of respondents 303 135 119 49 119 184
Standard deviation in parenthesis; MI=Monthly income in FCFA; Average exchange rate December 2018 = 576 FCFA/US$
1. Monthly income ≤ 100,000. 2. 100,000 < monthly income ≤ 200,000. 3. Monthly income > 200,000.
15 3.2 Results of the random parameter logit model by income group and by location
Since the RPL model yielded a better fit than the MNL model for all the specifications used in this study, and given the advantages of RPL over MNL discussed above, we focus the discussion on the RPL model estimates. The Bayesian information criterion (BIC), Akaike information criterion (AIC), and likelihood ratio (LR) test suggest that the RPL model with a correlated alternative specific constant yields better results than the uncorrelated RPL model.
The sum of the log likelihood values of the three income group models is compared to the pooled model log likelihood function value to see if the model parameters are the same across income groups (Lusk and Tonsor, 2016). The comparison yields a chi-squared value of 224.36 with 78 degrees of freedom and an associated p-value less than .001. Accordingly, preferences are different across income groups since the hypothesis that the model parameters are identical across income categories is rejected.
Table 5 presents the results of the correlated RPL model for the pooled data set and for the three income groups. The results indicate that all the parameters depict the expected signs and are statistically significant (P<0.01). In the pooled model, the high-quality domestic rice presents a coefficient of 8.089, which is the highest among the three types of rice. This coefficient indicates that the average consumer receives 8.089 more utility from high quality domestic rice than from the no buying option. High quality domestic rice provides 4.484 (8.089-3.605) more utility than high quality imported rice. We identify important differences in the utility derived from the different types of rice by household income levels. High-quality domestic rice shows the highest utility among the three types of rice for both low- and middle-income households, while high-quality imported rice provides the highest utility to the average high-income consumer. Low-income consumers derive no utility (coefficient statistically not
16 different from zero) from high-quality imported rice. For staples other than rice, the average consumer across all income levels derives the highest utility from corn and lowest from cassava.
The price coefficients in Table 4 report the marginal utility of price change. For example, the coefficient of -0.008 for high quality domestic rice in the pooled model indicates that an increase of FCFA 100 in the price of high-quality domestic rice will decrease utility by 0.8. For all staples (including the three types of rice) and income groups, the marginal utility is negative and significantly different from zero. We use the variance and the covariance of the alternative specific constant to assess heterogeneity across consumers. For example, the standard deviation for high quality domestic rice in the pooled sample is 2.5 and significantly different from zero, which means that we should expect that 68% of the consumers in that income group derive a utility from high quality domestic rice of between 5.59 and 10.59 (8.089 ± 2.5). Appendix Table 2 shows the correlation matrix for random parameters implied by the variance-covariance matrix.
Similarly to the case of income categories, we test the null hypothesis that the models are the same across locations (rural and urban). The likelihood test yields a chi-squared of 217.52 with 78 degrees of freedom and an associated p-value less than .001, which leads to the rejection of the null hypothesis. The results of the correlated RPL model for rural and urban area show that all the parameters have the expected signs and are statistically significant, except for the
marginal utility of price for cassava, which is not statistically different from zero. High quality domestic rice gives the highest utility to rural and urban households among the rice alternatives. Concerning the food commodities other than rice, corn provides the highest utility for consumers in both locations. The significance of the variance of the alternative specific constants for all rice alternatives highlights the heterogeneity in preferences among rural and urban households.
17 Table 5. Estimates of Random Parameter Model per Income Group and by Location
Income Group Location
Pooled Low Income1 Middle Income2 High Income3 Rural Area Urban Area Alternative Specific Constants
HQIR4 3.605** (1.293) -6.238 (3.799) 7.309 *** (1.902) 7.117*** (2.001) 0.84 (3.63) 10.09 *** (1.47) HQDR5 8.089*** (0.58) 6.383*** (0.669) 9.466 *** (0.865) 3.103** (1.1) 9.2 *** (0.82) 10.59 *** (1.78) SQDR6 7.73*** (0.562) 6.075*** (0.661) 7.674 *** (0.752) 4.9*** (0.919) 8.47 *** (0.68) 9.71 *** (1.67) Yam 8.468*** (0.582) 6.22*** (0.604) 8.438 *** (0.732) 5.856*** (0.829) 9.27 *** (0.7) 10.56 *** (1.45) Cassava 7.391*** (0.585) 5.983*** (0.654) 6.168 *** (0.762) 5.186*** (1.42) 11.37 (22.79) 9.49 *** (1.58) Corn 8.816*** (0.582) 6.639*** (0.609) 8.805 *** (0.738) 6.302*** (0.856) 9.35 *** (0.7) 10.88 *** (1.54) Price Effects HQIR -0.006*** (0.001) -0.007*** (0.002) -0.008 *** (0.002) -0.005** (0.002) -0.007 ** (0) -0.006 *** (0) HQDR -0.008*** (0.001) -0.007*** (0.001) -0.013 *** (0.001) -0.006*** (0.002) -0.014 *** (0) -0.006 *** (0) LQDR -0.011*** (0.001) -0.01*** (0.001) -0.015 *** (0.001) -0.014*** (0.002) -0.018 *** (0) -0.009 *** (0) Yam -0.013*** (0.001) -0.014*** (0.001) -0.016 *** (0.001) -0.011*** (0.001) -0.021 *** (0) -0.011 *** (0)
18 Table 5. (Continued).
Income Group Location
Pooled Low Income1 Middle Income2 High Income3 Rural Area Urban Area Price Effects Cassava -0.026*** (0.002) -0.026*** (0.004) -0.024 *** (0.004) -0.035*** (0.008) -0.087 (0.3) -0.02 *** (0) Corn -0.017*** (0.001) -0.016*** (0.001) -0.021 *** (0.001) -0.019*** (0.002) -0.025 *** (0) -0.014 *** (0) Standard deviation of alternative specific constants
HQIR 8.31 *** (0.82) 14.55 *** (2.72) 4.97 *** (0.91) 5.78** (2.01) 6.74 *** (0.9) 10.17 *** (1.79) HQDR 2.5 *** (0.36) 1.89 *** (0.53) 2.53 *** (0.6) 3.33 (1.7) 2.19 *** (0.51) 4.55 *** (1.24) LQDR 3 *** (0.31) 2.12 *** (0.5) 3.14 *** (0.41) 3.82* (1.66) 1.49 ** (0.49) 5.05 *** (1.07) Yam 3.68 *** (0.32) 2.85 *** (0.47) 3.03 *** (0.4) 2.85* (1.25) 2.81 *** (0.45) 5.83 *** (0.94) Cassava 2.86 *** (0.37) 1.84 *** (0.37) 2.51 *** (0.46) 4.76** (1.6) 2.16 *** (0.41) 4.81 *** (0.97) Corn 3.88 *** (0.35) 2.57 *** (0.57) 4.05 *** (0.44) 2.65 (1.44) 2.99 *** (0.41) 5.99 *** (1.07) N 303 135 119 49 119 184 Log Likelihood -2563.1 -1161.6 -911.69 -377.67 -806.54 -1647.8
Standard errors in parenthesis; ‘***’,’**’, ‘*’, significance at 1, 5, and 10%.
1. Monthly income ≤ 100,000. 2. 100,000 < monthly income ≤ 200,000. 3. Monthly income > 200,000.
19 3.3 Estimation of market shares by income group and by location
The comparison of parameters across income classes may be inappropriate since it may be confounded by the discrepancy between variances (Lusk and Tonsor, 2016). However, the market shares, which indicate the probability of purchasing a product, can be compared across income groups. Table 6 presents the distribution of market shares across income groups and location. High income class consumers are almost 3 and 5 times more likely to choose high quality imported rice than low- and middle-income classes consumers. High quality domestic rice is more likely to be selected by both low- and middle-income households than high quality imported rice and standard quality domestic rice. Corn has the largest market share among the low- and middle-income classes, and high-quality imported rice has the largest share among high-income households. Among all the products, cassava is less likely to be chosen across all income groups.
Urban households are 50% more likely to choose rice than rural household. Actually, rice accounts for 51% of the market share of urban consumers versus 34% for rural consumers. The market share of high-quality imported rice among rural households is very small, while it is the largest for urban households. Urban households have a similar market share for the three rice alternatives. Corn has the largest market share among all the food products in both rural and urban area. The probability of no purchase is small across income groups and urban and rural households.
20 Table 6. Estimated Market Shares (%) per Income Group and by Location
Products Pooled
Income group Location
Low Income 1 Middle Income 2 High Income3 Rural Urban HQIR4 11.39 9.32 6.05 30.05 4.32 18.46 HQDR5 18.41 23.00 16.52 10.33 16.45 17.35 SQDR6 17.86 21.63 16.19 11.56 13.68 15.76 Yam 23.75 19.27 27.38 27.33 30.39 21.12 Cassava 1.84 1.04 2.29 2.97 0.01 5.73 Corn 25.80 24.76 31.02 15.99 34.04 21.58 No purchase 0.93 0.97 0.55 1.77 1.13 0.01
1. Monthly income ≤ 100,000. 2. 100,000 < monthly income ≤ 200,000. 3. Monthly income > 200,000.
4. High quality imported rice. 5. High quality domestic rice. 6. Standard quality domestic rice.
3.4 Estimation of direct and cross elasticities by income group and by location
Table 7 presents the own and cross-price elasticities of demand by income group and by location. Overall, the demand for all rice alternatives is elastic across income groups, except for high quality imported and domestic rice for high-income consumers. A 10% decrease in the price of standard quality domestic rice will result in a 4.1% decrease in the high-quality domestic rice consumption among low-income consumers. Similarly, the demand for high quality domestic rice by middle income consumers is expected to decrease by 4.4% as a result of 10% decrease in high quality imported rice price. Hence, high-quality domestic rice is the most preferred rice by low- and middle-income consumers. Looking at high-income consumers, a 10% increase in the price of high-quality imported rice will result in 9.6%, 0.4%, and 0.5% decrease in the
21 consumption of high-quality imported rice, high quality domestic rice, and standard quality domestic rice respectively. Rural consumers are highly responsive to food price changes. A 10% decrease in the price of standard quality domestic rice will result in the 9.6% reduction in the consumption of high-quality domestic rice in the rural areas. However, a 10% fall in the price of standard quality domestic rice will lead to only 1.3% decrease in the consumption of high-quality domestic rice consumption in urban area. Among urban households, the demand for all rice alternatives is inelastic. Accordingly, rice is more a staple food in urban area than in rural area.
Looking at the products other than rice, corn demand is inelastic across income groups and locations. Interestingly, corn is a closer substitute for domestic high-quality rice among low and middle-income households: the cross-price elasticity of corn for high quality domestic rice, the most preferred rice alternative among low and middle-income households, is the largest among all staples. A 10% increase in price of rice regardless the quality, will result in a 3% to 3.8% increase in corn consumption for low income consumers, 4.6% to 10.6% among middle income consumers, and 1.4% to 4.1% among high-income consumers. The demand for yam is elastic for low- and middle-income consumers but inelastic for high-income respondents.
However, the demand for cassava is elastic across the income groups. Standard quality domestic rice presents the largest cross price elasticity of cassava demand among low- and middle-income consumers. Thus, these consumers will substitute more standard quality domestic rice to cassava than the other commodities.
22 Table 7. Arc Price Elasticities by Income Group and by Location
% Change in quantity
% Change in price HQIR HQDR SQDR Yam Cassava Corn
Low Income1 HQIR4 -1.08 -0.03 -0.03 -0.43 -0.08 0.3 HQDR5 0.1 -1.48 0.38 0.24 0.15 0.38 SQDR6 0.06 0.41 -1.89 0.39 0.12 0.34 Yam 0.07 0.49 0.55 -2.48 -0.09 0.44 Cassava 0.13 0.52 0.68 0.84 -4.67 0.39 Corn 0.16 0.6 0.46 0.48 0.01 -0.82 No purchase 0.41 0.61 0.47 0.7 -0.06 0.54 Middle Income2 HQIR -2.69 0.44 -0.07 0.26 -0.38 1.06 HQDR 0.16 -2.28 0.47 0.64 0.2 0.74 SQDR 0.08 0.51 -1.79 0.24 0.18 0.46 Yam 0.24 0.25 0.45 -1.46 0.25 0.3 Cassava 0.29 0.41 0.96 0.32 -3.1 0.18 Corn 0.12 0.39 0.13 0.5 -0.01 -0.8 No purchase 0.24 1.27 0.88 1.2 0.35 0.51 High Income3 HQIR -0.91 -0.04 -0.05 0.19 0.07 0.19 HQDR 0.63 -0.94 0.04 0.53 0.23 0.23 SQDR 0.17 0.15 -1.67 0.42 0.29 0.58 Yam 0.48 0.3 0.33 -0.95 0.25 0.27 Cassava -0.04 0.07 -0.23 0.43 -3.15 0.16
23 Table 7. (Continued).
Change in quantity
Change in price HQIR HQDR SQDR Yam Cassava Corn
High Income3 Corn 0.27 0.01 0.48 0.28 -0.07 -1.02 No purchase 0.32 0.37 0.32 0.85 0.55 0.86 Rural area HQIR -2.09 -0.08 0.45 0.79 0.21 0 HQDR -0.04 -2.96 0.69 0.99 -0.15 0.81 SQDR -0.02 0.93 -2.97 0.97 0.19 1.01 Yam 0.27 0.42 0.34 -1.8 -0.02 0.85 Cassava -2.18 -0.8 4.92 -1.72 -9.55 1.18 Corn 0.04 0.37 0.21 0.39 -0.01 -0.94 No purchase -0.04 1.18 1.64 1.43 0.16 0.99 Urban area HQIR -0.96 0.2 -0.09 0.05 0.17 0.14 HQDR 0.06 -0.66 0.17 0.37 0.24 0.41 SQDR 0.46 0.13 -0.85 0.41 0.04 0.16 Yam 0.15 0.17 0.3 -0.83 -0.02 0.1 Cassava 0.58 0.25 0.18 0.2 -1.44 0.1 Corn 0.1 0.02 0.18 0.1 0.09 -0.59 No purchase 3.46 2.03 2.06 5.32 2.21 1.24
1. Monthly income ≤ 100,000. 2. 100,000 < monthly income ≤ 200,000. 3. Monthly income > 200,000.
4. High quality imported rice. 5. High quality domestic rice. 6. Standard quality domestic rice.
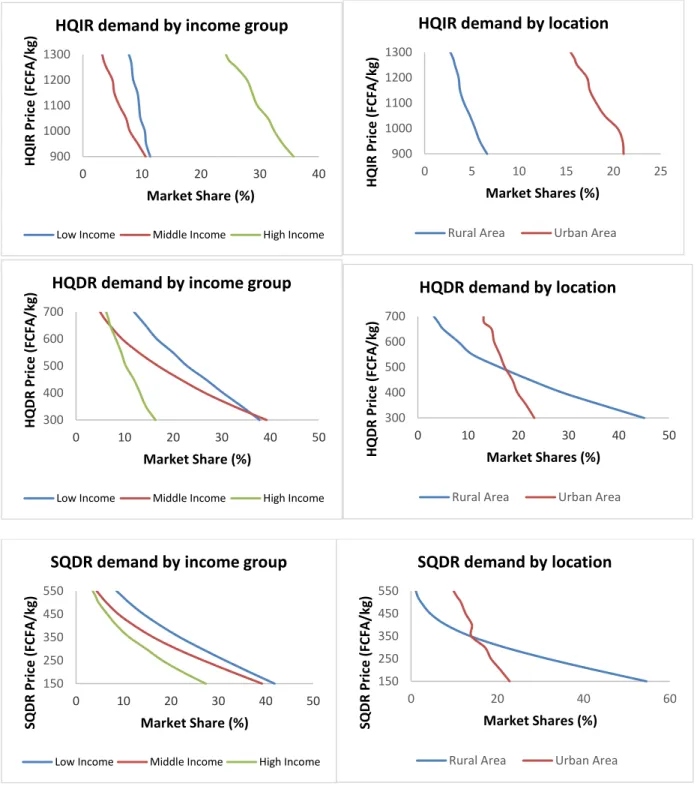
24 3.5 Implied demand curves for rice by income group and by location
The rice demand curves by income class and location are constructed using the market shares in the range of the prices used for the experimental design (Figure 2). All the demand curves depict a downward slope as expected according to the law of demand. The demand curves of the high-quality imported rice (HQIR) reveal that there is a gap between the demand of this rice at the lowest price (900 FCFA) across income groups and between rural and urban area. The likelihood of purchasing HQIR at the 900 FCFA is exceedingly higher for high income and urban area consumers. At the highest price of HQIR, the probability of choosing this rice is still substantially higher for high income and urban consumers than the probability of selecting this rice by rural and low-income consumers at the lowest price. Accordingly, HQIR may be more consumed in the urban areas and by high-income consumers even at the higher prices.
The demand for high quality domestic rice (HQDR) at its lowest price is higher for low- and middle-income consumers than that of high-income consumers. Similarly, the likelihood of choosing this rice in rural area is higher than in urban area at its lowest price. However, as the HQDR price increases, rural, low, and middle-income consumers’ demand fall quickly, which is not the case for high-income consumers. Accordingly, the demand for HQDR is elastic in rural area and for low- and middle-income consumers as suggested by the elasticities estimates (Table 8). At the highest price of HQDR, the likelihood of choosing this rice by low-income consumers is higher than that of middle- and high-income consumers. This shows that consumers, even those of low-income profile, are aware of rice quality.
The demand for standard quality domestic rice (SQDR), is elastic across income groups and for rural consumers. In opposite, urban consumers have an inelastic demand for SQDR as shown by the shape of its demand curve. At the highest price of SQDR, low-income consumers
25 depict the biggest demand for standard quality rice. Accordingly, low-income households may consume more standard domestic quality rice.
Figure 2: Implied Demand Curves for Rice by Income Group and by Location 900 1000 1100 1200 1300 0 10 20 30 40 H QIR Pr ic e ( FCFA /kg) Market Share (%) HQIR demand by income group
Low Income Middle Income High Income
900 1000 1100 1200 1300 0 5 10 15 20 25 H QIR Pr ic e ( FCFA /kg) Market Shares (%) HQIR demand by location
Rural Area Urban Area
300 400 500 600 700 0 10 20 30 40 50 H QDR Pr ic e ( FCFA /kg) Market Share (%) HQDR demand by income group
Low Income Middle Income High Income
300 400 500 600 700 0 10 20 30 40 50 H QDR Pr ic e ( FCFA /kg) Market Shares (%) HQDR demand by location
Rural Area Urban Area
150 250 350 450 550 0 10 20 30 40 50 SQDR Pr ic e ( FCFA /kg) Market Share (%) SQDR demand by income group
Low Income Middle Income High Income
150 250 350 450 550 0 20 40 60 SQDR Pr ic e ( FCFA /kg) Market Shares (%) SQDR demand by location
26 4 DISCUSSION AND CONCLUSION
Rice represents a significant food commodity in households’ consumption in Benin and the understanding of its demand pattern is pivotal to design appropriate food policies. One of the main limitations in Benin is the lack of information to conduct a rigorous food demand analysis. To our knowledge, Benin has not conducted a household income and expenditure survey in the last decade, a time when food consumption, especially rice, changed significantly. We collected primary information via a consumer survey and used experimental methods to model the demand for rice in Benin. The results revealed several interesting and novel demand patterns. First, regardless of income level, consumers value/prefer high quality rice. This result is congruent with previous studies that suggest that rice consumers, even those of low-income class, are increasingly becoming aware of food quality (Rutsaert, Demont, & Verbeke, 2013; Demont, Fiamohe, & Kinkpe, 2017). Second, consumers in general are more sensitive to changes in rice prices than what the scarce existing literature suggests. To illustrate, Seale, Regmi, and Berstein (2003) estimated an unconditional own price elasticity of demand for bread and cereals,
including rice, at -0.459, which is significantly lower than the estimates generated in this study. Third, the own price demand elasticity varies significantly by income group and location. High-income consumers exhibit an inelastic own price demand for high quality imported rice, their preferred option among all staples with a market share of 30 percent, while middle and low-income consumers show an elastic response to the price of high quality domestic rice, their preferred rice option. Likewise, urban consumers have inelastic demands for all three rice options, while rural consumers are highly sensitive to changes in the price of high quality domestic rice, their preferred rice option. Lastly, substitution between imported and domestic rice is limited as evidenced by the small cross-price elasticity values, but varies by income level.
27 Low-income consumers are less willing to substitute imported for domestic rice than middle and high-income consumers.
Since the rice crisis of 2007/08, Benin along with many other African countries have embarked in a plan to improve its rice supply chain and rice self-sufficiency. Benin developed its National Rice Development Strategy (NRDS) in 2011with the overarching goal of becoming rice self-sufficiency by 2018, but despite progress since then domestic production covers only around a quarter of domestic consumption. The findings of this study can help with the formulation of sound sectoral policies aimed at fostering the growth of the domestic rice sector by providing basic information to facilitate the impact analysis of relative changes in the price of imported and domestic rice.
Our findings suggest that a rice development strategy based on import market protection will not generate a large push in the demand for domestic rice, and will actually hurt consumers, primarily those from the high-income and urban groups. Table 8 shows the change in the demand for staple foods resulting from a 10 percent increase in the price of high quality imported rice. Demand for imported rice is estimated to decrease significantly by 17 percent nationwide while the demand for high quality domestic rice, its closest substitute, increases by 2 percent. The results show that such a policy intervention will have a clear bias against high-income groups that consume more imported rice, while it will have much smaller impacts on middle and low-income groups.
28 Table 8: Percentage Change in the Demand of the Selected Staples Due to a 10% Increase in the Price of High Quality Imported Rice
HQIR4 HQDR5 SQDR6 Yam Cassava Corn
Low Income1 -11% 0% 0% -4% -1% 3%
Middle Income2 -27% 4% -1% 3% -4% 11%
High Income3 -9% 0% -1% 2% 1% 2%
All income groups† -17% 2% -1% 0% -2% 6%
1. Monthly income ≤ 100,000. 2. 100,000 < monthly income ≤ 200,000. 3. Monthly income > 200,000.
4. High quality imported rice. 5. High quality domestic rice. 6. Standard quality domestic rice. †. The aggregation across income groups is based on the population shares by income group from AGSVA (2014)
On the other hand, policies aimed at lowering the production cost and retail price of domestic rice can generate a sizable increase in the demand for domestic rice. As Table 9 shows, the demand for domestic high and standard quality rice increases by 13 percent and 15 percent, respectively, due to a 10% decrease in the price of domestic rice, while the demand for imported rice decreases by 3 percent. Also, we can expect that the benefits from lower domestic rice prices be more evenly distributed across income groups.
29 Table 9 : Percentage Change in the Demand of the Selected Staples Due to a 10% Decrease in the Price of Domestic Rice
HQIR4 HQDR5 SQDR6 Yam Cassava Corn
Low Income1 -2% 11% 15% -6% -3% -7%
Middle Income2 -2% 18% 13% -9% -4% -12%
High Income3 -8% 8% 16% -10% -5% -8%
All income groups† -3% 13% 15% -8% -4% -9%
1. Monthly income ≤ 100,000. 2. 100,000 < monthly income ≤ 200,000. 3. Monthly income > 200,000.
4. High quality imported rice. 5. High quality domestic rice. 6. Standard quality domestic rice. †. The aggregation across income groups is based on the population shares by income group from AGSVA (2014)
Finally, our findings highlight the importance of improving the quality of domestic rice to bring it up to par with imported rice. Based on the representative rice qualities used in this study, our findings suggest that changes in relative prices can improve demand for domestic rice only so much, and that quality upgrades to domestic rice are a must if Benin intends to significantly improve its rice self-sufficiency.
30 REFERENCES
Arinloye, D. D. A. A (2006). Analysis of factors determining rice demand in center and south of Benin. Thesis of Agricultural Engineer, University of Abomey-Calavi, Benin.
Aker, J. C., Block, S., Ramachandran, V., & Timmer, C. P. (2010). West African experience with the world rice crisis, 2007–2008. The rice crisis: markets, policies and food security, 143-162. Bezemer, D., & Headey, D. (2008). Agriculture, development, and urban bias. World
Development, 36(8), 1342-1364.
Cuevas, R. P., Pede, V. O., McKinley, J., Velarde, O., & Demont, M. (2016). Rice grain quality and consumer preferences: a case study of two rural towns in the Philippines. PloS one, 11(3), e0150345.
Demont, M., Fiamohe, R., & Kinkpe, A. T. (2017). Comparative advantage in demand and the development of rice value chains in West Africa. World Development, 96, 578-590.
Demont, M., & Neven, D. (2013). Tailoring African Rice Value Chains to Consumers. Realizing Africa's Rice Promise, 303.
Diagana, B., Akindes, F., Savadogo, K., Reardon, T. and Staatz, J. (1999) Effects of the CFA franc devaluation on urban food consumption in West Africa: overview and cross-country comparisons. Food Policy 24, 465–478.
Dupraz, C. L., & Postolle, A. (2013). Food sovereignty and agricultural trade policy commitments: How much leeway do West African nations have? Food Policy, 38, 115-125.
FAOSTAT (2018). Data base accessed on March, 15 2018.
Fiamohe, R. E., & Kinkpé, A. T. (2016, September). Analyzing potential demand for local rice in West Africa. In 2016 AAAE Fifth International Conference, September 23-26, 2016, Addis Ababa, Ethiopia (No. 249281). African Association of Agricultural Economists (AAAE). Fofana, I., Goundan, A., & Domgho, L. V. M. (2014). Impact simulation of ECOWAS rice
self-sufficiency policy, IFPRI Discussion Paper 1405. Washington, DC: International Food Policy Research Institute, http://ebrary.ifpri.org/cdm/ref/collection/p15738coll2/id/128894.
Gyimah-Brempong, K., & Kuku, O. (2016). Evolution of consumption and demand patterns. The Nigerian Rice Economy: Policy Options for Transforming Production, Marketing and Trade, 21-50.
Gustavsen, G.W. (2015). Consumer Cohorts and Demand Elasticities. European Review of Agricultural Economics. 42: 217–37.
31 RGPH (2013). Principaux indicateurs socio-démographiques et économiques. Accessible at
http://benin.opendataforafrica.org
Laroche Dupaze, C. and Postelle, A. (2013). Food sovereignty and agricultural trade policy commitments: how much leeway do West African nations have. Food policy, 38, 115-125. Leather, H. D., & Foster, P. (2004). The World Food Problems towards Ending Undernutrition in
the Third Word.
Lusk, J. L. & Tonsor G. T. (2016). How Meat Demand Elasticities Vary with Price, Income, and Product Category. Applied Economic Perspectives and Policy (2016) volume 38, number 4, pp. 673–711.
McFadden, D., & Train, K. (2000). Mixed MNL models for discrete response. Journal of applied Econometrics, 15(5), 447-470.
Mhlanga, S. (2010). Economic analysis of consumer based attributes for rice in Benin (Master’s Thesis, McGill University).
Naseem, A., Mhlanga, S., Diagne, A., Adegbola, P. Y., & Midingoyi, G. S. K. (2013). Economic analysis of consumer choices based on rice attributes in the food markets of West Africa—the case of Benin. Food security, 5(4), 575-589.
World Food Program, WFP (2014). Analyse Global de la Vulnérabilité et de la Sécurité Alimentaire (AGVSA, 2013). Service de l’Analyse de la Sécurité Alimentaire (VAM), 142p. World Food Program, WFP (2017). Analyse Global de la Vulnérabilité et de la Sécurité Alimentaire (AGVSA, 2017). Service de l’Analyse de la Sécurité Alimentaire (VAM), 173p. Piggott, N. E., and T. L. Marsh (2004). Does Food Safety Information Impact US Meat Demand?
American Journal of Agricultural Economics 86: 154–74.
Pinstrup-Andersen, P., & Caicedo, E. (1978). The potential impact of changes in income distribution on food demand and human nutrition. American Journal of Agricultural Economics, 60(3), 402-415.
Reardon, T. (1993). Cereals demand in the Sahel and potential impacts of regional cereals protection. World Development 21, 17–35.
Rutsaert, P., Demont, M., & Verbeke, W. (2013). Consumer Preferences for Rice in Africa. In Realizing Africa’s rice promise (pp. 294-302). CABI.
Seale Jr., J., Regmi, A., and Berstein, J. (2003). International Evidence on Food Consumption Patterns. United States Department of Agriculture, Economic Research Service. Technical Bulletin Number 1904
Seck, P. A., Touré, A. A., Coulibaly, J. Y., Diagne, A., & Wopereis, M. C. (2013). Africa’s rice economy before and after the 2008 rice crisis. Realizing Africa’s rice promise, 24-34.
32 Tonsor, G. T., Mintert J., and Schroeder T. C. (2010). U.S. Meat Demand: Household Dynamics and Media Information Impacts. Journal of Agricultural and Resource Economics 35: 1–17. Train, K. E. (2009). Discrete choice methods with simulation. Cambridge university press. Unnevehr, L., Eales, J., Jensen, H., Lusk, J., McCluskey, J., & Kinsey, J. (2010). Food and
consumer economics. American Journal of Agricultural Economics, 92(2), 506-521.
USDA (United State Department of Agriculture). 2005 International Food Consumption Patterns estimation.
33 APPENDIX
Table 1: Covariance of Alternative Specific Constants for Random Parameters models by income group and location
Pooled
Income Groups Locations
Low Income Middle Income High Income Rural Area Urban area HQI, HQD 0.097 (0.345) 1.537* (0.694) 0.311 (0.631) 3.298. (1.735) 0.22 (0.48) 1.92 * (0.84) HQI, LQD 0.01 (0.357) 0.464 (0.7) 0.806 (0.751) 3.318. (1.73) 0.05 (0.46) 1.37 * (0.65) HQI, Yam 1.59*** (0.369) 0.278 (0.616) 0.793 (0.735) 1.751 (1.676) 2.27 *** (0.54) 2.76 *** (0.64) HQI, CAS 0.825. (0.448) 0.218 (0.626) 0.265 (0.801) 2.04 (1.814) 1.03 * (0.47) 1.91 ** (0.65) HQI, Corn 0.463 (0.411) 0.313 (0.627) 0.815 (0.757) 2.188 (1.665) 1.44 ** (0.55) 1.62 ** (0.62) HQD, LQD 2.205*** (0.377) 1.386 (0.872) 0.902 (0.636) 1.883** (0.717) 0.4 (0.52) 4.4 *** (1.1) HQD, Yam 1.844*** (0.367) 0.648 (0.939) 0.568 (0.49) 1.993** *(0.564) 0 (0.53) 4.06 *** (1.09) HQD, CAS 1.283** (0.414) 0.109 (0.853) 0.402 (0.596) 3.715** (1.192) 1.1 . (0.57) 3.35 ** (1.08) HQD, Corn 2.849*** (0.399) 1.004 (0.883) 2.018 *** (0.593) 0.433 (0.592) 1.14 * (0.56) 5.14 *** (1.11) LQD, Yam 2.125*** (0.224) 1.618*** (0.37) 2.392 *** (0.366) 0.608 (0.501) 1.66 *** (0.42) 2.53 *** (0.49) LQD, CAS 2.106*** (0.257) 1.682***( 0.37) 2.355 *** (0.455) 1.222. (0.727) 0.29 (0.51) 2.62 *** (0.41) LQD, Corn 1.67*** (0.187) 1.074** (0.361) 2.78 *** (0.333) 0.788 (0.507) 1.76 *** (0.38) 1.86 *** (0.38) Yam, CAS 0.473. (0.261) 0.695* (0.321) 0.564 (0.367) 1.776* (0.761) 0.97 * (0.47) 0.86 *** (0.25) Yam, Corm 1.854*** (0.173) 2.015***( 0.249) 1.674 *** (0.327) 1.159** (0.356) 1.19 ** (0.38) 1.79 *** (0.19) CAS, Corn 0.168 (0.207) 0.311 (0.229) 0.469 . (0.28) 0.3 (0.409) 1.04 *** (0.25) 0.14 (0.17) Standard errors in parenthesis; ‘***’,’**’, ‘*’, significance at 1, 5, and 10%.
HQIR: High quality imported rice; HQDR: High quality domestic rice; SQDR: Standard quality domestic rice; CAS: Cassava.
34 Table 2: Correlation Matrices for Random Parameters Implied by the Variance-Covariance Matrix
Pooled HQI HQD LQD Yam CAS Corn
HQI 1 0.0047 0.0004 0.052 0.0347 0.0144 HQD 0.0047 1 0.294 0.2004 0.1794 0.2937 LQD 0.0004 0.294 1 0.1925 0.2455 0.1435 Yam 0.052 0.2004 0.1925 1 0.0449 0.1298 CAS 0.0347 0.1794 0.2455 0.0449 1 0.0151 Corn 0.0144 0.2937 0.1435 0.1298 0.0151 1 Low income HQI 1 0.0559 0.015 0.0067 0.0081 -0.0084 HQD 0.0559 1 -0.3459 -0.1203 0.0313 -0.2067 LQD 0.015 -0.3459 1 0.2678 0.4312 0.1971 Yam 0.0067 -0.1203 0.2678 1 0.1325 0.2751 CAS 0.0081 0.0313 0.4312 0.1325 1 0.0658 Corn -0.0084 -0.2067 0.1971 0.2751 0.0658 1 Middle income HQI 1 0.0247 0.0516 -0.0527 -0.0212 0.0405 HQD 0.0247 1 0.1135 0.0741 -0.0633 0.1969 LQD 0.0516 0.1135 1 0.2514 0.2988 0.2186 Yam -0.0527 0.0741 0.2514 1 0.0742 0.1511 CAS -0.0212 -0.0633 0.2988 0.0742 1 -0.0461 Corn 0.0405 0.1969 0.2186 0.1511 -0.0461 1 High income HQI 1 0.1713 0.1503 0.1063 0.0741 0.1428 HQD 0.1713 1 0.148 0.21 0.2344 0.0491 LQD 0.1503 0.148 1 0.0558 -0.0672 -0.0778 Yam 0.1063 0.21 0.0558 1 -0.1309 0.1535 CAS 0.0741 0.2344 -0.0672 -0.1309 1 0.0238 Corn 0.1428 0.0491 -0.0778 0.1535 0.0238 1 Rural area HQI 1 0.0149 -0.005 0.1199 0.0707 0.0715 HQD 0.0149 1 0.1226 0 0.2325 -0.1741 LQD -0.005 0.1226 1 0.3965 0.0901 0.3951 Yam 0.1199 0 0.3965 1 -0.1598 0.1416 CAS 0.0707 0.2325 0.0901 -0.1598 1 -0.161 Corn 0.0715 -0.1741 0.3951 0.1416 -0.161 1 Urban area HQI 1 0.0415 0.0267 0.0465 0.039 0.0266 HQD 0.0415 1 0.1915 0.1531 0.1531 0.1886 LQD 0.0267 0.1915 1 0.0859 0.1079 0.0615 Yam 0.0465 0.1531 0.0859 1 0.0307 0.0513
35 Table 2. (Continued).
Urban area HQI HQD LQD Yam CAS Corn
CAS 0.039 0.1531 0.1079 0.0307 1 0.0049
Corn 0.0266 0.1886 0.0615 0.0513 0.0049 1
HQIR: High quality imported rice; HQDR: High quality domestic rice; SQDR: Standard quality domestic rice; CAS: Cassava.
Table 3: Main Effects Orthogonal Design Used in the Choice Experiment Survey (FCFA/kg)
Question HQIR HQDR SQDR Yam Cassava Corn Block
1 900 300 150 100 75 50 1 2 900 500 350 500 75 200 1 3 900 700 550 300 75 400 1 4 1300 700 350 100 250 50 1 5 1300 300 550 500 250 200 1 6 1300 500 150 300 250 400 1 7 1100 500 550 100 450 50 1 8 1100 700 150 500 450 200 1 9 1100 300 350 300 450 400 1 10 1300 500 550 500 75 50 2 11 1300 700 150 300 75 200 2 12 1300 300 350 100 75 400 2 13 1100 300 150 500 250 50 2 14 1100 500 350 300 250 200 2 15 1100 700 550 100 250 400 2 16 900 700 350 500 450 50 2 17 900 300 550 300 450 200 2 18 900 500 150 100 450 400 2 19 1100 700 350 300 75 50 3 20 1100 300 550 100 75 200 3 21 1100 500 150 500 75 400 3 22 900 500 550 300 250 50 3 23 900 700 150 100 250 200 3 24 900 300 350 500 250 400 3 25 1300 300 150 300 450 50 3 26 1300 500 350 100 450 200 3 27 1300 700 550 500 450 400 3
HQIR: High quality imported rice; HQDR: High quality domestic rice; SQDR: Standard quality domestic rice