1
Dividend Policy and Share Price Volatility: UK Evidence
Khaled Hussainey Ain Shams University, Egypt Accounting and Finance Division
Stirling Management School Stirling University
Stirling FK9 4LA
Email: Khaled.Hussainey@stir.ac.uk
Chijoke Oscar MGBAME Department of Accounting, Faculty of Management Sciences,
University of Benin, Nigeria. Email: chijokem@yahoo.com
Aruoriwo M. Chijoke-Mgbame Accounting and Finance Division
Stirling Management School Stirling University
Stirling FK9 4LA
Email: Mariwo4luv@yahoo.com
Forthcoming
Journal of Risk Finance 2010
2 ABSTRACT
Purpose: The purpose of this paper is to examine the relationship between dividend policy
and share price changes in the UK stock market.
Methodology: Following Baskin (1989) and Allen and Rachim (1996), we use a multiple
regression analyses to explore the association between share price changes and both dividend yield and dividend payout ratio.
Findings: We find a positive relationship between dividend yield and stock price changes
and a negative relationship between dividend payout ratio and stock price changes. In addition, our results show that firm’s growth rate, debt level, size and earnings explain stock price changes.
Practical implications: The study supports the fact that dividend policy is relevant in
determining share price changes for a sample of firms listed in the London Stock Exchange. The challenge for managements/accountants is to generally improve the quality of the financial statements (i.e. income statement) to avoid producing wrong information which could lead to wrong decisions by investors.
Originality: To the best of our knowledge, this research is the first to show that corporate
dividend policy is a key driver of stock prices changes in the UK.
Keywords: dividend policy: share price changes: dividend yield: dividend payout ratio.
3 INTRODUCTION
Issues of dividend policy range from its puzzle by Black (1976) to its irrelevance by Miller and Modigliani (1961) then to its relevance by DeAngelo (1996). Other issues include theories on dividend payment such as the stakeholders’ theory, pecking order theory, agency cost, signalling theory, bird in hand fallacy and clientele effect. The information asymmetry between managers and shareholders, along with the separation of ownership and control, formed the base for another explanation for why dividend policy has been most popular. Also in line with this subject area, Al-Malkawi (2007), Al-Nijjar and Hussainey (2009) established that there is a negative relationship between dividend payout and outside directorship.
The volatility of share price on the other hand is the systemic risk faced by investors who possess ordinary shares investment Guo (2002). Investors are by nature risk averse, and the volatility of their investments is of importance to them because it is a measure of the level of risk they are exposed to. The UK Stock Market, which cannot be classified as an emerging one, manifest the features of a matured market, with relatively moderate regulations than those of emerging markets of the Africa. Companies realize, also, that investors pay close attention to their dividend returns, and that the riskiness of their investments may affect the valuation of the firm’s shares in the long run. This makes the volatility of stock prices as important to firms as it is to investors.
The debate has been whether corporate dividend policy has any relationship with stock price movement. In this connection, this paper is aimed at establishing a relationship between dividend policy and share price volatility with particular focus on the UK Capital Market. The research is premised on the theoretical framework as created by Baskin (1989) and Allen and Rachim (1996). We employ correlation and multiple least square regressions in order to establish the extent to which dividend policies of firms in the UK affect their share price changes. We regress share price changes on two dividend variables to establish this relationship. The independent variables are dividend yield and pay out ratios. However, this research is different from that of Baskin and Allen and Rachim in some ways; 1) it analyses firms in the UK, 2) it excludes firms in the finance sector because of their specialised regulatory nature 3) it makes use of more recent years where most economies have evolved greatly. 4) It discusses the determinants of dividend policy as well as the theories of dividend policy.
LITERATURE REVIEW
Dividend policy is a firm’s policy with regards to paying out earnings as dividend versus retaining them for reinvestment in the firm. It is the division of profit between payments to shareholders and reinvestment in the firm. Dividend policy is thus an important part of the firm’s long-run financing strategies.
Dividend Policy and Share Price Volatility
In early corporate finance, dividend policy referred to a corporation’s choice of whether to pay its shareholders a cash dividend or to retain its earnings. It addressed the frequency of such payments (whether annually, semi-annually or quarterly) and how much the company should, if it decides to do so, pay.
Dividend policy, in today’s corporations, has gone beyond this scope to include such issues as whether to distribute cash via share repurchase or through specially-designated rather than
4
regular dividends. Other issues considered are how to balance the preferences of highly taxed and relatively “untaxed” investors, how to maintain, and improve, the value of its shares and stocks in the market, etc.
However, the vital questions asked today by corporate managers are the very same ones asked by managers in the 1950s. Litner (1959) identified these questions as:
- Should dividend payments be maintained at its current level or changed?
- Would investors prefer stable dividend payouts, or those that fluctuate with earnings?
- Should dividend policy favour older or young investors?
The dividend policy of companies has, thus been a common subject of research for more than half of a century (Litner, 1959; Gordon, 1959; Modigliani, 1982; etc) and it has been related to several vital corporate matters ranging from agency problems to share valuation.
The volatility of ordinary stock is a measure used to define risk, and represents the rate of change in the price of a security over a given time. The greater the volatility, the greater the chances of a gain or loss in the short run is. Volatility has to do with the variance of a security’s price. Thus, if a stock is labelled as volatile, its price would greatly vary over time, and it is more difficult to say in certainty what its future price will be. Investors’ preference is for less risk. The lesser the amount of risk, the better the investment is (Kinder, 2002). In other words the lesser the volatility of a given stock, the greater its desirability is.
The linkage between the dividend policy of corporations and the volatility of their stock prices has been explored at different times by different researchers (Allen and Rachim, 1996; Baskin, 1989). Also, a number of dividend theories exist that attempt an explanation of the influence of corporate dividend policies on stock prices. These theories include the clientele effect, the information or signalling effect, the bird-in-hand theory and the rate of return effect.
Theories of dividend policy
Dividend policy has been a strong bone of contention in the area of finance, this is evidenced by numerous studies on dividend policy, from Lintner (1956) to Modigliani and Miller (1961) to, Bhattacharya (1979) and more recently DeAngelo et al (1996), Fama and French (2001), Al-Malkawi (2007) and Al-Najjar and Hussainey (2008). Below are some of the theories of dividend policy:
Dividend irrelevance theory: Miller and Modigliani (1961) proposed that dividend policy is
irrelevant to the shareholder. That stockholder wealth is unchanged when all aspects of investment policy are fixed and any increase in the current payout is financed by fairly priced stock sales. The main assumption is that there is 100% payout by management in every period. Others are 1) there exist perfect capital markets. That is, no taxes or transactional cost, market price cannot be influenced b a single buyer or seller and that there is free and costless access to information about the market. 2) that investors are rational and that they value securities based on the value of discounted future cash flow to investors. 3) that managers act as the best agents of shareholders 4) and that there is certainty about the investment policy of the firm with full knowledge of future cash flows. In the light of the foregoing, they concluded that the issue of dividend policy is irrelevant.
5
Bird in hand theory: Al-Malkawi (2007), asserts that in a world of uncertainty and
information asymmetry, dividends are valued differently from retained earnings (capital gains). “A bird in hand; (dividend), is worth more than two in the bush; (capital gains)”. Due to uncertainty of future cash flow, investors will often tend to prefer dividends to retained earnings. Though this argument has been widely criticised and has not received strong empirical support, it has been supported by Gordon and Shapiro (1956), Lintner (1962), and Walter (1963). The main assumptions are; that investors have imperfect information about the profitability of a firm. And that cash dividends are taxed at a higher rate than when capital gain is realised on the sale of a share. Also that dividends function as a signal of expected cash flows. Despite the tax disadvantage of paying dividends, management still go ahead to pay dividends to send a positive signal about the firm’s future prospects. The cost of this signalling is that cash dividends are taxed higher than capital gains. While some investors would rather have capital gains to cut down on tax impact others may want dividend because of immediate cash requirement. He also assumed that assets in which management invest in, outlive the stay of management in position, and that ownership of the assets is transferred to other management overtime.
Agency cost and the free cash flow theory: agency cost is the cost of the conflict of interest
that exists between shareholders and management see Ross et al (2008). This arises when management act on their behalf rather than on behalf of shareholders who own the firm. This could be direct or indirect. Though this is contrary to the assumptions of Modigliani and Miller (1961), who assumed that managers are perfect agents for shareholders and no conflict of interest exist between them. This is somewhat questionable, as the owners of the firm are different from the management. Managers are bound to conduct some activities which could be costly to shareholders such as undertaking unprofitable investments that would yield excessive returns to them, and unnecessarily high management compensation see Al-Malkawi (2007). These cost are borne by shareholders, therefore shareholders of firms with excess free cash flow would require high dividend payment instead. Agency cost may also arise between shareholders and bondholders, while shareholders require more dividends, bondholders require less dividends to shareholders by putting in place debt covenant to ensure availability of cash for their debt repayment. Easterbrook (1984) also identified two agency cost; the cost of monitoring of managers and the cost of risk aversion on the part of managers.
Signalling Hypothesis: though Modigliani and Miller (1961), assumed that there is perfect
knowledge about a firm by investors and management, this has been countered by many researchers as management who look after the firm tend to have more precise and timely information about the firm than outside investors. This therefore creates a gap between managers and investors, to bridge this gap, management use dividend as a tool to convey private information to shareholders see Al-Malkawi (2007). Pettit (1972) observed the amount of dividend paid seem to carry great information about the prospects of a firm, this can be evidenced by the movement of share price. An increase in dividend may be interpreted as good news and brighter prospects and vice versa. But Lintner (1956) observed that management are reluctant to reduce dividend even when there is the need to do so. And only increase dividend when it is believed that earnings have permanently increased.
Clientele effects of Dividends theories: investors tend to prefer stocks of companies that
satisfy a particular need. This is because investors face different tax treatment for dividends and capital gains. And also face some transaction cost when they trade securities. Modigliani and Miller (1961) argued that for these cost to be minimised, investors tend towards firms
6
that would give them those desired benefits. Likewise firms would attract different clientele based on their dividend policies. Though they argued that even though clientele effect may change a firms dividend policy, one clientele is as good as another, therefore dividend policy remains irrelevant. Al-Malkawi (2007) affirms that firms in their growth stage, which tend to pay lower dividend would attract clientele that desire capital appreciation, while those firms in their maturity stage which pay higher dividends attract clientele that require immediate income in the form of dividend. Al-Malkawi (2007), grouped the clientele effect in two, those that are driven by tax effects and those driven by transaction cost. He argued that investors that are on high tax bracket would prefer firms that pay little or no dividends to get reward in the form of share price appreciation and vice versa. Transaction cost induced clientele on the other hand, arises when small investors depend on dividend payments for their needs; prefer companies who satisfy this need because they cannot afford the high transaction cost in selling securities.
METHODOLOGY
The relationship between ordinary stock price volatility and dividend policy has been analyzed utilizing multiple least square regressions. The regression model developed basically relates price volatility with the two main measures of dividend policy – dividend yield and dividend payout ratio. In line with the recommendations by Baskin (1989), a number of control variables was included to account for certain factors that affect both dividend policy and stock price volatility – Asset Growth, Earnings Volatility and firm size. The model was evaluated annually over the 10(ten) years period to measure the periodic effect of dividend policy on stock price volatility. Multiple regression analysis was used to describe these relationships and a correlation analysis was done amongst the variables. Firstly, the dependent variable price- volatility was regressed against the two main independent variables; DIVIDEND YIELD and PAYOUT RATIO. This provides a crude test of the relationship between share price volatility and dividend policy with the regression equation:
P-Vol = a1 +a2D-yieldj + a3Payoutj +ej (1)
Baskin (1989) analysis, showed a significant negative relationship between dividend yield and dividend payout and share price volatility. Allen and Rachim (1996) reported a positive relationship between share price volatility and dividend yield, but a negative relationship between share price volatility and dividend payout. The close relationship between the dividend yield and dividend payout ratio, may pose a little problem as there are a number of factors that influence both dividend policy and price volatility. To limit these problems, the control variables mentioned earlier were included in the analysis. The dependent variable was regressed against the two independent variables and the control variables with the following regression equation:
P-Vol= a1 +a2D-yieldj + a3Payoutj + a4Sizej + a5 Earningsj + a6 Debtj + ej (2)
Expected Results
The expectation was that dividend yield, payout and size would be inversely related to price
7
size of a firm, there would be a decrease in the volatility of the stock price of a firm. While
earnings volatility and the level of debt would be positively related to share price volatility,
the more volatile a firm’s earnings and a higher leverage, the more volatile would be the stock price.
There is also the possibility that the close association between dividend policy and price volatility may be attributed to industry patterns than individual company policies alone, hence dummy variables were included which represents industry classification into two, services and industrial companies, with the equation:
P-Vol= a1 +a2D-yieldj + a3Payoutj + a4Sizej + a5 Earningsj + a6Debtj + a7Dum2 + ej (3) The coefficient of the first dummy variable service companies is represented by the intercept.
Definition of variables
Price volatility: This is the dependent variable, it is based upon the annual range of adjusted
stock price obtained from Datastream, for each year, the range is then divided by the average of the high and low prices obtained in the year and then squared. This was averaged for all available years and a square root transformation was applied so as to obtain a variable comparable to a standard deviation Baskin (1989). The use of proxy for share price volatility rather than standard deviation was deliberate. This is basically because standard deviation could be influenced by extreme values. Again, our approach is in line with that of Baskin (1989) whose study forms the theoretical framework of this research.
Dividend Yield: This is expressed as the dividend per share as a percentage of the share
price. Figures were obtained directly from Datastream. Dividend is calculated on gross dividends i.e. excluding tax credits. The average was taken for all available years.
Payout ratio: this is the ratio of dividends per share to earnings per share for all available
years. The average over all available years was utilised. The figures were obtained directly from Datastream.
Size (market value): this is the share price multiplied by the number of ordinary shares in
issue. A transformation using the base 10 logarithm is then applied to obtain a variable that reflects orders of magnitude. The figures were obtained directly from Datastream.
Earnings volatility: earnings figures were obtained from Datastream. it represents the
earnings before interest and taxes (EBIT). Following Dichev and Tang (2009), earnings volatility is calculated by taking the standard deviation of earnings for the most recent preceding five years for each year, it is the same as taking the standard deviation of the of the deflated earnings for the most recent five years.
Long-term debt (DEBT): Figures for long-term debt and total asset were obtained directly
from Datastream. This represents all interest bearing financial obligations excluding amounts due within one year e. g debentures, mortgages and loans with maturity greater than one year. It is shown net of premiums or discount. The ratio of the long-term debt to total asset was calculated and the average over all available years was utilised.
8
Growth in Assets (GROWTH): Figures for growth in assets were obtained directly from
Datastream. The growth rate for each year was obtained by taking the ratio of the change in total asset at the end of the year to the level of total asset at the beginning of the year. This was averaged over all available years.
EMPIRICAL RESULTS
Table 1 shows a broad description of the summary statistics of the variables used in the study. It shows the statistical means, standard deviation, median, and standard error. According to Allen and Rachim (1996), if it is assumed that stock prices follow a normal distribution pattern and ignoring the effect of firm’s going ex-dividend, the standard deviation of stock market returns equivalent to the measured volatility of this study. This can be done using the formula derived by Parkinson (1980) in line with Baskin (1989), here, the mean of price volatility 0.2940, is multiplied by the constant 0.6008 which gives a result of 17.66%. This is inline with the results of Allen and Rachim (1996) on Australian firms which was 29.42% and Baskin (1989) with US firms of 36.9%.
Insert Table 1 here
Table 2 shows the correlation amongst the variables utilised for the study. From the table, it can be seen that the correlation between price volatility and dividend yield is negative (-0.2583) as expected, this is in line with that of Baskin(1989) which was -0.643, but it is in contrast with that of Allen and Rachim (1996) which was positive (0.006). Also the correlation between price volatility and dividend payout is negative (-0.4446) as expected and it is in line with the correlation in both Baskin’s (1989) which was -0.542 and Allen and Rachim (1996)which was -0.210. The correlation table also shows a high correlation between dividend yield and payout with values 0.6684 (approximately 70%), this raises questions as there is the possibility of multicollinearity which could be a potential problem. Multicollinearity problem exist when the correlation between two independent variables is equal to or greater than 70% (Drury, 2008). There is therefore the need for the inclusion of the control variables in the regression equation to see if there would be changes. The correlations for other variables are in line with their predicted sign with share price volatility. But there is a significant high correlation between earnings volatility and size with the value 0.8631; this indicates that the multicollinearity problem exists between the two variables. This contrast with that of Allen and Rachim (1996). The regression equation 2 was therefore run with and without one of the two variables to see if there was any effect, this is shown later on Tables 4.7 and 4.8. Earnings volatility has a negative correlation with both dividend yield and payout ratio. This is in-line with expectation as firms with volatile earnings are perceived to be more risky and management tends to pay lower dividends to have enough retained earnings for years when earnings are bad, this in turn affects dividend yield.
Insert Table 2 here
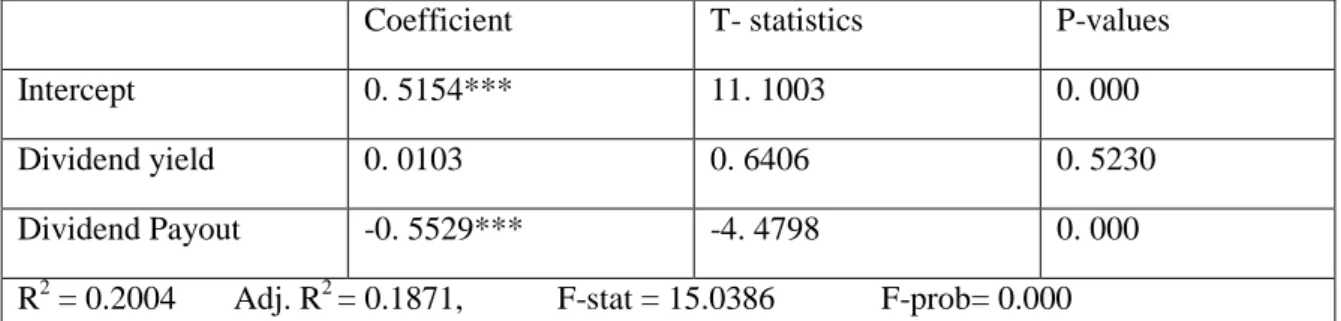
Table 3 shows the results obtained from equation 1. The regression results of share price volatility with dividend yield and dividend payout shows a positive relationship between
9
dividend yield and share price volatility and a negative relationship between dividend payout and share price volatility. But that of dividend yield is contrary to expectation. This could be an explanation of the earlier mentioned high correlation between the dividend yield and dividend payout ratio, which is a possible problem of multicollinearity.
Insert Table 3 here
Next, the control variables were added to see if there would be any change in the coefficient of dividend yield. This is given by the regression equation 2. From Table 4, it was observed that the coefficient of dividend yield is now negative, and all other variables are exactly as expected. This explains the fact that dividend policy on its own is not the determining factor of price volatility. But a close examination of the t-statistics and p-value of the dividend payout,-0.9946 and 0.3220 respectively, it was discovered that this was insignificant. To check the cause of this, dividend payout and dividend yield was simultaneously dropped out of the equation and the results are shown in Tables 5 & 6.
Insert Tables 4&5&6 here
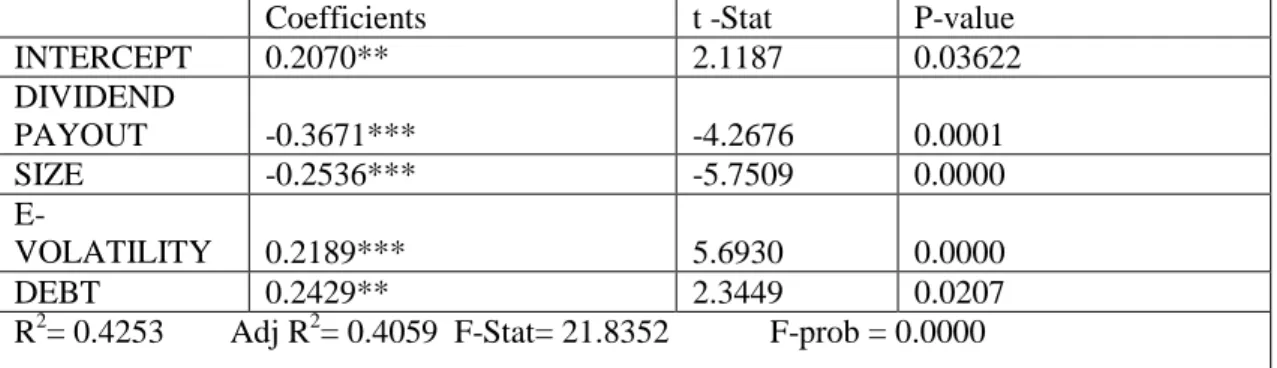
The results in Table 5 which was the regression without payout showed that there was no much difference in the values of the variables just a slight increase in the coefficients. Table 6 on the other hand, shows that the previous insignificant result of payout is now significant, as well as other variables remaining as predicted. These results are consistent with Allen and Rachim (1996).
Going back to the correlation table, it was observed that there was a significantly high correlation between size and earnings volatility. To check if this correlation is statistically insignificant or not, each of the two variables is simultaneously dropped from the analysis. Tables 7 and 8 show the result. Table 7 and 8 show that there is no effect of removing each of the two variables simultaneously, except that the coefficient of dividend yield is now positive. The reason for the high correlation between the two variables is not clear. However, the correlation is statistically insignificant since there was no effect when the variables were dropped from the analysis.
Insert Tables 7 &8 here
Lastly, we include industry dummy variables in the regression analysis given by equation 3. This is shown on Table 9. However, we find no significant relationship between stock price changes and industry factors.
Insert Table 9 here
SUMMARY AND CONCLUSION
The objective of this study was to examine the relationship between dividend policy (dividend yield and dividend payout) and the volatility of stock price. This was done for a period of 10 years (1998 through 2007). It was based on a sample of publicly quoted companies in the UK. It also examined the relationship between stock price volatility and other variables such as size, growth, earnings volatility and debt.
The empirical findings suggest that there is a significant negative relationship between the payout ratio of a firm and the volatility of its stock price and a negative relationship between
10
dividend yield and the volatility of stock price. This is consistent with the findings of Allen and Rachim (1996). But the findings on payout ratio were contrary to the findings of Baskin (1989). The overall findings suggest that the higher the payout ratio the less volatile a stock price would be. That payout ratio is the main determinant of the volatility of stock price. Among the control variables, it was discovered that size and debt had the highest correlation with price volatility. While size had a significant negative relationship with price volatility, suggesting that the larger the firm, the less volatile the stock price, debt on the other hand showed a significant positive relationship with price volatility suggesting that the more leveraged a firm is, the more volatile would be the stock price.
Since both management and investors are concerned about the volatility of stock price, this research has provided a light on the path way to discovering what moves stock price and important factors to be considered by investors before making investment decisions, and management in formulating dividend policies for their firms. This research also discussed some theories of dividend policy, determinants of dividend policy as well as theories of risk and dividends.
11 REFERENCES
Allen D. E. and Rachim V. S. (1996) “Dividend policy and stock price volatility: Australian Evidence”, Journal of Applied Economics, Vol. 6 pp. 175-188.
Al- Malkiwi H. N. (2007) “Determinants of corporate dividend policy in Jordan: an application of the Tobit Model”, Journal of Applied Accounting Research, Vol. 23, pp. 44-70. Al-Najjar B. and Hussainey K. (2009) “The association between dividend payout and outside directorships”, Journal of Applied accounting Research, Vol. 10, pp. 4-19.
Baskin J. (1989), “Dividend policy and the volatility of common stock”. The Journal of Portfolio Management, Vol. 15, pp. 19-25.
Battacharya S. (1979) “Imperfect information & dividend policy and the ‘bird in hand’ fallacy”, The Bell Journal of Economics, Vol. 10, pp. 259-270.
Black F. (1976), “The dividend puzzle”, Journal of Portfolio Management, Vol. 2, pp. 5-8. DeAngelo H., DeAngelo L. and Skinner D. J. (1996) “Reversal of fortune: dividend policy and the disappearance of sustained earnings growth”, Journal of Financial Economics, Vol. 40, No3, pp. 341-371.
Drury, C. (2008). Management & Cost Accounting. 7th edition. London : Cengage learning. Easterbrook F. H. (1984) “Two agency-cost explanations of dividends”, The American Economic Review, Vol. 74, pp. 650-659.
Fama E. and French k. (2001) “Disappearing dividends: changing firm characteristics or lower propensity to pay?”, Journal of Financial Economics, Vol. 60, pp. 3-43.
Gordon M. J. and Shapiro E. (1956) “Capital equipment analysis: the required rate of profit”, Management Science, Vol.3, pp. 102-110.
Guo H. (2002) “Stock market returns, volatility and future output”, available at: http://www.research.stlouisfed.org/publications/review/02/09/75-86Guo.pdf.
Kinder, C., (2002) “Estimating Stock Volatility.” Available at http://finance.yahoo.com Lintner J. (1962) “Dividends, earnings, leverage, stock prices and supply of capital to corporations”, The Review of Economics and Statistics, Vol. 64, pp. 243-269.
Lintner J. (1956) “The distribution of incomes of corporations among dividends, retained earnings and taxes”, American Economic Review, Vol. 46, pp. 97-113.
Miller M. H and Modigliani F. (1961) “Dividend policy, growth and the valuation of shares”, The Journal of Business, Vol. 34, pp. 411-433.
Modigilani, F. (1982) “Debt, Dividend Policy, Inflation and Market Valuation” The Journal of Finance, 37, pp 225-275.
Parkinson m. (1980), “The extreme value method for estimating the variance of the rate of return”, Journal of Business, Vol. 53, pp. 61-65.
12
Petit R. R. (1972) “dividend announcements, security performance, and capital market efficiency”, Journal of Finance, Vol. 27, pp. 993-1007.
Ross S. A., Westerfield R. W., Jaffe J. and Jordan B. D., (2008), “Modern Financial Management” 8th edition. McGraw-Hill International.
Ross, S., Westerfeld, R., and Jaffe, J. (1996) “Corporate Finance” 4th Edition, Times Minor
Education Group, USA.
Walter J. E. (1963), “Dividend policy; its’ influence on the value of the enterprise”, Journal of Finance, Vol. 18, pp. 280-291.
13 Table 1. Summary statistics
Name of Variables Mean Standard Error Median Standard Deviation Sample
Variance Range Sum Observations Price-Volatility 0.2940 0.0167 0.2507 0.1843 0.0330 1.0948 36.1617 123 Dividend Yield 3.1197 0.1129 3.0950 1.2524 1.5685 7.264 383.721 123 Dividend Payout 0.4588 0.0148 0.4596 0.1639 0.0269 0.8118 56.4280 123 Size 3.2121 0.0562 3.1172 0.6235 0.3887 2.9838 395.0847 123 Earnings-Volatility 4.6874 0.0638 4.6580 0.7076 0.5008 3.2334 576.54483 123 Debt 0.1816 0.0116 0.1607 0.1287 0.0166 0.6307 22.3348 123 Growth 0.1609 0.0340 0.1108 0.3776 0.1426 4.2675 19.7868 123
14
Table 2. Cross-correlation between variables
PRICE
VOLATILITY
DY PAYOUT SIZE DEBT GROWTH E-VOL PRICE VOLATILITY 1 D-YIELD -0.2583*** 1 DIVIDEND PAYOUT -0.4446*** 0.6684*** 1 SIZE -0.1823** -0.0893 0.1743* 1 DEBT 0.1528* 0.2122** 0.1882** 0.0430 1 GROWTH -0.0087 -0.1997** 0.0367** 0.2049 -0.0719 1 E-VOL 0.1166 -0.0440 -0.0007*** 0.8631 0.0970 0.1626* 1
Price-Volatility= the annual range of stock prices divided by the average of the high and low prices obtained in the year raised to the second power.
Dividend Yield= dividend per share divided by price per share Dividend Payout= dividend per share divided by earnings per share Size= number of ordinary shares multiplied by price per share
Earnings-Volatility= standard deviation of earnings for the most recent preceding five years for each year.
Debt= ratio of long term debt to total assets
Growth= ratio of change in total assets at the end of the year to the level of total asset at the start of the year
Note: (***) indicates significance at the 1%level, (**) indicates significance at 5% level, and (*) indicates significance at 10% level
15
Table 3. The link between price volatility, dividend yield and dividend pay out ratio.
Coefficient T- statistics P-values
Intercept 0. 5154*** 11. 1003 0. 000
Dividend yield 0. 0103 0. 6406 0. 5230 Dividend Payout -0. 5529*** -4. 4798 0. 000 R2 = 0.2004 Adj. R2 = 0.1871, F-stat = 15.0386 F-prob= 0.000 The model used is: P-Volj = a1 +a2D-yieldj + a3Payoutj +ej
16
Table 4: The link between price volatility, dividend yield, dividend payout, size, earnings volatility and debt.
Coefficients t -stat P-value INTERCEPT 0.2131** 2.2338 0.0274 DIVIDEND YIELD -0.04016** -2.6083 0.0103 DIVIDEND PAYOUT -0.1246 -0.9946 0.3220 SIZE -0.3130*** -6.4265 0.0000 E-VOLATILITY 0.2607*** 6.3873 0.0000 DEBT 0.2577** 2.5447 0.0122
R2= 0.4569 Adj R2= 0.4337 F-Stat= 19.6880 F-prob = 0.0000
The model used is: P-Vol= a1 +a2D-yieldj + a3Payoutj + a4Sizej + a5 E-Volj + a6 Debtj + ej Note: (***) indicates significance at the 1%level, (**) indicates significance at 5% level
17
Table 5: The link between price volatility and dividend yield, size, earnings volatility, and debt.
Coefficients t-statistics P-value INTERCEPT 0.1870** 2.0387 0.0437 DIVIDEND YIELD -0.0515*** -4.9924 0.0000 SIZE -0.3405*** -8.4791 0.0000 E-VOLATILITY 0.2809*** 7.9329 0.0000 DEBT 0.2463** 2.4477 0.0158
R2= 0.4523 Adj R2= 0.4338 F-Stat= 24.365 F-prob = 0.0000 The model used is: P-Vol= a1 +a2D-yieldj + a3Sizej + a4 E-Volj + a5 Debtj + ej
18
Table 6: The link between price volatility and dividend payout, size, earnings volatility, and debt.
Coefficients t -Stat P-value
INTERCEPT 0.2070** 2.1187 0.03622 DIVIDEND PAYOUT -0.3671*** -4.2676 0.0001 SIZE -0.2536*** -5.7509 0.0000 E-VOLATILITY 0.2189*** 5.6930 0.0000 DEBT 0.2429** 2.3449 0.0207
R2= 0.4253 Adj R2= 0.4059 F-Stat= 21.8352 F-prob = 0.0000 The model used is: P-Vol= a1 + a2Payoutj + a3Sizej + a4 E-Volj + a5 Debtj + ej
19
Table 7: The link between price volatility, dividend yield, dividend payout, size and debt.
Coefficients t Stat P-value
Intercept 0.5812*** 6.6095 0.0000 DIVIDEND YIELD -0.0015* -0.0922 0.9267 DIVIDEND PAYOUT -0.5225*** -4.1577 0.0006 SIZE -0.0333 -1.3514 0.1792 DEBT 0.3541*** 3.0574 0.0028
R2= 0.2676 Adj R2= 0.2427 F-Stat= 10.7762 F-prob = 0.0000 The model used is: P-Vol= a1 +a2D-yieldj + a3Payoutj + a4Sizej + a5Debtj + ej
Note: (***) indicates significance at the 1%level, (**) indicates significance at 5% level, and (*) indicates significance at 10% level
20
Table 8: The link between price volatility and dividend payout, earnings volatility, and debt.
Coefficients t Stat P-value
INTERCEPT 0.3641*** 3.3996 0.0009 DIVIDEND YIELD 0.0061 0.3888 0.6981 DIVIDEND PAYOUT -0.5803*** -4.8517 0.0000 E-VOL 0.0249 1.2024 0.2316 DEBT 0.3320*** 2.8484 0.0052
R2= 0.2652 Adj R2= 0.2403 F-Stat= 10.6484 F-prob = 0.0000 The model used is: P-Vol= a1 +a2D-yieldj + a3Payoutj + a4 E-Volj + a5 Debtj + ej Note: (***) indicates significance at the 1%level
21
Table 9: The link between price volatility, dividend yield, dividend payout, size, debt, growth and industry dummy.
Coefficients t -Stat P-value
INTERCEPT 0.5758*** 6.4281 0.0000 DIVIDEND YIELD 0.0023 0.1362 0.8919 DIVIDEND PAYOUT -0.5491*** -4.1689 0.0005 SIZE -0.0350 -1.3971 0.1651 DEBT 0.3505*** 2.9664 0.0037 GROWTH 0.0258 0.6301 0.5299 DUMMY 0.0125 0.4071 0.6847
R2= 0.2771 Adj R2= 0.2334 F-Stat= 7.1906 F-prob = 0.0000 P-Vol= a1 +a2D-yieldj + a3Payoutj + a4Sizej + a5 Earningsj + a6Debtj + a7Dum2 + ej Note: (***) indicates significance at the 1%level.