DOCUMENT RESUME
ED 403 274 TM 025 948
AUTHOR Grandy, Jerilee
TITLE Talent Flow from Undergraduate to Graduate School:
1982-1993.
INSTITUTION Educational Testing Service, Princeton, N.J.; Graduate Record Examinations Board, Princeton,
N.J.
REPORT NO ETS-RR-95-36; GRE-PR-92-02P
PUB DATE Dec 95
NOTE 147p.
PUB TYPE Reports Evaluative/Feasibility (142) EDRS PRICE MF01/PC06 Plus Postage.
DESCRIPTORS *Career Choice; *Databases; Degrees (Academic);
Employment Patterns; Ethnic Groups; *Graduate Students; Graduate Study; Higher Education; Intellectual Disciplines; Majors (Students); Sex Differences; Specialization; *Talent; Test
Construction; Test Validity; *Undergraduate
Students
IDENTIFIERS *Graduate Record Examinations
ABSTRACT
This report describes the early development, recent revision, and some uses of a special Graduate Record Examinations
(GRE) database for studying talent flow between undergraduate and
graduate school. It discusses the following: (1) development and
expansion of a talent flow database containing all variables from the
GRE General Test files on all examinees between 1982 and 1993; (2)
availability of the database to other researchers; (3) analyses of
the database to highlight talent flow patterns; (4) designs of
graphic displays that are useful to illustrate talent flow; and (5) suggestions for future uses of the database, including a new approach to studying test validity. This report contains summary statistics for all broad fields of study for each gender and for all ethnic groups and includes trends in the numbers and percentages of examinees planning graduate study in each area and the academic
qualities of those examinees. Talent flow analyses indicated that the fields with the greatest holding power appear to coincide with the fields having the fewest examinees seeking a doctorate. This
observation suggests that at a time of limited employment
opportunities for Ph.D.s, students are attracted to fields that require only a master's degree and gravitate toward those fields for graduate study. Seven appendixes contain major field codes and categories, definitions, the dataset layout, and sample talent flow tables. (Contains 26 figures, 44 appendix tables, and 19 references.
(SLD)
*********************************************************************** Reproductions supplied by EDRS are the best that can be made
from the original document. *
RESEARCH
U S DEPARTMENT OF EDUCATION
Office Educational Research and Improvement
EDU TIONAL RESOURCESINFORMATION CENTER (ERIC)
This document has been reproducedas received from the person or organization originating it
Minor changes have been made to improve reproduction quality Points of view or opinions stated in this document do not necessarily represent official OERI position or policy
di a I I. a a I
0
11
II I:I.
. e i II . R A A I la I CI
0a
0
11
PERMISSION TO REPRODUCE AND DISSEMINATE THIS MATERIAL
HAS BEEN GRANTED BY
1,,eriult)
TO THE EDUCATIONAL RESOURCES INFORMATION CENTER (ERIC)
I
Talent Flow from Undergraduate
to Graduate School: 1982-1993
Jeri lee Grandy
GRE Board Report No. 92-02P
December 1995
This report presents the findings of a research project funded by and carried out under the auspices of the Graduate
Record Examinations Board.
Educational Testing Service, Princeton, NJ 08541
********************
Researchers are encouraged to express freely their professional judgment. Therefore, points of view or opinions stated in Graduate Record Examinations Board Reports do not necessarily represent official
Graduate Record Examinations Board position or policy.
********************
The Graduate Record Examinations Board and Educational Testing Service are dedicated to the principle of equal opportunity, and their programs,
services, and employment policies are guided by that principle.
EDUCATIONAL TESTING SERVICE, ETS, the ETS logo, GRADUATE RECORD EXAMINATIONS,
and GRE are registered trademarks of Educational Testing Service.
Contents
Page
Introduction 1
Background 1
Overview 1
Studies of Talent Flow 2
GRE Talent Flow Database 3
Database Revision 4
Additional Years 4
Additional Variables 5
Additional Examinees 6
Recoding of Major Fields 7
Availability of the Revised Database 8
Research Questions 8
Analysis of the GRE Talent Flow Database for U. S. Citizens 9
Trends by Intended Area of Graduate Study 9
Areas of Study 9 Academic Qualities 11 Gender 15 Ethnic Group 18 Age 18 Degree Objectives 18 Undergraduate Composition 22
Changes in Field of Study 25
Differences between Examinees Who Change Fields and
Those Who Do Not 30
Patterns of Change for Each Academic Area 31
Arts and Humanities 31
Mathematics, Physical Sciences, and Computer Sciences 34
Engineering 36
Biological Sciences 40
Social Sciences 43
Health Sciences and Services 46
Education 48
Contents (continued)
Page
Use of the Database to Describe Specific Fields of Study 53
Graduate Field Selections of Psychology Majors 54
Undergraduate Programs of Examinees Planning to
Enter Veterinary Medicine 56
Gender Balance of Biology Majors Choosing Specific
Graduate Fields of Study 56
Further Use of the Database 59
References 61
Appendix A: Major Field Code List for 1987 Appendix B: Major Field Code List for 1989
Appendix C: Major Field Category Transformations, 1978-87
Appendix D: Major Field Category Transformations, 1988-93
Appendix E: Broad Major Field Definitions Appendix F: Dataset Layout
Acknowledgments
The author is grateful to two lead data analysts who constructed the database and designed
printouts of tables.
Nancy Robertson, who created and documented the earlier database, also constructed the
revised version reported here. Because of her patience and persistence at a very lengthy and tedious
task, she was able to turn 12 years' worth of GRE files into awell organized, standardized, and
documented database that will be useful to researchers fomany years to come.
Jennifer Nelson, with her talent for designing readable and attractive tables on the mainframe
computer, constructed more than 1,000 pages of easy-to-read tables presenting numerous statistics on
talent flow. Thanks to her thoughtful approach to the project, she can easily modify her programs for
special applications to produce new tables with different variables and subgroups of examinees.
Finally, I am especially indebted to Maria Pennock-Roman for her verycareful and detailed
line-by-line and number-by-number review of this manuscript, and to Kenneth Wilson for his many
Abstract
This report describes the early development, recent revision, and some uses of a special
Graduate Record Examinations (GRE) database for studying talent flow between undergraduate and
graduate school. More specifically, it discusses the following: (1) development and expansion of a
talent flow data base containing all variables from the GRE General Test files on all, examinees
between 1982 and 1993; (2) availability of the database to other researchers; (3) analyses of the database to highlight talent flow patterns; (4) designs of graphic displays that are useful to illustrate talent flow; and (5) suggestions for future uses of the database, including a new approach to studying
test validity.
Variables in the database include all questions asked on the GRE background questionnaire in
addition to GRE scores. Those variables include undergraduate major, intended area of graduate study, gender, ethnicity, birth date, educational level, father's and mother's education, citizenship
status, year of bachelor's degree, some institutional information, grade-point averages, undergraduate courses, honors and other achievements, activities, GRE scores, graduate degree objective, and an
indicator of whether they changed majors from undergraduate to graduate school. The database was constructed so that its format and coding are as comparable as possible across all 12 years, in spite of radical changes made in the background questionnaire during that period. Several formats of the
database are available to researchers upon request.
The report includes summary statistics for all broad fields of study--for each gender and all
ethnic groups--including trends in the numbers and percentages of examinees planning graduate study in each area and the academic qualities of those examinees.
Talent-flow analyses examined the holding power of each broad field of study. Those fields with the greatest holding power appeared to coincide with the fields having the fewest number of examinees seeking a doctorate. This observation suggests that in a time when there are very limited employment opportunities for Ph.D.s, students are attracted to fields requiring only a master's degree, such as allied health professions, and will gravitate toward those fields for graduate school and away from fields such as humanities. For examinees changing fields, we were also able to identify fairly consistent patterns associating test scores with chosen field of graduate study. For example, education majors with relatively high verbal scores switch to humanities, and education majors with relatively high quantitative scores switch to physical sciences. Such patterns also suggest an entirely new way of
looking at test validity.
Analyses are quite detailed, focusing on each broad field of study and some specific fields, and on each gender and ethnic group. Some graphic methods are developed to illustrate the
complexities of talent flow. Finally, the report suggests other ways in which the database may be used
Introduction
This report describes the early development, recent revision, and some of the uses of a special GRE database for studying talent flow between undergraduate and graduate school. More specifically,
it discusses the following:
development and expansion of a talent flowdata base, and its
availability to other researchers
analysis of the database to highlight talent flow patterns
designs of graphic displays that are useful to illustrate talent flow suggestions for future uses of the database, including a new approach
to studying test validity
Background
Overview
In a recently completed GRE project, Grandy and Robertson (1992) produced a special GRE database for studying talent flow. This set of files has provided easy and relatively inexpensive access to information especially relevant to talent flow from undergraduate to graduate school among all U.S.
citizens taking the GRE General Test and specifying an intended field of graduate study. The database covers the 10-year period from 1978 to 1987 and includes all information thought to be important to
the study of talent flow: undergraduate major field, mean test scores, grade-point averages, parents'
education, age, and many other kinds of data that students provide on the GRE background
questionnaire.'
To keep the file current, it should be extended every five years or so. In this project, we not only extended the database, but completely redesigned it to include all test takers (not just U.S. citizens), and essentially all variables in the GRE files. Most importantly, we recoded all major field
designations to be as comparable as possible across all years, despite extensive changes that occurred
in the wording and format of the background questionnaire. The revised database contains the
anonymous records of all GRE test takers from 1982 through 1993.2
'Throughout this report we have identified an academic year by the later half of that year. For example, 1981 data refers to the data collected during the academic year 1980-81.
2Because GRE history files earlier than 1982 were not retained, the new talent flow database does not contain records prior to 1982. The revised database, therefore, begins with 1982 and includes 12 consecutive years of data.
Studies of Talent Flow
In recent years, ETS has conducted a number of studies of talent flow using a variety of databases. A study by Hilton and Schrader (1987) entitled "Pathways to Graduate School" analyzed the National Longitudinal Study (NLS) database, beginning with high school seniors in 1972. This database now contains additional follow-up information collected in 1973, 1974, 1976, 1979, and
1986.
Subsequently, Hilton and Pollack (1989) received GRE funding to study talent flow in the 1980 High School and Beyond (HS&B) database. Their study, which compared the HS&B database
with the National Longitudinal Study (NLS) database, showed substantial declines in the percentages
of Black males who completed undergraduate school, and particularly in the percentages of high-ability Black males who did so. These declines were seen as troubling and are the subject of yet another study, this one funded by NSF and conducted by Hilton, Hsia, Solorzano, and Benton (1989). This longitudinal survey followed a sample of minority students who earned high mathematics scores on the Scholastic Aptitude Test (SAT) in 1984-85 and who intended to major in science or
engineering to determine what environmental factors might be associated with persistence through the
next five years. Grandy (1994a) is currently conducting a path analysis of the same data.
In response to a request from the National Science Foundation, Grandy produced a matched file containing the complete records of nearly half a million test takers who took the SAT between
1980 and 1986 and all GRE tests between 1985 and 1989. This is the largest matched SAT/GRE file ever created, containing information about students' undergraduate institutions as well as data about individual students. The NSF has used the data to predict the "effect" of institutional type on student outcomes, controlling on individual student data. This database is maintained by Educational Testing
Service (ETS) for ongoing research.
One researcher currently examining this database is Pennock-Roman. In a study funded by the NSF, she is conducting a longitudinal analysis of persistence in science majors. Her study differs from previous analyses in several ways. She has limited her investigation to students who are
contemporary with participants in the 1980 High School and Beyond study. She has included resident aliens in her analyses, and she has added variables related to the undergraduate schools that they attended from the Annual Survey of Colleges. She has also used the choice of undergraduate major specified in the SAT file to study the transition from high school intention to actual undergraduate major.
In another study, funded by the Sloan Foundation, Pennock-Roman is using the same database and addressing the same persistence issues. Rather than a descriptive study, however, she is
developing a predictive model using logistic regression with random effects to evaluate the relative strength of student variables (such as test scores and math/science courses taken in high school) and university variables (such as level of competition, research status, and private versus public status) to
predict persistence.
In August 1987, Kuh proposed a framework for the study of talent flow to graduate education (Kuh, 1987). She contended that an awareness of the supply of graduate-educated workers is
important to government, to industry, and to academia. Among possible research studies she suggested the exploration of early indicators of interest in graduate school through a matched
SAT database, studies of the effects of labor market and noneconomic factors on choices
of
undergraduate and graduate major, and studies of both foreign talent flow and minority talent flow.Since that time, the GRE Board has funded a number of talent flow studies. Grandy (1992)
conducted a survey of GRE examinees earning bachelor's degrees in mathematics, natural sciences,
and engineering to understand better the factors involved in student choice of field for graduate work. This study identified a number of student characteristics, based on the survey questionnaire and the
GRE background questionnaire, that contrast students persisting in science and engineering from those
switching to other fields. Further analysis of the data also provided information on gender and ethnic
differences among the fully committed science and engineering students, namely, those planning to continue in science and engineering (Grandy, 1994b).
One special group of students who have come to the attention of educators is older students.
Since the 1970s, increasing numbers of people have been attending college and graduate school after
spending time in the workforce or raising a family. As a result, colleges have steadily gained more older students who bring to the campus their own special life experiences and, often, different interests
and needs than those of traditional students. In 1976, nearly half of the people who took theGRE
General Test were under 23 years of age, and only 15% were over age 30 (Hartle, Baratz, & Clark, 1983). Five years later, the number under 23 had dropped to 39%, and the number over age 30 had risen to 21% (Clark, 1984).
Concern has risen in recent years over the effects of the increasing number of adult students
on the talent pools of various disciplines. The GRE Board recently funded a survey of science and
engineering graduates who have been out of college at least five years and who are now planning graduate study (Grandy, in progress). Results of that survey are being used to create a model whereby employment experiences and background information contained in the GRE files may be used to predict who will continue in science and engineering and who will abandon these fields for new
academic disciplines leading to possible career changes.
Because of the numerous uses of the GRE files for studying talent flow, the GRE Board, in 1986, funded the creation of a special talent flow database to be used for that purpose (Grandy, 1992). The details of that work are described below.
GRE Talent Flow Database
In recent years, researchers and policy makers have come to recognize the annually produced
GRE files as valuable sources for studies of talent flow between undergraduate and graduate school.
When test takers register to take the GRE, they complete a background questionnaire that asks, among other things, their undergraduate major field and their intended field of graduate study. With this information, along with subsequent test scores, grades, parents' education, age, gender, ethnic group, citizenship, and other variables, we are able to examine patterns that relate major field choices, and
changes in those choices, to background data and academic ability.
Before the construction of this database, studies using the GRE files were costly becauseof the
length and complexity of the files and because of the careful and tedious programming that had to be
done to accommodate the coding changes that took place as the questionnaire was revised overthe
3
years. It became clear that if we were planning to conduct further talent flow studies using the GRE
data, we would need a database designed especially for that purpose.
In 1986, the GRE Board funded a project to create a special database that has since provided inexpensive, easy access to GRE data for talent flow studies. Results are reported in Grandy and
Robertson (1992).
The first major step in that project was to recode the major fields so that each code designated the same field every year from 1978 to 1987 (excluding 19793). We then selected from the GRE
General Test files just those variables judged to be pertinent to talent flow studies. The database itself was built to contain records of all U.S. citizens who registered to take the GRE between academic
year 1977-78 and 1986-87. It consists of three different structures: (1) a short individual examinee
file in which one record exists for each test taker; (2) a square matrix in which cells contain useful
statistics for various combinations of detailed undergraduate and graduate majors; and (3) a square matrix containing statistics for combinations of broad categories of undergraduate and graduate majors.
The database, in the first format, remains on computer files for public use. The other two formats are on hard copy for rapid lookup. Detailed documentation on the content, format, and use of
the database is reported by Robertson (1993).
Database Revision
In 1992, a major revision of the database was undertaken. The revision included the following changes:
addition of six more years of data
inclusion of ALL variables contained in the GRE files, from 1982
through 1993
inclusion of ALL examinees in the GRE files
extensive recoding and standardization of major fields
Additional Years
Unless trend statistics include current data, they are of historical interest only. The primary purpose of this project, therefore, was to update the talent flow database to include six more years' data, from 1988 to 1993. In constructing the revised database, it was necessary to retrieve all files
from the original GRE files rather than simply to append the existing database (as described in greater
detail below). Unfortunately, data from 1978 through 1981 had to be omitted from the revised
flow.
'The 1979 history files contain errors in major field codes, thus precluding accurate analyses of talent
database because the original files for those years had not been retained. Therefore, the revised database contains all data from 1982 through 1993.
Additional Variables
Besides the need to make the database more current, our experience thus far had indicatedthat
there were considerably more talent flow questions worth exploring if weincluded more questions
from the GRE file. For example, whether or not examinees had books or articles published and
whether they had been elected to national honor societies could provide further indicationsof
academic excellence beyond GRE scores and grades. We found in our survey of science students
(Grandy, 1992) that publications combined with other indicators of high verbal skill were associated with leaving the sciences.
Whether examinees are applying for financial aid, and whether they will be dependent on
financial aid for graduate school may be two important questions bearing on the relationship of the
economy to the decision to enroll in graduate school. We found that among prospective divinity
students, for example, half of the women and 36% of the men indicated that their graduate school
attendance would be dependent upon receiving financial aid (Grandy and Greiner, 1990). Talent flow studies could investigate the degree to which financial pressures differentially affect men and women
in their selection of fields of study. Because we could not anticipate what variables might be useful in future studies, we decided to include all GRE variables in the revised talent flow database.
Not all background questions were asked every year, and some response categories were
modified in their wording or increased in number. The following variables, though not necessarily
available for all years, are in the revised database: Test year
Gender
Birth date
Educational level at time of registration Country of birth
Size of undergraduate institution Type of undergraduate institution Undergraduate major field Intended graduate field of study Type of graduate institution desired Year of last graduate school attendance Highest education of father
Highest education of mother Family income
High school location U.S. citizenship status Country of citizenship
State or province Ethnicity
Disability
Reasons for taking the GRE General Test Reasons for taking a GRE Subject Test
5
Whether planning full-time or part-time study Educational level
Year of bachelor's degree Graduate degree objective
Overall undergraduate grade-point average
Number of undergraduate courses in each of 28 fields Whether communicate best in English
Whether English is the dominant language in the household Native language
Whether had a book or article published Whether were elected to an honor society Whether planned to apply for financial aid Whether enrollment depends on financial aid Preparation for the General Test
Preparation for the Subject Test
Preferred geographic region for graduate school GPA in undergraduate major
GPA for the last two years of college Hours per week worked for pay Hours per week of community service Most important honors received TOEFL score (self-reported)
Whether applied for national fellowship Full-time work or military experience GRE verbal score
GRE quantitative score GRE analytical score
Recoded undergraduate major field Recoded graduate field
Recoded broad undergraduate major field area Recoded broad graduate field area
Indicator of change from undergraduate to graduate broad field
Because the primary reason for creating the database was to study talent flow, that is, the change in field of study between undergraduate and graduate school, we created a "change" variable
and added it to each record. Examinees planning to move from one broad field to another were coded
"1" for changing. Those intending to continue in the same broad field were coded "0." Someone changing from chemistry to political science, for example, was given a change code of 1. On the other hand, someone changing from chemistry to biochemistry was given a "0" because the change did not require a move from physical sciences--one of the broad fields of study. By incorporating this variable into the database, statistics based on change could be easily computed.
Additional Examinees
The previous form of the database included only U.S. citizens. Because of the growing number of international students taking the GRE, it seemed appropriate to include these examinees as well, in the event that future studies of talent flow among noncitizens, particularly resident aliens, might be requested. Furthermore, we included even those examinees who did not specify intended
fields of study, thus permitting future study of examinees who may be uncertain about their graduate
school plans.
If an examinee took a test more than once in the same year, only the first record was included in the new database. Therefore, the database includes all of the examinees who are in the original GRE files, but not all of the records in those files.
Recoding of Major Fields
Adding six years of data and producing further statistics might have been a simple process if
the GRE background questionnaire had not been completely revised for the 1987-88 academic year.
The new list of major fields, in fact, bore little resemblance to the earlier list. Appendix A contains the major field list for 1986-87; appendix B shows the list for 1988-89. It is clear from visual comparison that achieving comparability was not an easy task, and many questioned whether it was
possible. Furthermore, there were minor changes from year to year, with only a few fields being
eliminated and others added.
Major fields listed after 1987 were not just more specific than those listed earlier. Otherwise,
translation would simply have been a matter of collapsing the later field descriptions into the earlier ones. Some were actually broader. Some fields were totally eliminated. Some interdisciplinary fields
were added. Recoding was not a simple matter, nor is the result completely satisfactory.
After some unsatisfactory attempts at translating the pre-and-post-1988 codes, we devised an
intermediary set of 86 detailed codes (plus an 87th code for missing response). Appendix C shows, year by year, the transformations from the 1978-1987 codes to the new detailed codes. Footnotes
indicate those fields that are not completely comparable throughout the 12-year period.
The codes used in the 1988-1993 GRE background questionnaire were also translated into the 87 new detailed codes. Results of that translation are in Appendix D. Thus, the 87 codes became a
link between the pre-and-post-1988 codes defined in the GRE files.
Throughout this report, we refer to this set of 87 major fields (86 fields plus "missing") as detailed fields of study. For many applications, only broad fields of study are necessary. The broad
fields discussed in this report are as follows:
arts and humanities (which includes history)
mathematics, physical sciences, and computer sciences° engineering
biological sciences
social sciences (which includes psychology) health sciences and services
education business
all other fields
4Throughout this report, the category of mathematics, physical sciences, and computer science is sometimes referred to as "math/science" for simplicity.
7
Appendix E defines each of these broad fields in terms of the 87 detailed revised major field codes. In the revised database, the old major field codes are retained with the new. Missing data fields indicate that either that question was not asked that year, or the test taker omitted the question.
Availability of the Revised Database
The revised database, because it is quite large, is available for analysis on the ETS mainframe computer. Appendix F contains the data set layout.
Other formats of the database are available in hard copy or on floppy disk, all consisting of extensive summary statistics. These tables can be obtained on request, either as hard copy or as downloaded ASCII files on floppy disk. At present, they have been computed only for U.S. citizens, but tables for international examinees can be computed quite easily.
Currently there are several formats of these tabular files consisting of trends and of square matrices, for broad and detailed majors. Because they consist of about 1,500 pages, they have not been published. Samples of these tables are included in Appendix G. Additional tables that are of interest to the reader are available upon request from the author, as hard copy or on floppy disk.
Research Questions
Based on the revised database, we investigated a number of research questions pertaining to
talent flow among GRE examinees:
Which broad fields of study have shown the greatest increases and declines in selection as graduate majors? Which specific fields, within the broad fields, have contributed most significantly to those trends?
Has there been a change in the academic quality of candidates planning graduate study in some areas? Do some areas attract lower or higher scoring candidates than those areas did in the past?
What changes have occurred in the gender, ethnic, and age distributions of candidates planning graduate study in each broad area and in selected specific fields? Which fields have been attracting the most rapidly increasing numbers of female, minority, or
older candidates?
Has the growth or decline in candidates with doctoral intent paralleled the growth or decline intending to earn less than a doctorate? Are there some fields in which greater proportions of candidates are seeking doctorates instead of master's degrees?
Which fields have the greatest and the least holding power? Have any fields gained or lost holding power over the past 12 years?
Which undergraduate majors fields most frequently serve as feeders to specific graduate fields?
Which graduate fields attract the greatest number of people from different
undergraduate fields? Among those graduate fields attracting large numbers of people from other areas, which areas are the primary feeders, and have the numbers changed much over the past 12 years?
Is the decision to change fields between undergraduate and graduate school associated
with age, time since earning a bachelor's degree, gender, ethnic group, test scores, or
undergraduate grades?
Among examinees with a bachelor's degree in a specified field, what variables are
associated with their choice of graduate field?
Are the answers to these questions different for examinees planning to earn a doctorate than for examinees with less than doctoral intent? Do some patterns hold for one gender and not the other or for one ethnic group and not another?
The remainder of this report will explore answers to these questions. The first few analyses will look at general trends among GRE test takers to provide a context for the remaining analyses, which will examine specific talent flow questions. Numbers may differ somewhat from those published elsewhere. Discrepancies should be minor and are due to differences in the selection
procedures used to sample examinee data from the GRE files.
Analysis of the GRE Talent Flow Database for U.S. Citizens
There has been an overall increase in the number of U.S. citizens taking the GRE General Test
over the 12-year period studied. Between the first two years--1982 and 1983--there was a slight
decline, and between the last two years--1992 and 1993--there was a similar decline. But for the
10-year period from 1983 to 1992, numbers rose steadily, from 156,336 to 291,080. Thisincrease
amounted to an 86% gain in GRE candidate volume among U.S. citizens taking the General Test.
Trends by Intended Area of Graduate Study
Areas of Study. Essentially all broad areas of graduate study showed gains during this period, though
some showed markedly greater gains than others. Figure 1 shows trends inthe selection of eight
broad areas of graduate study. The social sciences held the highest volume throughout the period studied, fluctuating between a high of 18.0% the test-taking population in 1982 to 14.8% in 1988.
Business consistently attracted the fewest examinees, the highest number (in 1988) composing only
2.4% of the test-taking population. This is not surprising because business students typically take the
Graduate Management Admission Test (GMAT) for admission to business school. The population of
business students taking the GRE, therefore, is not only small but probably atypical.
9
60
Figure 1
Trends in the Selection of Eight
Broad Areas of Graduate Study
Number (Thousands)
50 -
40 -
30
20 -
10-
0
SOCIAL SCIENCES...
...
--- ---EDUCATION ---ARTS/HUMAN. ---HEALTH SCI. ---BIOL. SCI. ENGINEERING ________________________ -- ---MATH/PHYS. SCI. BUSINESS---82
83
84
85
86
87
88
89
90
9192
93
Year
ALL U.S. CITIZENS TAKING THE GRE
The following table shows, in the first column, the percentage increases (rank ordered from
high to low) in each area of intended graduate study between 1983 and 1992--the 10-year period
during which overall growth increased steadily. The second and third columnsshow the percentages
of the GRE population, in 1983 and 1992, choosing each area of graduate study.
Area of Intended Graduate Study'
Percent Increase in Numbers Percent of GRE Population 1983 1992 Education 115.5% 12.3% 14.2% Business 93.8% 1.6% 1.7% Engineering 89.8% 6.0% 6.2%
All other fields 89.6% 11.0% 11.2%
Health sciences and services 86.3% 11.1% 11.1%
Arts and humanities 83.2% 10.9% 10.8%
Social sciences 80.9% 17.3% 16.8%
Biological sciences 32.5% 8.2% 5.8%
Mathematics, physical and computer sciences 3.0% 9.1% 5.1%
Most striking, perhaps, is the negligible growth in the category of mathematics, physical
sciences, and computer sciences. In fact, because the total number of test takers increased 86%during
this period, the proportion of examinee volume made up of people in mathematics, physical sciences,
and computer sciences declined from 9.1% in 1983 to 5.1% in 1992. The proportion in biological sciences showed a similar decline, from 8.2% in 1983 to 5.8% in 1992. Outstanding too is the number planning graduate work in education, a number that more than doubled. The apparently large
increase in business students is somewhat misleading because the actual proportion of the GRE
population choosing business is quite small. Consequently, a small increase in absolute numbers can
appear as a large percentage increase. Most fields, other than education and natural sciences, showed
increases approximately equal to the average gain for the GRE population.
Which fields within the sciences and within education might have contributed the greatest
weight to their trends? In the case of mathematics, physical sciences, and computer sciences, there
were declines in the actual numbers planning to study computer science and geology. These declines
were offset by increases in the numbers planning to study mathematics and physics. The number
choosing chemistry remained about the same. Thus, the average over all fields in this area showed practically no change. In the area of education, large increases occurred in all fields except physical education. The fields included all teaching areas and educational administration.
Academic Qualities. It is sometimes said that as the number of applicants to a field increases, overall
student quality. declines. Studies relating number of test takers with mean test scores show that this relationship does not hold true in general (Adelman, 1985; Grandy & Robertson, 1992).
The GRE database contains a number of questions directly or indirectly related to academic
quality. Three of these are test scores; another is grade-point average (GPA) in undergraduatemajor.
In our analyses of test scores, we have discussed verbal and quantitative scores only,although all
sThe number of examinees who did not specify an intended field of graduate study also increased 158% (from 19,348 to 49,977) between 1983 and 1992.
11
statistics have been computed on analytical scores. The reason for not including analytical score
statistics was that in every case considered, analytical scores lay somewhere between verbal and quantitative scores, and contributed nothing to the analyses.
Trends in GRE verbal score averages showed a small increase from 500 to 509 between 1982 and 1989, followed by a sharp decline to 496 in 1993. Trends for each broad major field showed a similar rise-and-fall pattern, with some variations. See Figure 2. The number of examinees planning graduate work in education and in arts and humanities increased the most. Mean scores among those in education rose from their lowest point in 1982 to their highest in 1988--an increase of 19 points. Since that time they dropped 12 points, but still maintain an overall upward trend over the 12-year period. Education also showed the greatest increase in numbers of examinees. We might conclude that, at least through 1988, education was attracting greater numbers of students with high verbal
ability. Whether the decline in verbal scores after 1988 is indicative of another trend away from
education remains to be seen.
Examinees planning graduate work in arts and humanities not only have maintained the highest verbal score averages, but have also shown large increases in those averages. Their average rose 32 points between 1982 and 1990, when it peaked at 569.
Health sciences and services is the only area that showed a decline in verbal scores, from a mean of 491 in 1982 to a mean of 466 in 1993. Examination of the specific fields that make up health sciences and services cannot easily explain this score decline. Essentially all fields in this
area-nursing, physical therapy, veterinary medicine, speech pathology, public health--showed some decline.
Later in this report we will examine changes in these constituent fields more closely.
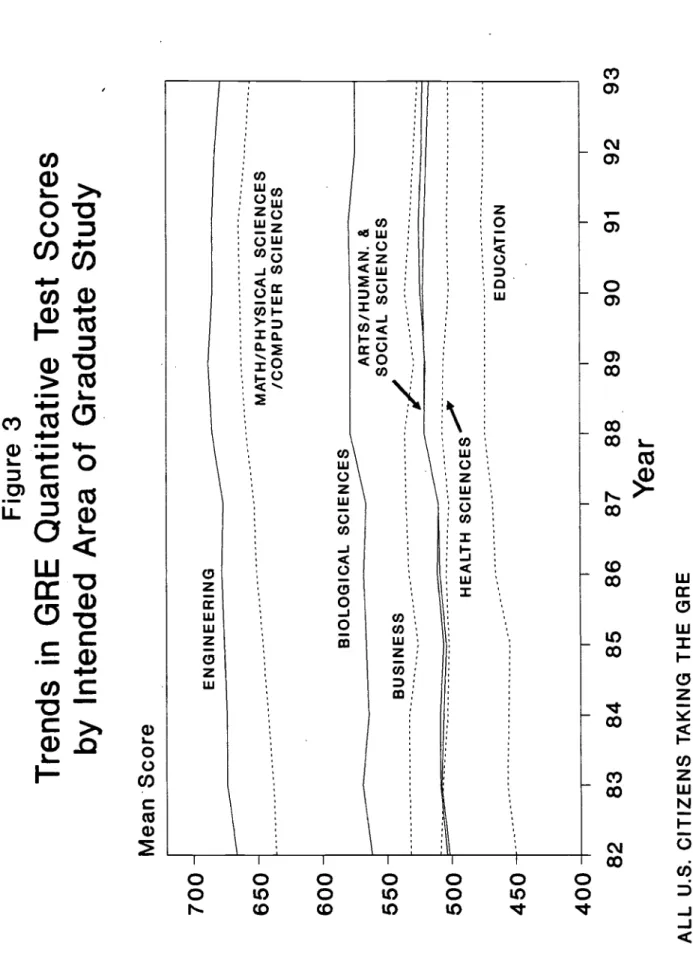
Quantitative score averages showed increasing trends for examinees planning graduate study in
engineering, math/physical sciences/computer sciences, and education. Those in other fields remained about the same, or showed random fluctuations, over the 12-year period. See Figure 3.
Analytical scores increased markedly, but because the test was changed during this period, it is questionable whether trends should be interpreted. For any particular year, comparisons of analytical
score means may prove useful.
Although average test scores have increased for examinees planning graduate work in nearly
all areas of study, those averages maintained approximately the same rank ordering. Examinees with the highest verbal scores were most likely to be in arts and humanities, second highest were in mathematics, physical sciences, and computer sciences. Those with the lowest verbal scores were most likely to be in education; second lowest were business and health sciences and services. In the middle, and of about equal rank ordering were those in engineering, social sciences, and biological sciences. Of course, there are large variances in test scores within each of these groups.
Average quantitative scores differed more from group to group than did verbal score averages. The range of mean verbal scores was contained within about 100 points. Mean quantitative scores ranged over 200 points, from about 450 for examinees in education to about 670 for examinees in engineering. There was considerable variation within groups, partly because the groups were defined so broadly. For example, in 1993, examinees in physics scored 704 on average (much higher than the average for engineers), and examinees in geology earned average scores of only 602, yet physics and geology are in the same broad major field category. These variations should be kept in mind when
600
Figure 2
Trends in GRE Verbal Test Scores
by Intended Area of
Graduate Study
Mean Score
550 -
500
-ARTS/HUMANITIES --- ---_ENGINEERING HEALTH SCI./SERV. ---11/4BUSINESS450
- ---EDUCATION400
MAT -- ----SCIENCES ---- - ---SOCIAL SCIENCES82
I I I I I83
84
85
86
87
88
89
90
91Year
ALL U.S. CITIZENS TAKING THE GRE
22
92
Figure 3
Trends in GRE Quantitative Test Scores
by Intended Area of
Graduate Study
Mean Score
700 -
650 -
600 -
550
-ENGINEERING...
BIOLOGICAL SCIENCES MATH/PHYSICAL SCIENCES /COMPUTER SCIENCES ARTS/HUMAN. & SOCIAL SCIENCES --- --- --- -BUSINESS500
---HEALTH SCIENCES ----450
- ---EDUCATION400
82
83
84
85
86
87
88
89
90
9192
93
Year
ALL U.S. CITIZENS TAKING THE GRE
comparing test scores and other characteristics of examinees across these various areas of graduate
study. Nevertheless, as we will see later in this report, examinee choice of a graduate area of study
appears to depend, at least in some part, on relative verbaland quantitative abilities.
GPA in major, for examinees in all areas of study, increased over the 12-year period. It is difficult to know whether trends in GPA are meaningful because an increasing trend may indicate
grade inflation. Comparisons across major field groups may indicate more lenient grading practices in
some disciplines than in others. Within a discipline, however, we may expect to find a greater
tendency for examinees with lower than average grades in their major to switch fields for graduate school. Later in this report we will explore this possibility.
Gender. Between 1982 and 1993, the percentage of females planning graduate study in almost every area increased a very small amount (Figure 4). Overall, the number of female test takers rose from 56% to 60% of the examinee population. Though this is an increase of only 4 percentage points,
growth was continuous from year to year.
Not every area of study showed the same degree of growth. In education, for example, there was essentially no change in gender composition. Three of the four fields in which the female share
increased the most were fields already dominated by females, namely, health sciences and services
(from 74% to 79%), social sciences (from 58% to 63%), and arts and humanities (from 51% to 55%). The proportion of female examinees planning to study business (a field in which males outnumber females 3 to 2) showed the greatest increase, from 41% to 47%.
In the scientific fields traditionally dominated by males, growth in the percentages of females
was very small or negligible. In mathematics, physical sciences, and computer sciences, the
proportion of female examinees increased by only 1 percentage point (from 30% to 31%). In engineering, there was a 2% increase (from 17% to 19%). In the biological sciences, in which females may no longer be regarded as underrepresented, there was only 1 percentage point increase
(from 51% to 52%).
These figures are not entirely consistent with the interpretation of graduate enrollment statistics
that suggest a considerable increase in the participation of women in science and engineering (National
Science Board, 1991). We have taken one example for comparison to see the extent to which GRE data may parallel actual enrollment data and to explore a possible discrepancy between the two. We have chosen the most underrepresented field, engineering, for the Comparison. The following table displays statistics from the GRE file for 1982 and 1989.6 Published first-year full-time enrollment statistics apply to the following years, 1983 and 19907. The time periods, tl and t2, refer to these years.
'Note that the statistics in this table are slightly different from the statistics reported in the previous paragraphs because they are selected from different years.
.
'First-year full -time enrollment statistics are published by the National Science Board (1991, appendix table 2-12, p. 242). Percentages reported in the table were computed by the author.
15
Percent
100
80
60
40
20
0
Figure 4
Female Share of Test Takers
Planning Each Area of
Graduate Study
HEALTH SCIENCES/SERVICES _______________________________________________________________ EDUCATION BIOL.SCI.'
SOCIAL SCIENCES ---BUSINESSMATH/PHYS. & COMP./SCI.
_________________
ENGINEERING -182
83
84
85
86
87
88
89
90
9192
93
Year
Comparison of Numbers of GRE Test Takers Planning to Study Engineering with Subsequent
First-Year Full-Time Enrollment in Engineering
GRE Statistics Enrollment Statistics No. males at tl 7,233 16,899 No. males at t2 12,452 17,213 Percent increase 72.2 1.9 No. females at tl 1,465 2,366 No. females at t2 2,712 3,040 Percent increase 85.1 28.5 Percent female at tl 16.7 12.3 Percent female at t2 17.9 15.0
Increase in female share (percentage points)
1.2 2.7
For both males and females, we see a far greater increase in the number taking the GRE than
in the number enrolling in graduate school. It is especially puzzling to see such a great discrepancy
between the increase in male GRE test takers and the increase in male enrollment. But that is not the point to be made from these statistics. The growth in female enrollment is impressive: 28.5% in just 7 years. But this outstanding growth does not address the issue of underrepresentation. Even with male enrollments increasing a mere 1.9% and female enrollments increasing 28.5%, the percentage of females enrolled as first-year engineering students increased only 2.7 percentage point: from 12.3% to
15.0% of all enrolled first-year engineering students.
Examining the GRE statistics, we see that the percentage increase in female test takers was higher than it was for male test takers, but the difference was not so extreme as it was for enrollment increases. Nevertheless, an increase of 85.1% in just 7 years appears to be quite impressive. The increase in the female share, however, was only 1.1 percentage points. In other words, in 1982, only 16.8% of test takers in engineering were female, and by 1989 that figure had grown by only 1.1%, to 17.9%.
When viewed in these terms, whether we examine the GRE statistics or the enrollment
statistics, women have made very little progress toward equal representation in engineering. A similar argument applies for the sciences as well. These statistics have been presented here to emphasize that trend statistics may be interpreted very differently depending on the way percentage changes are reported. Apparent discrepancies between GRE statistics and statistics based on other databases may not be as large as they first appear. Furthermore, in studies of underrepresentation, whether of females
or ethnic minorities, the way in which these statistics are presented influencesconclusions. It is most
important to be aware of which way the percentages are reported when interpreting trend data and
talent-flow information.
17
Ethnic Group. Statistics for minority examinees are similar in many ways to those for female examinees. The number of minority test takers has grown dramatically in most areas of study, but so has the number of White test takers. The proportion of minorities has increased very little in some areas, and noticeably more in others.
Between 1982 and 1993, the percentage of non-white test takers rose from 13.7% to 16.9%. Figure 5 shows trends in the proportion of minorities in each of the eight areas of intended graduate study. Essentially all fields showed increases after about 1987 or 1988; before that time--between 1982 and 1987there was essentially no change in the minority share in any area. The area with the largest percentage of minorities was business, and it increased by 4 to 5 percentage points over the period studied. Engineering, second highest, increased by 7 percentage points, a gain greater than in any other field. Arts and humanities--the area attracting the fewest number of minorities--grew by 3 percentage points in just the last few years. Mathematics, physical sciences, and computer sciences showed an increase almost as large as that in engineering. Health sciences and services showed only
the slightest increase.
These statistics treated all minority examinee data together. There were, of course, considerable differences among the various ethnic groups. Some of these differences have been reported in a pair of documents prepared for that purpose (Grandy, 1994c). It is beyond the scope of this report to discuss trends in all fields of study for all ethnic groups. Tables presenting that
information are available from the author.
Age. Between 1982 and 1988, the proportion of test takers over age 30 grew from 20% to 28% of the population of U.S. citizens taking the General Test. After that time, with the number of test takers of all ages steadily growing, the percentage of older examinees leveled off and actually decreased to 24%
by 1993.
Some areas of graduate study more than others have attracted older students. Figure 6 shows trends in the proportion of test takers over age 30. The area attracting the greatest proportion of older
students has been education; engineering and the natural sciences have attracted the smallest. All eight of the broad areas of graduate study showed an increase in older students followed by leveling and, in
most cases, some decline. Social sciences showed the greatest decline; engineering showed no decline
as of 1993.
Degree Objectives. Overall, the percentage of examinees planning to earn a doctorate has remained steady at about 37%, but there have been considerable differences in that trend by intended field of study (Figure 7). Examinees planning graduate work in arts and humanities have raised their educational aspirations considerably. In 1982, only 45% planned to earn a doctorate; by 1993, that figure had risen to 60%. Test takers in mathematics, physical sciences, and computer sciences--as a whole--showed an increase, but not quite so large. The percentage planning to earn a doctorate rose from 44% to 55% during that period. There were smaller increases in the social sciences, engineering,
and in business.
In contrast, examinees in health sciences and services are striving less for a doctorate than they did a decade ago. In 1993, only 20% of the test takers in this area planned to earn a doctorate,
compared with 33% in 1982. A small decline--from 27% to 23%--occurred in education.
18
Percent
25
20 --'
15
10
0
Figure 5
Minority Share of Test Takers
Planning Each Area of
Graduate Study
BUSINESS .---11ENGINEERING . --- ..-- .---HEALTH SCI. 11 EDUCATION ARTS/HUMANITIES BIOL. SCI.82
1 1 1 I I 1 1 1 1 183
84
85
86
87
88
89
90
9192
93
Year
ALL U.S. CITIZENS TAKING THE GRE
31
60
Figure 6
Share of Test Takers
over Age Thirty
Percent
50 -
40
-EDUCATION HEALTH SCIENCES30
-BUSINESS
_ ---BUSINESS20
-SOCIALSCIENCES/
_______________ _eARTS/HUMAN. ---_________10
-________________ ___________ MATH/PHYS. SCI. BIOLOGICAL0
ENGINEERING SCIENCES82
83
84
85
86
ALL U.S. CITIZENS TAKING THE GRE
87
88
Year
89
90
9192
93
34
70
Figure 7
Share of Test Takers
Planning to Earn a
Doctorate
Percent
60 -
50 -
40
-SOCIAL SCIENCES ARTS/HUMANITIES ----__________________________ ---BIOL. SCI.--
--- --- m__ --- H__-SCI HEALTH SCI./ /COMP. SCI. SERVICES ENGINEERING
30
20 -
10-
0
EDUCATION, BUSINESS ---,82
83
84
85
86
87
88
89
90
9192
93
Year
ALL U.S. CITIZENS TAKING THE GRE
35
One might speculate that these patterns are occurring in response to economic conditions. The number of examinees planning to earn a doctorate has been rising in fields such as arts and humanities in which a doctorate is a definite advantage, if not a requirement, for an academic position, possibly the only employment available to arts and humanities graduates. Numbers planning to earn a doctorate have been declining in health sciences and services, and in education--fields for which a master's degree is advantageous or even necessary for employment as a practitioner or teacher. A doctorate, which might prepare a person for an academic position, may be less useful in those fields at a time when academic positions are at a premium.
Undergraduate Composition. Figure 8 shows, for each area of intended graduate study, trends in the percentages of test takers who earned, or planned to earn, their bachelor's degrees in the same areas. Not surprisingly, engineering was consistently the highest. Perhaps the mostdifficult field to switch into from another field, engineering drew from 85% to 87% of its students from engineering. The
remainder came primarily from mathematics, physical sciences, and computer sciences.
One area drawing more than half of its applicants from a different area was business. Business drew one fifth of its applicants from the social sciences. The remainder were from engineering (8%), arts and humanities (7%), and other areas. In 1993. only 47% of the examinees planning graduate work in education earned (or planned to earn) their undergraduate degrees in
education.
In most graduate fields there was very little change in undergraduate composition. Exceptions were social sciences and education. Only in those two areas did the percentages change appreciably during the 12-year period. Figures 9a and 9b show cumulative bar graphs comparing undergraduate
composition of education and social sciences, respectively.
In education, there was a decrease in the percentage who had done their undergraduate studies in education--from 61% in 1982 to 47% in 1993. Replacing education majors over time were greater
numbers of social science majors as well as business majors. In other words; increasing numbers of
business and social science majors may now be attracted to education at the graduate level. The trend in social sciences was not so pronounced, and it was the reverse of that in
education. Increasing numbers of examinees planning to study social sciences did their undergraduate studies in social sciences. Figure 9b shows the change in composition. In 1982, 6% of test takers planning graduate work in social sciences did their undergraduate work in education; that figure dropped to 2% by 1993. Numbers with degrees in arts and humanities who switched to social sciences also decreased somewhat, from 10% to 7% of the examinees planning to study social sciences. Although these are not large numbers, they show a steady trend over the 12-year period.
How do switches in field of study affect the academic quality of the students applying to a
graduate program?
Education and social sciences were the only two fields showing a noticeable change in undergraduate field composition. The last page of Appendix G-2 shows the mean GRE scores of
examinees with all possible combinations of undergraduate major and intended graduate major field.
Examinees, for example, who had undergraduate majors in social sciences and intended to study education at the graduate level had a mean GRE verbal score of 474 (column 5, row. 7, of the first table on that page). They had, on average, verbal test scores about 20 points lower than the average
100
Figure 8: For Each Graduate Field, the
Percent Whose Undergraduate Major Was
the Same as Intended Graduate Field
Percent
BIOL. SCI, MATH,
PHYS., COMP. SCIENCE
ENGINEERING
80
__________ _---60
------40
20
ARTS/ HUMANITIES --- . ---'SOCIAL SCIENCES
HEALTH SCI./SERVICES ---EDUCATION BUSINESS---82
83
84
85
86
87
88
Year
ALL U.S. CITIZENS TAKING THE GRE
38
89
90
9192
93
39
100%
75%
50%
25%
0%
Figure 9a: Undergraduate Majors of Examinees Planning Graduate Work in
Education 11% 2% 2% 10% 14% 61%
#ffittttaitittomiti
12% 9% 6% 15% 14% 47% 1982 Year 1993EDUCATION ARTS/HUM f SOC SCI A BUSINESS
= MATH/SCI EM OTHER = NOT SPECIFIED
ALL U.S. CITIZENS TAKING THE GRE
Figure 9b: Undergraduate Majors of Examinees Planning Graduate Work in
Social Sciences and Psychology 100% 9% 2%-w 2%" 75% 10%6 %' 50% 70% 25% 0% 1111±11tatitteldittlitlittitlititt1±1±1:13 8% 78% 1982 Year 1993
SOC SCI ARTS/HUM = EDUCATION BIOL SCI
= BUSINESS EN OTHER = NOT SPECIFIED
for all social science majors (total for column 5). On the other hand, their averages were considerably higher (46 points in 1993) than those of the education majors planning to continue in education
(column 7, row 7). Their average quantitative scores were also lower (by 27 points) than the average
for other social science majors, yet 35 points higher than the average for education majors continuing in education. A similar pattern holds for business majors switching to education. Their test scores
were somewhat lower than those of other business majors but higher than those of educationmajors
continuing in education. To some small degree, therefore, the average test scores of all three groups
-those in social science, business, and education -- increased as a result of this switch.
Looking at the same figures for examinees planning graduate work in social sciences, we see a similar pattern, but not quite so striking. Education majors switching to social sciences were among the higher scoring education majors, but their scores were not quite so high as those of social science majors continuing in social sciences. A decline in the number of education majors entering social
sciences should raise the score averages in social sciences. Arts and humanities majors have the opposite effect. Examinees with undergraduate majors in arts and humanities have higher scores--both verbal and quantitative--than do social science majors continuing in social sciences. A decline in their
numbers, therefore, has a adverse effect on the test score averages for social sciences.
A conclusion we may draw from these observations is that there appears to be a fairly consistent relationship between test score averages and major-field switching patterns. If examinees with an undergraduate major in field A have lower test score averages than examinees in field B, the examinees switching from A to B are likely to have average scores higher than the mean for field A but lower than the mean for field B. Similarly, if examinees with an undergraduate major in field A have higher test score averages than examinees in field B, the examinees switching from A to B are likely to have average scores lower than the mean for field A but higher than the mean for field B.
Changes in Field of Study
The previous analyses focused on intended graduate field of study, looking at the
characteristics of examinees feeding into designated fields. The remainder of this report will shift perspective. We will focus on each undergraduate field and examine the number and the
characteristics of examinees planning to go various directions for graduate school.
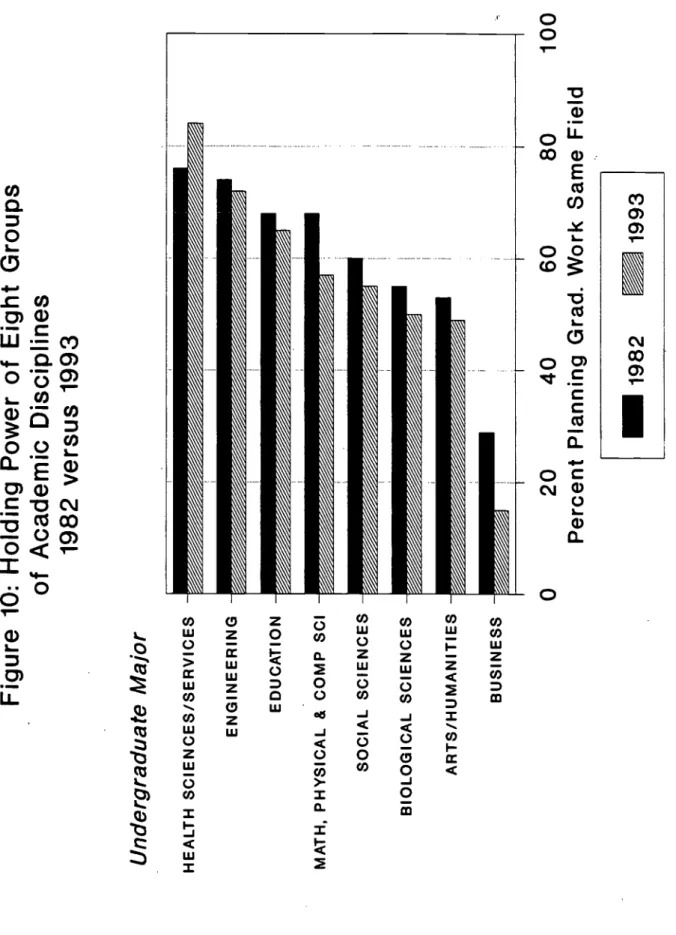
Comparing 1982 with 1993 data, Figure 10 shows the holding power of each field, that is, the percentage of examinees planning to do graduate work in the same area as their undergraduate work,
for each of the eight academic areas.
Health sciences and services had the greatest holding power of all eight areas, and it was the only one that increased over the 12-year period. Between 1982 and 1993, it increased from 76% to 84%. A close second to health sciences and services was engineering, where holding power decreased just slightly, from 74% to 72% over the 12-year period. Education, which also had a relatively high holding power, also lost only a small amount, from 68% to 65%. The number of examinees in
mathematics, physical sciences, and computer sciences who planned to continue in those fields
dropped from 68% to 57%, the largest decline except for business. The remaining fields had holding powers of 60% or less, and they all showed some decline over the 12-year period.
25
BEST COPY AVAI
4 1
1 1
Figure 10: Holding Power of Eight Groups
of Academic Disciplines
1982 versus 1993
Undergraduate Major
HEALTH SCIENCES/SERVICESENGINEERING
EDUCATION
MATH, PHYSICAL & COMP SCI
SOCIAL SCIENCES
BIOLOGICAL SCIENCES
ARTS/HUMANITIES
BUSINESS
0
ALL U.S. CITIZENS TAKING THE GRE
20
40
60
80
Percent Planning Grad. Work Same Field
100
An interesting pattern emerges if we compare holding power with the percentage of examinees planning to earn a doctorate. Health sciences and services had the greatest holding power and the
fewest people planning to earn a doctorate. Recall that this is a field that includes students in nursing,
physical therapy, and speech, hearing and language pathology, most of whom are seeking a master's
degree. It also consists of applicants to veterinary and medical schools, but these people are relatively
few. Promises of employment opportunities in these areas may well account for their large holding
power. Engineering, second highest in holding power, was another field in which over half of all
applicants planned to earn only a master's degree. Education, third highest in holding power, is another field in which fewer than one third of examinees planned to earn a doctorate.
In contrast to these fields, arts and humanities, social sciences, and biological sciences had
lower holding powers, but within each of these areas, more than 50% planned to earn a doctorate. Could there be a relationship between the percentage in each field planning to earn a doctorate and the
holding power of that field?
Many recent articles (such as Magner, 1994) discuss the dismal job market for new Ph.D.s. Job prospects for practitioners, such as teachers and health care workers, may not appear so bleak, and because the jobs require only a master's degree, have gained appeal. The GRE data seem to suggest that fields of this sort--that focus on providing education and credentials for practitioners--appear to have the greatest holding power in the current job market. Figure 11 plots the holding power of each of the eight fields against the percent planning to earn a doctorate. The field of business appears to be an outlier in an otherwise negative relationship between holding power and degree objective. Why
might this be the case?
In 1993, only 15% of test takers with undergraduate majors in business planned to study business at the graduate level. Nineteen percent planned to switch to education, 13% to social
sciences, and 9% to health sciences and services; the remainder were spread over other fields. The fact that so many business majors planned to switch fields may account for why they took the GRE in the first place. Most likely, the business graduates planning to continue in business (to earn an MBA) took the GMAT instead of the GRE. So, the low holding power of business is likely to be an artifact
of test selection.
If we exclude business from our analysis, we do see a strong negative correlation between the holding power of an area and the percentage planning to earn a doctorate'. Perhaps the strength and
direction of this relationship could be a useful economic indicator.
The holding power of every field was different for males than for females, as shown in Figure 12. In general, more females than males change fields, but in health sciences and services and in education, the reverse is true. Differences in patterns of change, by field of study, will be discussed in
more detail later in this report.
8The product-moment correlation among the seven points, excluding business, is -0.87. 27
100
80
60
40
20
Figure 11
Relationship of Holding Power of an
Academic Area to Degree Objective
Percent Planning Same Field
HEALTH SCIENCES/ SERVICES IN ENGINEERING EDUCATION El BUSINESS MATH, PHYSICAL/ COMPUTER SCIENCES BIOLOGICAL SCIENCES SOCIAL SCl/ ARTS/ HUMANITIES
10
20
30
40
50
60
70
Percent Planning Doctorate
46
Figure 12: Holding Power of Eight Groups
of Academic Disciplines for 1993
by Gender
Undergraduate Major
HEALTH SCIENCES/SERVICESENGINEERING
EDUCATION
MATH, PHYSICAL & COMP SCI
SOCIAL SCIENCES ARTS/HUMANITIES
BIOLOGICAL SCIENCES BUSINESS
0
20
40
60
80
Percent Planning Grad. Work Same Field
ALL U.S. CITIZENS TAKING THE GRE
4'7
100
Differences between Examinees Who Change Fields and Those Who Do Not
This section of the report will make some generalizations about examinees who changed fields (referred to as "changers") and examinees who did not (referred to as "nonchangers"). It would be naive to suggest that changers and nonchangers form homogeneous groups, or that a person changing from business to education is in any way like a person changing from physics to engineering.
Nevertheless, we have examined some general statistics and will report them here. More informative,
perhaps, are analyses of change for particular academic areas, to be discussed later.
Female examinees were somewhat more likely to change fields than were male examinees. In 1993, 44.2% of females and 40.6% of males switched from one broad area of study to another. These figures do not include people who shifted to another field within the broader' area. For example, if one switched from an English major to graduate study in Spanish, the decision was not treated as a change because the person continued in arts and humanities. A switch from English to archaeology would be treated as a change because the person would go from arts and humanities to social sciences.
There were also small differences among ethnic groups, with the most frequent changes occurring among African American examinees and the least frequent among Mexican Americans. The following table shows the percentage of each ethnic group planning to change fields in 1993.
Percent Ethnic Planning Group to Change African American 47.1 Other Hispanic 43.6 White 42.6 Asian American 41.7 Puerto Rican 41.5 Native American 41.5 Mexican American 40.6
On average, changers were slightly older than nonchangers, by about one year. In the survey of older science and engineering students, we found a correlation between age and the proportion of examinees changing fields (Grandy, in preparation). A closely related and more directly relevant variable is "time since bachelor's degree." The longer examinees are out of college, not surprisingly, the more likely it is they will study something different if they return to graduate school. It is in this category that we find career changers. The distribution of time since bachelor's degree, like the distribution of ages, was highly skewed. On average, however, changers had been out of school 4.2 years; nonchangers had been out 3.0 years. The effect size of this difference was 0.21.9
9The effect size is the difference in means of two groups divided by their pooled standard deviation. Thus, a d = 0.5 between males and females would indicate that their means differ by half a standard deviation. Cohen (1988) regards an effect size around 0.8 as "large," 0.5 as "medium," and 0.2 as "small."