Optimization Problems
ÆKyriakos G. Vamvoudakis1, Jo˜ao P. Hespanha1,
Richard A. Kemmerer2, and Giovanni Vigna2
1 Center for Control, Dynamical-systems and Computation (CCDC),
University of California, Santa Barbara, CA 93106-9560 USA
2 Computer Security Lab, University of California, Santa Barbara,
CA 93106-9560 USA
{kyriakos,hespanha}@ece.ucsb.edu,
{kemm,vigna}@cs.ucsb.edu
Abstract. Mission-centric cyber-security analysts require a complete overview and understanding of the state of a mission and any potential threats to their completion. To facilitate this, we propose optimization-based algorithms that can be used to predict in real-time how an at-tacker may try to compromise a cyber-mission with a limited amount of resources, based on a model that takes into account potential damage to the mission and probabilistic uncertainty. Two different optimization schemes are considered: one where all the mission data is known a priori to the attacker and another where system identification and a moving horizon optimization is used to produce the estimates based on historical data. Our schemes are compared with real attacks carried our by hu-man players in the 2011 international Capture The Flag (iCTF) hacking competition.
Keywords: Cyber-Security, Convex Optimization, System Identifica-tion, iCTF.
1
Introduction
Guaranteeing the security of cyber-missions is a complex, multi-dimensional challenge that demands a multi-faceted, strategic solution. The terminology
cyber-mission refers to a set of computer transactions aimed at accomplishing a specific purpose or task, such as placing an online shopping order, submitting a paper to a conference through an online submission system, or printing a bank statement at an ATM machine. Cyber-missions typically require a large num-ber of computer services, including encryption services, authentication servers, database engines, web servers. We are especially interested in cyber-missions
Æ
This material is based upon work supported by ARO MURI Grant number W911NF0910553.
D.C. Tarraf (ed.),Control of Cyber-Physical Systems, 85 Lecture Notes in Control and Information Sciences 449,
that go through several states, each of which may require one or more com-puter services. Cyber-missions are especially vulnerable to attacks because it may be possible to prevent the mission’s completion by compromising just one of the multiple services required by the mission, provided that the right service is compromised at the right time.
Cyber-missions are pervasive and can be found in trading, banking, power systems management, road traffic managements, healthcare, online shopping, business-to-business transactions, etc. The disruption to cyber-missions can thus result in cyber or physical consequences that threaten National and economic security, critical infrastructure, public health, and welfare. Moreover, stealthy cyber-attackers can lay a hidden foundation for future exploitation or attack, which they can later execute at a time of greatest advantage. Securing cyberspace requires a layered security approach across the public and private sectors.
In the cyber-mission security domain, the security analyst is interested in making decisions based on the potential damage that attacks can inflict to the mission and also on the probability that the potential damage is realized. To fo-cus their attention and coordinate defensive actions, security professionals must be able to determine which attacks presents the biggest threat and prioritize which services to defend, a problem often referred to ascyber situation aware-ness. Situation awareness [3] is a common feature of many cyber-security solu-tions but most of them are fragmented. In this paper, we present a model that can be used to predict how an attacker may try to compromise a cyber-mission with a limited amount of resources, based on a model that takes into account potential damage to the mission and probabilistic uncertainty.
This approach followed here motivated by the need to avoid flooding the se-curity analyst with raw data about complex missions and detailed logs from intrusion detection systems (IDSs). Instead, an automated or semi-automated system should process this data and present the analyst with high-level infor-mation about the computer services that are currently most crucial for mission completion and thus most likely to be the target of attacks, based on the current state of the mission and its future expected evolution. To achieve this we propose a relatively general model to describe the damage to a cyber-mission caused by potential attacks. This model can be utilized in optimization schemes to discover optimal policies to distribute attack resources over time and over the different computer services relevant to the mission so as to maximize damage to the cy-ber mission. The models proposed, need mission parameters that typically vary with time according to complex dynamics, which are difficult to determine in an analytic fashion. To avoid this difficulty, we learn such parameters using system identification of low-order state-space models that are used to make predictions of the parameter evolution for a reasonable future time horizon.
Security competitions are exceptional venues for researchers to discover and validate novel security solutions. The international Capture The Flag (iCTF) [5] is a distributed wide-area security exercise whose goal is to test the security skills of the participants. The iCTF contest is organized by the Security Lab of the Department of Computer Science at UCSB and is held once a year. The Capture
the Flag contest is a multi-site, multi-team hacking contest in which a number of teams compete independently against each other. The 2011 edition of iCTF was aimed at Cyber-Situation Awareness and, to our knowledge, produced the first experimental dataset that includes mission descriptions as well as attack logs and the statuses of computer services required by missions [2,5]. We have used this data to validate the algorithms presented in this paper and show their efficacy in predicting attacks to cyber missions by the human participants in the exercise.
The results presented in this paper were also used in the design of a high-level visualization tool to help security analysts to protect the computer systems under attack in the 2011 iCTF competition [4]. We are in the process of de-veloping human subject experiments to demonstrate the benefits of using the predictions generated by the methodology proposed in this paper, instead of searching through mission traces and security logs.
The remainder of the paper is structured as follows. Section 2 develops the general mathematical framework for cyber-security and then describes how one can use classical system identification techniques to identify the completely un-known or partially un-known time-varying processes. Section 3 describes an op-timization problem to discover how an attacker would optimally allocate her resources through all the services as time evolves for two different scenarios. The first assumes that the all the mission data is known to the attacker, whereas the second one uses a moving horizon optimization scheme that estimates this data online to predict when and where to attack. In Section 4, the algorithms proposed are applied to data from the 2011 iCTF competition. Comparison results between how the teams in the competition attacked and the results ob-tained by the optimization schemes are presented in Section 5. Finally, Section refse:conclusions concludes and discusses about future work.
2
General Framework for Cyber-Security
Our goal is to capture complex behaviors with a relatively simple model and in-corporate that in a cyber-security advisory system to show its effectiveness. This section presents a general framework to model mission-critical cyber-security scenarios.
2.1 Cyber-Mission Damage Model
Suppose that the (potential) damage that an attacker can inflict to a cyber mission is quantified by a scalarxPD0 that is a function of the level ofattack resourcesuAR0 devoted to the attack. The mapping from attack resources to
potential damage is expressed by the so calledpotential damage equation that we approximate by a linear map:
whereaIR can be viewed as the zero-resource damage level (damage achieved
without an intended attack), andbIR the marginal damage per unit of attack
resources.
Whether or not the potential damage to the missionxPDis realized is assumed
to be a stochastic event that occurs with a given probability ρ 0,1 that
also depends on the attack resources uAR IR , according to the so-called uncertainty equation that we approximate by a linear map projected to the interval0,1 :
ρguAR Π0
,1
cd uAR (2)
whereΠ0,1: IR
IR denotes the projection function
Π0,1 x 0 x0 x x0,1 1 x1,
the scalarc0 corresponds to a zero-resource probability of damage, and the
scalard0 to the marginaldecrease in the probability of damage per unit of
attack resources. We note that an increase in attack resourcesuAR leads to an
increase in the potential damagexPD[expressed by thesign before thebterm
in (1)], but may actually decrease the probability that the potential damage will actually be realized [expressed by thesign before thedterm in (2)], which is
motivated by the fact that a large-scale attack is more likely to trigger defense mechanisms that can prevent the potential damage from being realized.
The total expected damage yTD to the mission can be found by multiplying
equations (1) and (2), leading to theexpected damage equation
yTDfuARguAR. (3)
In the context of cyber-missions that evolve over time and require multiple com-puter services, the potential damage equation (1) and the uncertainty equation (2) need to be augmented with an index t 1,2, . . . , T that parameterizes
mission time and an index s 1,2, . . . , S that parameterizes the required
computer services, as in xPDst f s tuAR s ta s tb s tuARst, (4) ρst g s tuAR s tΠ0,1 c s td s tuARst (5)
whereuARst denotes the attack resources committed to attack servicesat time t, xPDst the potential damage at time t due to an attack to the service s, and
Pst the probability of realizing this damage. The correspondingexpected damage equation then becomes:
yTD T t1 S s1 ftsuAR s tg s tuAR s t. (6)
3
Optimization
An intelligent attacker would seek to optimally allocate her available resources to maximize the total expected missing damage. We shall consider here several options for this optimization that differ on the information that is available to the attacker.
3.1 Optimization Scheme with Known Mission Damage Data
When all the data a
s
t, bst, cst, dst : s, t that define the potential damage and
uncertainty equations is known a-priori, optimal attack resource allocation can be determined by solving the following optimization.
maximize T t1 S s1 ftsuAR s tg s tuAR s t subject to T t1 S s1 uARstUTR w.r.t. uARst0,, t, s, (7)
whereUTRdenotes the total budget of attack resources available to the attacker.
As stated in the following proposition, this optimization can be converted into the following concave maximization.
Proposition 1. When the functionsfs
t, gstare of the form(4)–(5)withast, bst, cst,
ds
t 0,t, s. The value and optimum of (7)can be obtained through the following concave maximization problem:
maximize T t1 S s1 a s tb s tuARstc s td s tuARstσ s t subject to T t1 S s1 uARstUTR, c s td s tuARstσ s t 1, t, s w.r.t. uARst 0,c s t ds t , σst 0, t, s. (8) When cs
t 0,1 , one can set the corresponding optimization variable σ
s t 0 in (8). Moreover, when cs
t 0,1 ,t, sand all the constraints on the uAR
s t are
inactive, the solution to this optimization can be found in closed form and is equal to uARst u¯stµ¯ s tmax 0, ¯ t S s1 ¯ us¯tUTR , u¯st bs tcsta s tdst 2bs tdst , µ¯st 1 2bstdst ¯ t S s1 1 2bst¯ds¯t .
Note that, if any of the constraints on the attack resources are active, a closed-form solution may not be easy and one has to solve the optimization problem (8) instead.
Proof. 1 To prove that (7) and (8) are equivalent, we start by noting that gstuAR s t 0 cs td s tuARst0 uAR s t cst dst 1 cs td s tuARst1 uAR s t cst1 dst cs td s tuARst uARst cst1 dst , cst dst .
Suppose, by contradiction, that (8) could lead to a larger maximum than (7). The conditionuARst
0,cst
dst
guarantees that the same set of uARst satisfy the
constraints of (7) and that
gtsuAR s t 1 cstd s tuARst1 uAR s t cst1 dst cs td s tuARst cstd s tuARst1 uAR s t cst1 dst
and the conditioncstd
s tuARstσ s t 1 guarantees that cs td s tuARstσ s t 1g s tuAR s t uAR s t cst1 dst cstd s tuARstσ s t g s tuAR s tσ s t g s tuAR s t uAR s t cst1 dst ,
which shows thatcstd
s tuARstσ s t g s tuAR s
tand therefore (8) cannot lead to
a larger maximum than (7).
Suppose now, also by contradiction, that (7) could lead to a larger maximum than (8). First note that if a few of theuARstthat maximize (7) were larger than
cst
dst, for thoseuARst we would havegstuAR
s
t0 and the same exact cost could
be obtained for (7) by replacing each of theseuARst with c
s t
dst. So we may assume, without loss of generality, that all theuARst are smaller than or equal to c
s t
dst. In this case, we could use the sameuARst in (8) and set
σts 0 cstd s tuARst 1 cs td s tuARst1 c s td s tuARst 1. This selection ofσs
t would satisfy the constraints of (8) and guarantee that
gstuAR s tc s td s tuARstσ s t,
and therefore (7) and (8) would lead to the same maximum. This completes the proof that (7) and (8) are equivalent.
The optimization scheme just defined is a concave maximization problem (convex minimization) with linear constraints. The dual problem is given by,
J max λ10,ηs t0,ζs t0 max uARstIR T t1 S s1 astb s tuARstc s td s tuARst λ1 T t1 S s1 uARstUTR T t1 S s1 ηts uARst cst ds t T t1 S s1 ζtsuARst max λ10,ηs t0,ζs t0 max uARs tIR T t1 S s1 astcsta s tdstuARstb s tcstuARstb s tdstuARst2 λ1uAR s tη s tuARstζ s tuARst λ1UTR T t1 S s1 ηstc s t ds t max λ10,ηs t0,ζs t0 max uARstIR T t1 S s1 astcstb s tdstuARst2 b s tcsta s tdstζ s tη s t λ1uAR s t λ1UTR T t1 S s1 ηtsc s t dst .
The inner maximization can be solved using standard calculus and is achieved for uARst bs tcsta s tdstζ s t η s tλ1 2bs tdst , yielding J max λ10,η s t0,ζ s t0 T t1 S s1 b s tcsta s tdstζ s t η s tλ1 2 4bs tdst η s t cst ds t λ1UTR.
For this problem the Karush-Kuhn-Tucker (KKT) conditions [1] lead to
J λ1 0 λ1 T t1 S s1 bstcsta s tdst ζstη s t 2bstdst UTR T t1 S s1 1 2bstdst or λ10 J η s t 0 η s t ζ s t a s tdstb s tcstλ1 or η s t 0 J ζ s t 0 ζ s t b s tcsta s tdstη s tλ1 or ζ s t 0.
Let us assume thatuARst is inside the interval
0,cst
dst
, which would lead to all theηs
t andζts equal to zero (inactive constraints) and therefore we would need T t1 S s1 bstcsta s tdstλ1 2bs tdst UTR λ1 T t1 S s1 bstcsta s tdst 2bstdst UTR T t1 S s1 1 2bstdst 0 (9) or λ10
and uARst u¯stµ¯ s tmax 0, ¯ t S s1 ¯ us¯tUTR , u¯st b s tcsta s tdst 2bs tdst , µ¯st 1 2bstdst ¯ t S s1 1 2bst¯ds¯t .
We can view the term being subtracted fromuARst as a normalizing term that
makes sure that theuARst add up to the constraintUTR.
Note that if the closed-form formula shown above for uARst ever becomes
negative, then the correspondingζs
t will become active and we must have
J ζ s t 0 ζ s t λ1a s tdstb s tcst uAR s t 0.
Similarly if the formula foruARst ever becomes larger than c
s t
dst, then the
corre-spondingηtswill become active and we must have
J η s t 0 η s t b s tcstλ1a s tdst uAR s t cst ds t .
Remark 1. Note that, if any of the constraints on the attack resources are active, a closed-form solution is not possible and one has to solve the optimization
problem instead.
3.2 Unknown Mission Damage Data
Often the mission-specific parametersa
s
t, bst, cst, dst:s, tthat define the
poten-tial damage and uncertainty equations are not known a-priori and, instead, need to be estimated online. The estimation problem will be posed using a grey-box model that looks like ak-step ahead predictor. The problem is solved at each time instant to incorporate the new information that is obtained in the form of a new measurement of the process variables.
One approach that can be used to address this scenario is to assume that these parameters are generated by linear dynamics of the form
xsat 1A s axsatB s awts, astC s axsat, (10) xsbt 1A s bxsbtB s bwts, bstC s bxsbt, (11) xsct 1A s cxsctB s cwts, cstC s cxsct, (12) xsdt 1A s dxsdtB s dwst, dstC s dxsdt, (13) where thew s
t,s, tare sequences of zero-mean random processes with variances σws. One can then use historical data to estimate these dynamics using black-box identification techniques. Once estimates for the dynamics are available, one can use online data to predict future values for the mission-specific parameters
a
s
It is crucial that the data collected from the system conveys continual infor-mation on the parameters to be estimated and the identification algorithm can rely on fresh information in forming reliable current estimates (persistence of excitation).
Suppose that at some timekT the attacker has observed the values of the
past mission-specific parameters a
s
t, bst, cst, dst : s, t k and needs to make
decisions on the future attack resources uARst, t k. One can use (10)–(13)
to construct estimates ˆa
s
t,ˆbst,ˆcst,dˆst : s, t k for the future mission-specific
parameters and obtain the futureuARst,tk using the following optimization:
maximize k t1 S s1 ftsuAR s tg s tuAR s t T tk 1 S s1 ˆ ftsuAR s tˆg s tuAR s t (14) subject to T t1 S s1 uARst UTR (15) w.r.t. uARst 0,, tk, ..., T, s, (16) wherefs
t andgtsdenote the functions defined in (4) and (5), respectively, whereas ˆ
ftsand ˆgstare estimates of these functions computed using the estimated mission-specific parametersaˆ
s
t,ˆbst,ˆcst,dˆst :s, tk.
The optimization (14) can be solved at each time step k 1,2, . . . , T 1,
allowing the attacker to improve her allocation of attack resources as new in-formation about the missing parameters becomes available. Note that one could remove from the (double) summations in (14) any terms that do not depend on the optimization variables.
4
iCTF Competition
The international Capture The Flag (iCTF) is a distributed wide-area security exercise to test the security skills of the participants. This contest is organized by the Security Lab of the Department of Computer Science at UCSB and it has been held yearly since 2003. In traditional editions of the iCTF (2003-2007), the goal of each team was to maintain a set of services such that they remain available and uncompromised throughout the contest. Each team also had to attempt to compromise the other teams’ services. Since all the teams received an identical copy of the virtual host containing the vulnerable services, each team had to find the vulnerabilities in their copy of the hosts and possibly fix the vulnerabilities without disrupting the services. At the same time, the teams had to leverage their knowledge about the vulnerabilities they found to compro-mise the servers run by other teams. Compromising a service allowed a team to bypass the service’s security mechanisms and to “capture the flag” associated with the service. During the 2008-2010 iCTFs, new competition designs have been introduced. More precisely, in 2008 a separate virtual network was created for each team. The goal was to attack a terrorist network and defuse a bomb
after compromising a number of hosts. In 2009, the participants had to compro-mise the browsers of a large group of simulated users, steal their money, and create a botnet. In 2010, the participants had to attack the rogue nation Litya, ruled by the evil Lisvoy Bironulesk. The teams’ goal was to attack the services supporting Litya’s infrastructure only at specific times, when certain activities were in progress. In addition, an intrusion detection system would temporarily firewall out the teams whose attacks were detected. The 2011 iCTF competition is briefly summarized below from the perspective of one team playing against the rest of the world. The 2010 [2] and 2011 [5] iCTF competitions were designed closely match practical cyber-security mission scenarios.
4.1 2011 iCTF
The 2011 iCTF was centered around the theme of illegal money laundering. This activity is modeled after cyber-criminal money laundering operations and provided a perfect setting for risk-reward analysis, as the trade-offs are very intuitively understood.
The general idea behind the competition was the conversion (“laundering”) of money into points. The money was obtained by the teams by solving security-related challenges (e.g., decrypting an encrypted message, find hidden informa-tion in a document, etc.) The conversion of money into points was performed by utilizing data captured from an exploited service. Therefore, first a team had to obtain money by solving challenges, and then the money had to be translated into points by exploiting the vulnerability in a service of another team. Success-ful conversion of money to points depended on a number of factors, calculated together as the “risk function”, which is described in detail below. Note that, at the end of the game, the money had no contribution to the final stand of a team: only points mattered.
One challenge with the formulation “one-against-world” is that in the 2011 iCTF game, winning was not just about maximizing points. Winning was about getting more points than each of the opponents (individually).
The game was played in rounds 255 (each takes about 2min), but we only have data for 248 rounds since the logging server was temporarily down. Each team hosts a server that runs 10 services each with its own (unknown) vulnerabilities. Each service s 1,2, . . . ,10 of each hosting team is characterized by three
time-varying quantitiest1,2, . . . ,248:
– thecut Cs
t, which is the percentage of money that goes to the team when money is laundered through services(same values for every team),
– thepayoff Pts, which is the percentage of money that will be transformed into points for the team that launders the money (same value for every team);
Pts0.9e
T icksActive 10
– the risk Rs
t, which is the probability of losing all the money (instead of getting a conversion to points).
The generation of the time series for the cuts, payoffs, and risks for the different services was based on an underlying set of cyber missions that were running while the game was played. Essentially, when the states of the cyber missions required a particular service, the cut, payoff, and risk would make that service attractive for attackers from the perspective of converting money to points. However, the players were not informed about the state of the cyber-missions and, instead, at the beginning of each roundt, the team is informed of the values ofCs
t,Pts,Rst for everys, andt.
4.2 Actions Available to Every Team
A team (we) has the following key actions in the actual competition: 1. Defensive actions: Activate/deactivate one of its own services.
In the iCTF competition a team could also correct any vulnerability that it discovered in its services. We assumed here that all known vulnerabilities had been corrected.
2. Money laundering: Select
(a) team to attack (mute decision within the “one-against-world” formula-tion);
(b) servicesto compromise, which implicitly determines the payoffPts, the riskRs
t, and the cutCts;
(c) amount of money to launderuARst at timet through the services.
This action results in a number of points given by
Xts Pts1C s tDtuAR s t w.p. 1minρ s t,1 0 w.p. minρ s t,1 (17)
whereDtis the team’s defense level andρst is the probability that the con-version of money to points will succeed, as given by the formula
ρst R s tuARst 30 1 6 Ntj700 300N j t 700 1 1 6 Qst1500 300Q s t1500 1
where Ntj is the overall amount of money that has been laundered by the team j through the particular team being exploited and Qst is the overall amount of money that has been laundered by the team through the particular service being exploited. Because we do not model each team individually we will consider the “worst” case scenario for the following quantities,N 492, Q2257 (according to data from the competition), and defense level of the
team asD1.
To map this game with the general framework described in Section 2, we asso-ciate the money to launderuARst at timet through serviceswith the resources uARst devoted to attack servicesat timet, and associate the pointsXtsin (17)
The total attack resourcesUTR available to each team in the general
frame-work described in Section 2, now corresponds to the money available to each team. While we could model more accurately the process by which teams get money, for simplicity we assumed that each team had available a fixed amount of money ($5060) that could be spend throughout the duration of the game which is given by the average money of all the teams during the competition. The re-sults regarding which services where attacked and when proved to be relatively insensitive to this parameter.
4.3 Optimization Schemes and iCTF
In this section we apply the optimization schemes defined in Sections 3.1 and 3.2 to the iCTF game. We are seeking to optimally allocate our available resources in the competition such that the total number of points is maximized while meeting the specified constraints. The maximization of the expected reward by a team can be formulated as follows
maximize 248 t1 10 s1 ρstPts1C s tD s tuARst subject to 248 t1 10 s1 uARst UTR 5060 w.r.t. uARst 0,, s1,2, . . . ,10, t1,2, . . . ,248, where, ρstminβ s t Rs t 30uAR s t,1, βts 1 6 Nt700 300Nt700 1 1 6 Qt1500 300Qt1500 1 0.4
and the parametersPs
t, Cts, Dts, βtscan either be considered known or unknown. By using Proposition 1, and setting the constraint σs
t 0 in (8) (since 1 βs
t0,1), we can write the equivalent optimization problem as,
maximize 248 t1 10 s1 1β s t Rs t 30uAR s tP s t1C s tuAR s t subject to 248 t1 10 s1 uARstUTR w.r.t. uARst 0,1β s t Rst 30 , s1,2, . . . ,10, t1,2, . . . ,248,
which is a concave maximization problem with linear constraints that is easy to solve numerically as described in Section 3.1.
The above optimization depends on the following assignments, ast 0,bst Ps t1C s t,c s t 1β s t,dst R s t
bs t Pts1C s t,c s t 1β s t,dst R s t
30 using a low order state space models given
by (11)-(13). By then applying the optimization scheme described in Section 3.2, with a horizon ofN 5, one can still make accurate predictions of when and
how to distribute the available attack resources. The optimization model just described, results in an optimization to obtain the future uARst,t k and
performed under a moving horizon of 5 ticks,
maximize k t1 10 s1 bstc s td s tuARstuAR s t 248 tk 1 10 s1 ˆ bstˆc s t ˆ dstuARstuAR s t subject to 248 t1 10 s1 uARst UTR k xsbt 1A s bxsatB s bwst ˆbs t C s bxsbt xsct 1A s cxsctB s cwst ˆ cst C s cxsct xsdt 1A s dxsdtB s dwts ˆ dst C s dxsdt w.r.t. uARst 0,ˆc s t ˆ ds t , tk, . . . ,248,s1,2, . . . ,10.
5
iCTF Results
This section presents numerical results obtained from the optimizations de-scribed above to data from the attack logs of the 2011 iCTF competition. All the optimizations have been implemented through a Matlab-based convex optimiza-tion solver such as CVX [1]. The optimizaoptimiza-tion scheme described in Secoptimiza-tion 3.2 yielded very close results to the scheme described in Section 3.1 for a predicting horizon ofN 5.
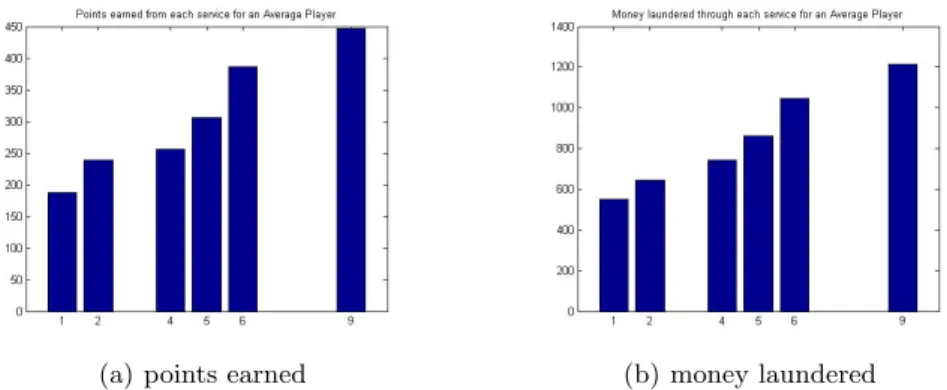
Initially we will assume that a “sophisticated” attacker would be able to com-promise any one of the 10 services. Figure 1 show the points and the money collected by such an optimal attacker, whereas Figure 2 shows the same (aggre-gate) data for the teams that participated in the competition.
One can also consider attackers with different level of sophistication, e.g., attackers that are only able to find vulnerabilities in a subset of the 10 services that the “sophisticated” was able to attack. By observing the data of the top 20 teams in the competition we were able to partition the sophistication in two levels. For comparison, we show the behavior of an attacker A that was only able to attack the services 1,2,4,5,6,9 (similar to the first 10 teams in the competition); and another attacker B that was only able to attack services 1,2,5,6,7,8 (similar to the teams from place 11 to 20 in the competition). The “sophisticated” attacker was able to gather with 1987 points, whereas the two other attackers were able to get 1821 and 1721 points, respectively.
(a) points earned (b) money laundered
Fig. 1.Behavior of an optimal “sophisticated” attacker able to attack all 10 services
(a) points earned (b) money laundered
Fig. 2.Aggregate behavior of all teams that participated in the competition
(a) points earned (b) money laundered
Fig. 3.Behavior of an optimal attacker A able to attack services 1,2,4,5,6,9
The results in Figure 1(a) show that the most profitable services to attack were 5,6 and 9. The top 10 teams in the competition attacked mostly 5 and 6 because 9 was a hard service to get into. Only the top 3 teams discovered
(a) points earned (b) money laundered
Fig. 4.Behavior of an optimal attacker B able to attack services 1,2,5,6,7,8
(a) points earned (b) money laundered
Fig. 5.Behavior of the top 3 teams during the competition
how to attack service 9 and only at the end of the game so they had relatively little time to explore that vulnerability. Aside from this, the prediction based on the optimization framework developed here qualitatively reflect the actions of the good teams. In fact, the top two teams in the competition followed attack strategies qualitatively close to that of attacker A in Figure 3 as seen in Figure 5.
6
Future Work
Our future work in this area is focused on developing analysis tools to explore what-if scenarios based on past data and the structure of the cyber-mission. To this end, we are developing optimization schemes for the defender’s possi-ble actions, such as taking a service off-line when the service is not needed or extending the duration of a state that would be unable to progress if a certain service is compromised. We are also developing human-computer interfaces to demonstrate the useful of this type of analysis for security analysts.
Moreover this work can be extended to provide a method to analyze cyber-security aspects of power system state estimators where the attacker has limited resources and an index is introduced to enable the operator to see what resources are the most important to protect.
References
1. Boyd, S., Vandenberghe, L.: Convex Optimization. Cambridge University Press (2004)
2. Doupe, A., Egele, M., Caillat, B., Stringhini, G., Yakin, G., Zand, A., Cavedon, L., Vigna, G.: Hit’em where it hurts: A live security exercise on cyber situational awareness. In: Proceedings of the Annual Computer Security Applications Confer-ence (ACSAC 2011), Orlando, FL (December 2011)
3. Endsley, M.: Theoretical Underpinnings of Situation Awareness: A Critical Review, ch. 1, pp. 3–32. L. Erlbaum Assoc. (2000)
4. Stockman, N., Vamvoudakis, K.G., Devendorf, L., H¨ollerer, T., Kemmerer, R., Hespanha, J.P.: A Mission-Centric Visualization Tool for Cybersecurity Situation Awareness. Technical Report, University of California, Santa Barbara (August 2012) 5. Vigna, G.: The 2011 UCSB iCTF: Description of the game (2011),