Development of Traffic Accident Prediction Models to Improve
Traffic Safety and to Reduce Traffic Accident Severity and Rate
in Jordan
Mohammad Abojaradeh*, Ph.D., P.E. Faculty of Engineering, Department of Civil Engineering, Zarqa University P.O. Box 2000, Zarqa 13110,
Jordan
*E-mail: abojaradeh@yahoo.com
Abstract
In the past few years traffic accidents have become an epidemic. They cause the death of over one million people per year worldwide including those walking and riding bikes. Recent studies have shown that Jordan suffers massive human and economical losses as well as social and emotional effects from traffic accidents every year. Despite the efforts of the public and private sectors, traffic accidents are still increasing and exhaust Jordan’s resources at the price of other areas of development and construction.The main objectives of this study are: to analyze traffic accidents in Jordan and their main causes; to reduce the number of traffic accidents and their severity. Also, to study the effect of driver behavior mistakes on traffic accidents and their severity. In addition, to determine and build prediction statistical regression models, which relates the number of accidents (dependent variable), with drivers behavior mistakes (independent variable) by using the Statistical Package for Social Sciences (SPSS) computer software.The study was conducted based on accident data provided by the Jordan Traffic Institute from the year 2000 to year 2010. The study investigates 394188 total accidents during the period of the study with five independent variables (close following, lane violation, speeding or violation of speed limit, wrong passing and red light violation).Regression techniques were used to analyze the collected data and to create four models .The models were developed by SPSS statistical package computer program. The first developed predicted model was for the total accident, the result indicated that the close following and lane violation are the most causes of accidents .The second developed model was for the fatal accidents, and the results indicated that the violation of speed limit and the lane violation are the most causes of the fatalities. The third and fourth models were developed for the slight and sever injuries; the result showed that the same independent variables causes of fatalities are applicable for injuries.The accident prediction model can be used to develop warrants and standards for law enforcement, geometric design, and traffic operation and to improve the required countermeasures in order to reduce the traffic accidents especially fatal and injury accidents.
Keywords: World Health Organization, Healthcare, Fatality, Injury, Severity, Human losses, Social and Emotional Effects, Traffic Accidents, Traffic Safety, Speed Limit, Speeding, Driver Behavior, Countermeasures, Regression Models.
1. Introduction
A traffic accident is defined as a random event or an occurrence involving one or more motor vehicles in a traffic accident that results in property damage, injury, or death (Garber 2010). With each passing day, in every country in the world, traffic accidents inflict a staggering amount of destruction. The toll, country loss of life and limb plus the socio-economic costs to society, is high and getting higher. Traffic accident is not simply a loss of a life but it is an unrecoverable setback to all those concerned. Each year millions of humans are killed or seriously injured in motor vehicle accidents as reported by the Federal Highway Research Institute (FHWA 2010).
Causes of accidents and related injury severity are of special concern to researchers in traffic safety since such research would be aimed not only at prevention of accidents but also at reduction of their severity. One way to accomplish this is to predict accident frequency or accident severity by using the statistical technique. The causes of traffic accidents are usually complex and involve several factors. The main factors can be divided into four separate categories: the driver, the vehicle, the roadway, and the environment. Human factors account wholly or partly to 93% of all traffic accidents. The human factor, the driver, is the primary cause of those accidents. The main cause of traffic accidents is disobeying the traffic safety laws, which include speeding, driver distraction, driving under the influence of drugs or alcohol, close following between the running vehicles, yielding for pedestrians and other vehicle etc. (NHTSA 2010)
Traffic accidents could be prevented, and its effects can be minimized by modifying driver behavior, vehicle design, roadway geometry, and by modifying the traveling environment. If the factors that have contributed to any traffic accident are identified, it is then possible to modify and improve the highway system. A safer highway system is likely to result with the reduction or elimination of traffic accidents causing factors. (Garber 2010, FHWA 2010, NHTSA 2010, and WHO 2007)
million people per year including those walking and riding bikes. Currently, road traffic injuries account for 2% of all deaths around the world. However in the next 20-25 years it will rise to 3.5% of all deaths making it the fifth leading cause of death around the world. Road accidents are one of the most serious issues facing developed and developing countries. The World Health Organization (WHO) anticipates road accidents to be the third cause of death among the fifteen causes of death in 2020. It causes human suffering to individuals, and huge financial losses to the state and the public as a result of accidents and deaths, injuries and disabilities. (WHO 2007)
Therefore, the concerted efforts of the society and the governmental and private organizations are necessary to improve road safety system, reduce the number of, and minimize fatalities and injuries. Road safety concept is not limited to the reduction of road accidents issue. It aims to adopt practically the road safety behavior by setting all necessary educational, engineering and medical programs and plans, traffic regulations and preventive measures. This would reduce or prevent accidents, ensure human and properties safety and preserve the human and economic wealth of Jordan. (FHWA 2010, NHTSA 2010, and WHO 2007)
In Jordan, traffic accidents constitute a major health problem. They are considered the second leading cause of death. Results of Analysis revealed that Jordan has experienced huge human and economic losses as well as social and emotional negative impacts. Despite the efforts of concerned public and private sectors, the accidents still constitute a source to exhaust the resources and efforts of the country and at the price of other areas of developments and construction. Therefore, the traffic accidents, death, and injures resulting from them are considered a stressful phenomena for the government and for the people at the same time. (Jordan Traffic Institute 2000-2012)
2. Review of Related Literature
The following studies are a review of a number of selected recent studies that have developed many models to identify the factors most important in determining accidents experienced by drivers' faults during traffic accidents. The studies are more related to the driver's mistakes or faults that cause traffic accidents. Therefore, it is important to present the most recorded driver faults in Jordan first.
The Jordan Traffic Institute published every year accident statistics data based on police reports and based on the summary reports determined from the Traffic Department Studies. The accident data include the following driver faults that cause the accidents. Some of these faults were used as independent variables to determine the prediction models. (Jordan Traffic Institute 2000-2012)
Svensson and Hyden in 2006 used several accidents models to identify the critical variables that influence the different parts forming the traffic safety processes. Their findings indicated that using accident data and conflict data in traffic safety analysis is not sufficient due to the low occurrence rates and the focus on rather exceptional and unsuccessful events. They proposed a new framework that considers the importance of feedback to the road users, the inclusion of more frequent events, and the prediction of safety and unsafety based on the more frequent events. (Svensson 2006)
Jrew et al. in 2007 analyzed 1780 traffic accidents data on Arbil street network by using SPSS software. Different prediction statistical models were developed and related to different types of locations (streets and intersections) in Arbil urban area at the northern part of Iraq. Potential Accident Reduction (PAR) criteria were recommended to identify accident prone locations. In their approach, they defined a term named (di) as the difference between actual and expected accidents provided by the statistical model. Larger and positive values of (di) indicate that the accidents frequency at a certain location is high. Comparing the (di) values of all sections determines the High Accident Locations (HAL). (Jrew 2007, 20012)
Ismeik and Jrew in 2010 studied the accidents caused by drivers at the west area of Amman. The research contains data on all property damage accidents as well as injury-causing and fatal accidents. The study concentrates on accidents with greatest influence on roadway safety. (Ismeik 2010)
The study used 1578 available police-reported accident records that describe motor vehicle accidents during 2004 and 2005 at different intersections in Amman. The accident files contained information about the causes of accidents, their location, and the circumstances of the accident; the data contains different types of high-accident locations at intersections on the Amman street network. A total of 43 intersections were chosen in 11 areas, namely: Abdaly, Wadi Sir, Sweileh, Marka, Tela Ali, Jebbeha, Tareq, Zahran, Madina, Naser, and Basman. The results indicated that close following (tailgating), lane change, and not yielding right of way to the others are the most independent variables affecting the causes of accidents. (Ismeik 2010)
Abo-Alush and Jrew in 2008 developed many prediction models for Marka district in east Amman. The study included 2119 accident reports on 22 streets and eight signalized intersection for the year of 2005. The results of the models showed that the following too closely and not yielding right of way is the most causes of the total accident. The following too closely, lane change and not yielding the right of way are the most causes for the accident injuries. The violation of traffic signs are the most causes of the fatalities. (Aloush 2008)
in the Greater Amman Municipality. The study area includes the following areas: Marj Al-Hamam in Western Amman and Abu Nusair, and Suweileh in North Amman, Jubeeha in Middle Amman, and Marka in Eastern Amman. A total number of accidents of 6901 were analyzed in the study area. The results of the prediction models indicates that the close following, lane violation, and not taking enough precaution are the most causes of total accidents. The lane violation and wrong u- turn, and sudden turning are the most causes of accident injuries, and the last tow factors are the most causes of fatalities on street and not taking enough precaution and close following are the most causes of fatalities at signalized intersections. (Abojaradeh 2009, 2012, and 2013, 2014)
3. Study Objective
From the above studies and other studies it is decided to select the most independent variables that can be controlled by different countermeasures to develop prediction models in order to recommend a national safety program to reduce the total accidents, fatalities, sever and slight injuries in Jordan.
The selected independent variables as shown in Table 1 are: 1. Close following.
2. Lane violation. 3. Wrong passing.
4. Speeding (violation of speed limit). 5. Red light violation.
4. Definitions 4.1 Close Following
Is the practice of driving on a road too close to the vehicle in front, at a distance which does not guarantee that stopping to avoid traffic accident is possible. Approximately one third of rear-end traffic accidents involve close following (Wikipedia 2013).
4.2 Red Light Violation
The driver may legally enter the intersection during the yellow signal indication and be within the intersection during a red indication. At the onset of the green indication, all drivers receiving the green are required to yield to any vehicles that are legally in the intersection. These drivers cannot legally proceed into the intersection until it is clear. It follows from these legal points that a red-light violation occurs when any vehicle enters (and proceeds through) the intersection after the signal has turned red. A vehicle is said to “enter” the intersection when it crosses the stop line or its equivalent location on the intersection approach (Wikipedia 2013).
4.3 Speeding (Violation of Speed Limit)
Speeding is a major cause of serious and fatal vehicle accidents in Jordan. Every kilometer per hour over the speed limit not only affects whether an accident happens, but also how severe it is (Wikipedia 2013).
4.4 Lane Violation
Drivers should always drive in the right lane. There are three basics for driving in the three lanes (Wikipedia 2013):
Right Lane: You may take this lane when you are driving at below the speed limit or to continuing driving or turning to the right before reaching the crossroad.
Middle Lane: It is for overtaking the slow vehicles on the right lane.
Left Lane: It is for overtaking by speed not exceeding the speed limit or to turn to the left side. 4.5 Wrong Passing
When you change lanes, you have to do more than just signal and check your mirrors. You must also turn your head and look into the lane that you want to enter. Remember that you have blind spots which limit your ability to see vehicles to the sides of you. A number of side swipe accidents are caused by drivers not checking their blind spots before merging into another lane (Wikipedia 2013).
5. Methodology 5.1 Statistical Data
Traffic Accident Data were collected from the General Security Department and from Jordan Traffic Institute for the years 2000 to 2010. Data were organized in statistical tables, charts, and figures and prepared in order to represent data in an easy and illustrative way (Jordan Traffic Institute 2000-2012, Public Security Department 2000-2012).
of driver faults, total number of fatalities, total number of injuries, and total number of sever injuries) that are related to the five selected independent variables (close following, lane violation, speeding, red light violation and wrong passing) for each year from year 2000 to year 2010.
Table 1: Drivers' behavior faults which contributed to traffic accidents Variables Drivers faults (Independent Variables)
1 Close following (not enough safe gap)
2 Lanes violation 3 Wrong passing 4 Wrong turning 5 Sudden turning 6 Wrong u-turning 7 Wrong backing
8 Distraction and not taking enough precautions 9 Yield violation (Not respecting priorities of vehicles)
10 Pedestrian yield violation (Not respecting the rights of way for pedestrians)
11 Wrong way driving
12 Speeding (violation of speed limit)
13 Violation of traffic signs
14 Brake system failure
15 Not securing the vehicle when stopping
16 Running on the red light
17 Not securing the vehicle loads
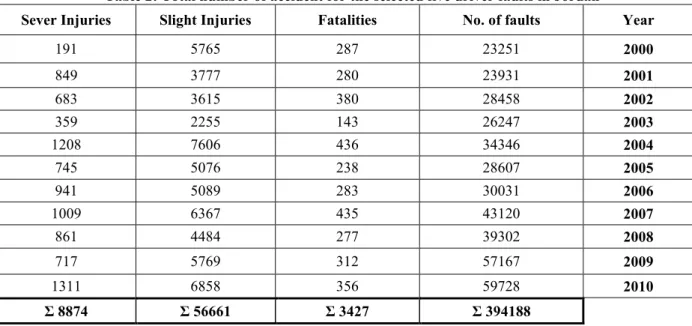
Table 2: Total number of accident for the selected five driver faults in Jordan
Sever Injuries Slight Injuries Fatalities No. of faults Year
191 5765 287 23251 2000 849 3777 280 23931 2001 683 3615 380 28458 2002 359 2255 143 26247 2003 1208 7606 436 34346 2004 745 5076 238 28607 2005 941 5089 283 30031 2006 1009 6367 435 43120 2007 861 4484 277 39302 2008 717 5769 312 57167 2009 1311 6858 356 59728 2010 Ʃ 8874 Ʃ 56661 Ʃ 3427 Ʃ 394188
Table 3: Total number of accidents for the five selected drivers’ faults (2000-2010). Total Faults Wrong
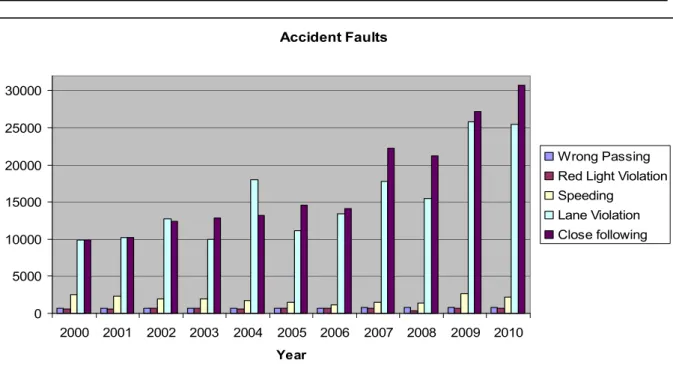
Passing Red Light Violation Speeding Lane Violation Close following Year 23251 686 557 2475 9889 9644 2000 23931 672 566 2261 10219 10213 2001 28458 683 655 1967 12775 12378 2002 26247 686 699 1970 9991 12901 2003 34346 708 620 1771 18022 13225 2004 28607 728 681 1531 11076 14591 2005 30031 708 706 1114 13403 14100 2006 43120 856 726 1525 17817 22196 2007 39302 811 382 1332 15527 21250 2008 57167 822 667 2620 25847 27211 2009 59728 830 636 2125 25417 30720 2010 Ʃ 394188 Ʃ 8190 Ʃ 6895 Ʃ 20691 Ʃ 169983 Ʃ 188429
Human Damages
0
1000
2000
3000
4000
5000
6000
7000
8000
2000
2001 2002 2003
2004 2005 2006
2007 2008 2009
2010
Year
Sever Injuries
Slight Injuries
Fatalities
Accident Faults 0 5000 10000 15000 20000 25000 30000 2000 2001 2002 2003 2004 2005 2006 2007 2008 2009 2010 Year Wrong Passing Red Light Violation Speeding
Lane Violation Close following
Figure 2: The selected five Drivers’ Faults (2000-2010). 5.2 Statistical Model Formation
SPSS (Statistical Package for Social Sciences) software was used in forming the Regression Models in this study. SPSS is considered one of the most frequently used program for researchers in many fields such as engineering, science, art, education, and psychology. (SPSS 2007)
The method of least squares that leads to the best fitting line of a postulated form to a set of data is used to form Regression Models between the dependent variable Yi, and independent variables Xi. In this study, the dependent variable Yi includes accident frequency, injuries, and fatalities. On the other hand, the independent variable Xi includes the drivers' behavior mistakes which caused traffic accidents. The detailed the total accidents for the selected drivers' mistakes (Faults) are shown in Table 2 as dependent variables. The total numbers of accidents in the study area caused by selected drivers' behavior mistakes (Faults) are shown in Table 3 as independent variables.
A relationship between the dependent and the independent variables of the form Yi = ß0 + ß1X1 + ß2X2 + … + ß n X n
Where: Yi : dependent variable. Xn : value of the nth independent variable. B0 : sample intercept. Bn : regression coefficient of the nth independent variable.
Stepwise calibration procedure was used to form the Multiple Linear Regression Model. The selections of explanatory variables follow the following four guidelines to decide which explanatory (independent) variables to include in the linear regression model. The selected independent variable has to follow the following four rules (Papacostas 2008, Montgomery 2010, Abojaradeh 2009, 2012, 2013, 2014, Jrew 2012, and 2013):
1. Must be linearly related to the dependent variable. 2. Must be highly correlated with the dependent variable. 3. Must not be highly correlated between themselves. 4. Must be relatively easy projected.
The selected regression model has to have maximum 3 to 4 variables in order to have an easy projection and application, and in order to have a lower cost. Also, the selected regression model should have strong coefficient of determination R2 value. The coefficient of determination R2, quantifies the fact that the goodness of fit of a regression line increases with the proportion of the total variation that is explained by the regression line. R2 ranges from zero when none of the total variation is explained by the regression line to unity when all of the variation is explained by the line. It is denoted as a squared quantity to capture the fact that it is always non negative. The square root of R2 the Coefficient of determination is called the coefficient of correlation (r or R). Its value can range from -1 to 1. In the case of linear regression the sign of R is the same as the sign of the slope of the regression line. When R is near 1, there is a high positive correlation between x and y. when R is near -1, there is a high negative correlation. If R is around zero, then there is no correlation between x and y. (Papacostas 2008, Montgomery 2010, Abojaradeh et. Al. 2013,2014)
5.3 Prediction Regression Models:
The dependent variables Yi include the following variables that are shown in Table 4, and the independent variables Xi include the following variables that are shown in Table 5.
Table 4: The dependent variables for each model Dependent
variables Definitions
Y1 Number of faults.
Y2 Number of fatalities.
Y3 Number of slight injuries.
Y4 Number of sever injuries.
Table 5: The independent variables for the four models (Driver Faults or Mistake) Independent
variables Drivers Mistakes
X1 Close following
X2 Lane Violation
X3 Speeding (violation of speed limit)
X4 Red Light Violation
X5 Wrong Passing
6. Analysis of Results
6.1 Development of Driver Faults Model (Y1)
The statistical input data shown in Table 3 and the output of SPSS computer program are explained in Table 6 and Table 7 as follows:
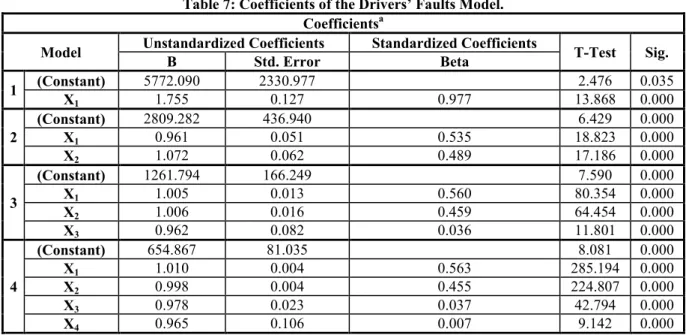
The selected model is as follow: Y1 = 2809.282 + 0.961X1 + 1.072X2
Table 6: Model Summary of the Drivers’ Faults. Model Summaryf Model R R2 Adjusted R2 Std. Error of the Estimate Change Statistics R2
Change F Change df1 df2 Sig. F Change 1 0.977a 0.955 0.950 2841.578 0.955 192.321 1 9 0.000 2 0.999b 0.999 0.999 489.439 0.044 295.364 1 8 0.000 3 1.000c 1.000 1.000 114.468 0.001 139.259 1 7 0.000 4 1.000d 1.000 1.000 31.997 0.000 83.584 1 6 0.000 5 1.000e 1.000 1.000 0.000 0.000 . 1 5 . a. Predictors: (Constant), X1 b. Predictors: (Constant), X1, X2 c. Predictors: (Constant), X1, X2, X3 d. Predictors: (Constant), X1, X2, X3, X4 e. Predictors: (Constant), X1, X2, X3, X4, X5 f. Dependent Variable: Y1
6.2 Development of number of fatalities Model (Y2)
The statistical input data shown in Table 8 and the output of SPSS computer program is explained in Table 9 as follows: The selected model is as follow:
Y2 = 14.104 + 1.108X2 + 1.039X3
6.3 Development of number of slight injuries Model “Y3”
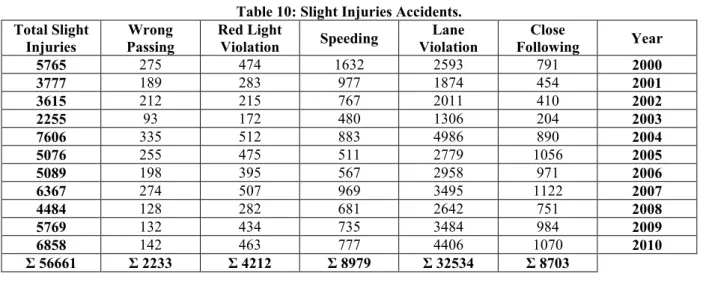
The statistical input data shown in Table 10 and the output of SPSS computer program are explained in Table 11 as follows:
The selected model is as follow: Y3 = 477.992 + 0.868 X2 + 5.501 X4
Table 7: Coefficients of the Drivers’ Faults Model. Coefficientsa
Model Unstandardized Coefficients Standardized Coefficients T-Test Sig.
B Std. Error Beta 1 (Constant) 5772.090 2330.977 2.476 0.035 X1 1.755 0.127 0.977 13.868 0.000 2 (Constant) 2809.282 436.940 6.429 0.000 X1 0.961 0.051 0.535 18.823 0.000 X2 1.072 0.062 0.489 17.186 0.000 3 (Constant) 1261.794 166.249 7.590 0.000 X1 1.005 0.013 0.560 80.354 0.000 X2 1.006 0.016 0.459 64.454 0.000 X3 0.962 0.082 0.036 11.801 0.000 4 (Constant) 654.867 81.035 8.081 0.000 X1 1.010 0.004 0.563 285.194 0.000 X2 0.998 0.004 0.455 224.807 0.000 X3 0.978 0.023 0.037 42.794 0.000 X4 0.965 0.106 0.007 9.142 0.000
a. Dependent Variable: Total Faults (Y1)
Table 8: Fatalities Accidents (2000-2010). Total Fatalities Wrong Passing Red Light Violation Speeding Lane Violation Close Following Year 287 30 3 127 124 3 2000 280 17 4 123 133 3 2001 380 34 4 85 239 18 2002 143 13 0 28 97 5 2003 436 31 4 40 341 20 2004 238 20 12 38 144 24 2005 283 12 12 55 186 18 2006 435 45 11 109 261 9 2007 277 10 7 85 168 7 2008 312 11 7 63 222 9 2009 356 12 5 66 269 4 2010 Ʃ 3427 Ʃ 235 Ʃ 69 Ʃ 819 Ʃ 2184 Ʃ 120
Table 9: Model Summary of the Fatalities Accidents. Model Summaryf Model R R2 Adjusted R2 Std. Error of the Estimate Change Statistics R2 Change F Change df1 df2 Sig. F Change 1 0.896a 0.803 0.781 40.447 0.803 36.731 1 9 0.000 2 0.985b 0.970 0.962 16.755 0.167 44.446 1 8 0.000 3 0.996c 0.991 0.988 9.552 0.021 17.617 1 7 0.004 4 0.999d 0.999 0.998 3.970 0.007 34.514 1 6 0.001 5 1.000e 1.000 1.000 0.000 0.001 . 1 5 . a. Predictors: (Constant), X2 b. Predictors: (Constant), X2, X3 c. Predictors: (Constant), X2, X3, X1 d. Predictors: (Constant), X2, X3, X1, X5 e. Predictors: (Constant), X2, X3, X1, X5, X4 f. Dependent Variable: Y2
Table 10: Slight Injuries Accidents. Total Slight Injuries Wrong Passing Red Light Violation Speeding Lane Violation Close Following Year 5765 275 474 1632 2593 791 2000 3777 189 283 977 1874 454 2001 3615 212 215 767 2011 410 2002 2255 93 172 480 1306 204 2003 7606 335 512 883 4986 890 2004 5076 255 475 511 2779 1056 2005 5089 198 395 567 2958 971 2006 6367 274 507 969 3495 1122 2007 4484 128 282 681 2642 751 2008 5769 132 434 735 3484 984 2009 6858 142 463 777 4406 1070 2010 Ʃ 56661 Ʃ 2233 Ʃ 4212 Ʃ 8979 Ʃ 32534 Ʃ 8703
Table 11: Model Summary of the Slight Injuries Accidents. Model Summaryf Model R R2 Adjusted R2 Std. Error of the Estimate Change Statistics
R2 Change F Change df1 df2 Sig. F Change
1 0.953a 0.909 0.898 496.701 0.909 89.361 1 9 0.000 2 0.988b 0.976 0.970 268.567 0.068 22.784 1 8 0.001 3 0.998c 0.996 0.995 113.294 0.020 37.956 1 7 0.000 4 1.000d 0.999 0.998 61.278 0.003 17.928 1 6 0.005 5 1.000e 1.000 1.000 0.000 0.001 . 1 5 . a. Predictors: (Constant), X2 b. Predictors: (Constant), X2, X3 c. Predictors: (Constant), X2, X3, X4 d. Predictors: (Constant), X2, X3 ,X4, X1 e. Predictors: (Constant), X2, X3 ,X4, X1, X5 f. Dependent Variable: Y3
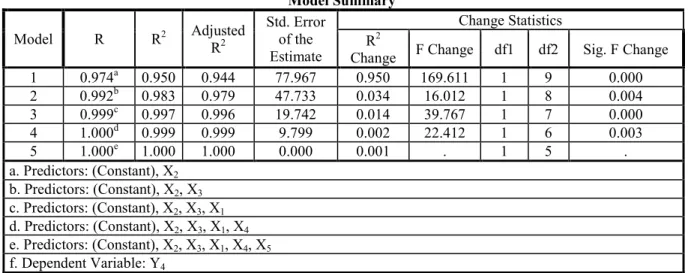
Table 12: Sever Injuries Accidents. Total Sever Injuries Wrong Passing Red Light Violation Speeding Lane Violation Close Following Year 191 13 2 81 88 7 2000 849 53 23 265 441 67 2001 683 62 42 114 393 72 2002 359 25 13 86 223 12 2003 1208 56 55 125 880 92 2004 745 50 23 72 497 103 2005 941 51 59 101 611 119 2006 1009 57 52 173 644 83 2007 861 36 48 148 562 67 2008 717 38 36 80 512 51 2009 1311 40 34 131 1016 90 2010 Ʃ 8874 Ʃ 481 Ʃ 387 Ʃ 1376 Ʃ 5867 Ʃ 763
Table 13: Model Summary of the Sever Injuries Accidents. Model Summaryf Model R R2 Adjusted R2 Std. Error of the Estimate Change Statistics R2
Change F Change df1 df2 Sig. F Change 1 0.974a 0.950 0.944 77.967 0.950 169.611 1 9 0.000 2 0.992b 0.983 0.979 47.733 0.034 16.012 1 8 0.004 3 0.999c 0.997 0.996 19.742 0.014 39.767 1 7 0.000 4 1.000d 0.999 0.999 9.799 0.002 22.412 1 6 0.003 5 1.000e 1.000 1.000 0.000 0.001 . 1 5 . a. Predictors: (Constant), X2 b. Predictors: (Constant), X2, X3 c. Predictors: (Constant), X2, X3, X1 d. Predictors: (Constant), X2, X3, X1, X4 e. Predictors: (Constant), X2, X3, X1, X4, X5 f. Dependent Variable: Y4
6.4 Development of number of sever injuries Model “Y4”
The statistical input data shown in table 12 and the output of SPSS computer program are explained in table 13 as follows:
The selected model is as follows: Y4 = 45.793 + 1.169X2 + 1.100X3 7. Discussion of Results
The multivariate linear regression analysis was used to explore the functional relationships between accident frequency and the five driver’s characteristics independent variables. The results of the analysis with the selected independent variables provided 4 models. The summary of model results is shown in Table 14.
Table 14: Summary of the Developed Regression Models
Model No. Regression Models R2
1 Y1 = 2809.282 + 0.961X1 + 1.072X2 0.999
2 Y2 = 14.104 + 1.108X2 + 1.039X3 0.970
3 Y3 = 477.992 + 0.868 X2 + 5.501 X3 0.976
4 Y4 = 45.793 + 1.169X2 + 1.100X3 0.983
7.1 Validation of Model “1” (Faults) Y1 = 2809.282 + 0.961X1 + 1.072X2
The statistical output results presented in Tables 6 and 7 show a significant F-test of the model and significant t-test for each variable. Also, the results show a strong correlation coefficient between dependent variable and independent variables (R2 = 0.999).
The application of the model on accident statistics of year 2001 shows that the predicted total accident faults are 1.7% less than observed total accidents faults which means that the developed model is valid for application to reduce total driver accident faults. The application of the model also shows that If 10% reduction of accidents on close following (X1) and lane violation (X2) each year respectively for the next ten years will
reduce the total accidents from 63562 registered in year 2011 to 2809 total accident faults. The percentage of total accident reduction is about 96% with X1= 0 and X2=0.
The accident reductions required a countermeasures program for close following and for lane violation which should be implemented by the traffic management authorities and also a (before and after) studies that are required to determine the accurate percentage of reduction for each countermeasure.
7.2 Validation of Model “2” (Fatalities) Y2 = 14.104 + 1.108X2 + 1.039X3
The statistical output results presented on tables 8 and 9 shows a significant F-test of the model and significant t-test for each variable. Also, the results show a strong correlation coefficient between dependent variable and independent variables (R2 = 0.97).
The application of the model on accident statistics of year 2001 shows that the predicted accident fatalities are 2.2% more than the observed accidents fatalities, which means that the developed model is valid for
application to reduce accident fatalities. The application of the model also shows that If 10% reduction of accidents on lane violation (X2) and speeding (X3) each year for the next ten years will reduce the accident
fatalities from 327 registered in year 2011 to 14 fatalities. The percentage of accident reduction in fatalities is about 96% with X2= 0 and X3=0.
The accident reductions required a countermeasures program for lane violation and speeding that should be implemented by the traffic management authorities and also a (before and after) studies that are required to determine the accurate percentage of reduction for each countermeasure.
7.3 Validation of Model “3” (Slight Injuries): Y3 = 477.992 + 0.868 X2 + 5.501 X4
The statistical output results presented in tables 10 and 11 shows a significant F-test of the model and significant t-test for each variable. Also the results show a strong correlation coefficient between dependent variables and independent variables (R2 = 0.976).
The application of the model on accident statistics of year 2001 shows that the predicted accident slight injuries are 3% more than the observed slight injuries accidents, which means that the developed model is valid for application to reduce slight injuries accident. The application of the model shows also that If 10% reduction of accidents on lane violation (X2) and red light violation (X4) each year for the next ten years will reduce the
slight injuries accident from 7088 registered in year 2011 to 478 slight injuries. The percentage of accident reduction in slight injuries accidents is about 93% with X2= 0 and X4=0.
The accident reductions required a countermeasures program for lane violation and red light violation that should be implemented by the traffic management authorities and also a (before and after) studies that are required to determine the accurate percentage of reduction for each countermeasure.
7.4 Validation of Model “4” (Sever Injuries) Y4 = 45.793 + 1.169X2 + 1.100X3
The statistical output results presented on tables 12 and 13 shows a significant F-test of the model and significant t-test for each variable. Also the results show a strong correlation coefficient between dependent variable and independent variables (R2 = 0.983).
The application of the model on accident statistics of year 2001 shows that the predicted accident sever injuries are 4% more than the observed sever injuries accidents which means that the developed model is valid for application to reduce sever injuries accident . The application of the model shows also that if 10% reduction of accidents on lane violation (X2) and speeding (X3) each year for the next ten years will reduce the sever
injuries from 1100 registered in year 2011 to 46 sever injuries. The percentage of accident reduction in sever injuries is about 97% with X2= 0 and X3=0.
The same countermeasures and before and after studies for model 2 are required for model 4.
8. Reliability of the Developed Models
Because of the social relationship and the economic considerations, the traffic accidents are not 100% reported. This is obvious through a face to face interview with the experts in traffic safety in many occasions. Therefore it is estimated that traffic accidents in Jordan are not reported for about 20% to 25% of property damages, and about 10% to 15% of slight injuries and about 5% to 10% of sever injuries. According to previous estimations, the authors believe that the reliability of the developed model could be between 75% and 80%.
The percentage of reliability may be increased if the accident injuries divided in categories scale and included in the accident and medical reports as recommended by FHWA. The recommended scale is called AIS (Abbreviated Injury Scale) (2). The scale is divided to (Fatal, Critical, sever, serious, moderate, and minor) which explain exactly the type of injuries and help to estimate the cost of each type of accident.
9. Conclusions
1) The predicted models resulted from SPSS computer program indicate a very strong correlation coefficient between dependent variable and independent variables. The statistical results also show a high significant F-test and t-test for the models and variables respectively.
2) The validation of the developed predicted models indicate small error ( less than 5%) with the observed statistical registered data for the year 2011 according to Jordan Traffic Institute.
3) It is possible to estimate the reliability of the models to be between 75% and 80% because the study is depending on the government yearly accident report provided by Jordan Traffic Institute.
4) The predicted models can be applied as a part of Highway Safety Improvement Program (HSIP) to reduce traffic accidents in Jordan.
10. Recommendations
According to the previous results and the conclusions for the developed predicted models, the following countermeasures can be recommended to apply the models and in order to reduce total accidents, slight injuries, sever injuries, and fatalities that are related to selected driver mistakes (Faults).
1) For close following, or tailgating (X1), it is required to apply a high technology instrument to detect this
driver faults and to increase the low enforcement in order to reduce accidents resulting from close following. Advanced warning and educational signs are important to be installed along the streets. A display of moving warning to pay more attention to the drivers to not drive closely.
2) For lane violation (X2) on multilane highways and on principle arterials, it is recommended to detect this
driver faults by the traffic police and apply the same recommendation for the close following driver faults. 3) For speeding or violation of the speed limit(X3), a special attention should be taken to reduce the accident
due to driving more than the speed limit. Speed reduction strategies are highly recommended to be applied. Countermeasures such as warning signs, hump, bump, pavement grooving or stripping are recommended to reduce speeding. High technology instruments to detect the violation of speed limit are also required.
4) For red light violations (X4), which are the most fatal or injury on signalized intersections. Optimization of
cycle length, increasing the ALL-Red clearance to 2 seconds interval, and redesign the yellow timing may reduce the violation on red interval.
5) For wrong passing (X5) on two- lane highway may need a special design treatment to avoid the violation of
wrong passing such as passing lane, climbing lane, turnout, paved shoulder, tow way left-turn lane.
6) All the above recommended countermeasures required a before- after studies to determine the accident reduction factor for each type of countermeasure.
7) More researches are recommended in this field with more driver violations (independent variables) are needed to reduce the total number of accident specially the accidents causing fatalities and injuries.
ACKNOWLEDGEMENT
The authors of this paper would like to acknowledge Professor Dr. Basim Jrew at Al-Isra University for his valuable guidance and contribution to this research study. Also, our thanks for the following engineering students at Al-Isra University, Saif Hamdallah and Mohammed Al-Kahla, for their valuable contribution to this study during graduation project. Their work is highly appreciated.
REFERNCES
Abojaradeh M., Msallam M., and Jrew B., (2014). “Evaluation and Improvement of Signalized Intersections in Amman City in Jordan". Journal of Environment and Earth Science issued from IISTE USA. Volume 4, No. 21, 2013. pp 156-169.
Abojaradeh M., and Jrew B., (2014).“The Effect of Driver Behavior Mistakes on Traffic Safety". Journal of Civil and Environment Research issued from IISTE USA. Volume 6, No. 1, 2014. pp 39-54.
Abojaradeh, M., Abu-Khurma M., Msallam M., and Jrew B., (2014). "Evaluation and Improvement of Traffic Flow of Signalized Intersections on Part of Zarqa Expressway in Zarqa City in Jordan". published and presented in The Fourth Jordan International Conference and Exhibition for Roads and Transport: “High Priority Issues in the Future Transport Sector”, 12-13/03/2014 Amman, Jordan.
Abojaradeh M., and Jrew B., (2013). “Development of Statistical Prediction Models to Reduce Fatal and Injury Traffic Accidents". Journal of Environment and Earth Science issued from IISTE USA. Volume 3, No. 11, 2013. pp 54-65.
Abojaradeh M., (2013), "Evaluation of Pedestrian Bridges and Pedestrian Safety in Jordan" Journal of Civil and Environment Research issued from IISTE USA. Volume 3, No. 1, 2013. pp 66-78.
Abojaradeh M., (2013), “Traffic Accidents Prediction Models to Improve Traffic Safety in Greater Amman Area". Journal of Civil and Environment Research issued from IISTE USA. Volume 3, No. 2, 2013. pp 87-101. Abojaradeh M., (2013), “Travel Time and Delay Study to Improve Public Transit Systems in Jordan". (2013) Journal of Environment and Earth Science issued from IISTE USA. Volume 3, No. 4, 2013. pp 85-97.
Abojaradeh M., Jrew K., and Abojaradeh D., (2009), Traffic Accidents Regression Prediction Models in Amman Area. The 4th conference of the Jordan Society for Scientific Research, Jordan 2009.
Abojaradeh, M., Jrew B., and Abojaradeh A. (2012), " The Effect of Driver Behavior Mistakes on Traffic Safety in Jordan" published and presented in the 6th Traffic Safety in Jordan by the Jordan Traffic Institute, Jordan 19-20 November 19-2012.
Aloush M. and Jrew B., (2008), Analysis of accident prediction model for Marka area in Amman. Proceeding of the fifth Jordanian Traffic Safety conference, Jordan 2008.
Garber, N.J., Hoel, L.A. (2010), Traffic and Highway Engineering, 4th SI Edition, USA.
International Journal of Natural & Engineering Science.
Jordan Traffic Safety Institute (2000-2012), Traffic Accidents in Jordan, Annual Reports 2000-2012.
Jrew B., Abojaradeh M., and Abojaradeh E., (2012). "Development of Statistical Prediction Models to reduce Fatal and Injury Accidents in Jordan" published and presented in the 6th Traffic Safety in Jordan by the Jordan Traffic Institute, Jordan 19-20 November 2012.
Jrew B., Al-Ani H., & Salih A., (2007), Development of accident prediction models for Arbil urban area. Proceeding of Jordanian International conference on decision making in transport sector, session 1A. Jordan. Montgomery D., Runger G. (2010), Applied Statistics and Probability for Engineers Fifth Edition, USA. National Highway Traffic Safety Administration NHTSA (2010), USA 2010.
Papacostas C., Prevedonros P. (2008), Transportation Engineering and Planning, Fourth Edition, USA. Public Security Directorate (2000-2012), Annual Reports, Jordan 2000-2012.
Statistical Package for Social Sciences software (SPSS) (2009), version 17.
Svensson A.,& Hyden C., (2006), Estimating the severity of safety related behavior Accident analysis and prevention V 28, pp 379-385.
Wikipedia (2013), http://en.wikipedia.org/
World Health Organization (WHO) (2007) Report.
Dr. Mohammad Abojaradeh
Dr. Mohammad Abojaradeh Ph.D., P.E., is an associate professor in the Faculty of Engineering Technology, Department of Civil Engineering, Zarqa University. He is a Ph.D. graduate of Arizona State University USA in 2003, and his Master degree from Jordan University in 1997, and his bachelor degree from Kuwait University in 1985. He is a registered Professional Engineer Registration # 40201 Arizona USA October 2003. Dr. Abojaradeh has over 25 years of experience in civil engineering consultation and management and over 10 years in academic teaching and research in the fields of transportation, highway, and traffic. His areas of expertise include pavement materials design, advanced laboratory testing, field performance evaluation, the performance and improvement of pavement materials, traffic studies and traffic and pedestrian safety, highway engineering studies, and in transportation engineering studies. He has over 20 publications in his field. Dr. Abojaradeh is a member of several professional organizations such as the ASCE American Society of Civil Engineers USA, ITE Institute of Transportation Engineers USA, JEA Jordan Engineer Association Jordan, and KES Kuwait Engineers Society Kuwait.