Research Papers
Saïd Business School RP 2014-1
The Saïd Business School’s working paper series aims to provide early access to high-quality and rigorous academic research. The Shool’s working papers reflect a commitment to excellence, and an interdisciplinary scope that is appropriate to a business school embedded in one of the world’s major research universities.
Investment-Banking Relationships: 1933-2007
Alan D. Morrison
Saïd Business School, University of Oxford
Aaron Thegeya
International Monetary Fund (IMF)
Carola Schenone
University of Virginia, McIntire School
William J. Wilhelm
University of Virginia, McIntire School of Finance
1933-2007
∗
Alan D. Morrison,
Saïd Business School,
University of Oxford
Aaron Thegeya,
International Monetary Fund
Carola Schenone,
McIntire School of Commerce,
University of Virginia
William J. Wilhelm, Jr.,
McIntire School of Commerce,
University of Virginia
January 8, 2014
∗We are grateful to Ron Burt, Zhaohui Chen, Brian Coulter, Leora Friedberg, Mike Gallmeyer, Bill Greene, Anna
Kovner, Pedro Matos, Hamid Mehran, Stavros Peristiani, Chris Yung and seminar participants at the Federal Reserve Bank of New York, University of Melbourne, University of New South Wales, University of Sydney, William & Mary and the Oxford University Centre for Corporate Reputation 2013 Symposium for helpful comments. Paul Bennett, Steve Wheeler, Janet Linde (New York Stock Exchange), Tom Nicholas (Harvard Business School), and the staff at the Mudd Library (Princeton University) provided generous assistance in gaining access to the historical data. Patrick Dennis provided valuable programming assistance and Brendan Abrams, Ye Feng, Vaibhav Kapoor, Thomas Knull, Qiao Ma, Mary Weisskopf, and David Wilhelm provided excellent research assistance. We gratefully acknowledge financial support from the Oxford Centre for Corporate Reputation (Morrison and Thegeya); the Ledford Faculty Fellowship at the McIntire School of Commerce (Schenone); and the Walker Fund and the King Fund for Excellence at the McIntire School of Commerce (Wilhelm).
Abstract
We study the evolution of investment bank relationships with issuers from 1933–2007. The degree to which issuers conditioned upon prior relationship strength when selecting an investment bank declined steadily after the 1960s. The issuer’s probability of selecting a bank with strong relationships with its competitors also declined after the 1970s. In contrast, issuers have placed an increasing emphasis upon the quantity and the quality of their investment bank’s connections with other banks. We relate the structural changes in bank/client relationships beginning in the 1970s to technological changes that altered the institutional constraints under which security issuance occurs.
1. Introduction
Securities transactions are the focal point of relationships between investment banks and their corporate clients. Until the middle of the 20th century these relationships were so stable that the small banking partnerships that dominated the industry generally were willing to provide advisory services on the expectation of being awarded future underwriting mandates.1 With the rise of large, full-service banks, client relationships have become less stable, more fee-for-service oriented, and increasingly subject to concern for conflicts of interest and violations of client trust.2 In this paper we study the evolution of investment banking relationships from 1933 through 2007 in an attempt better to understand the sources and consequences of this profound change in the structure of capital markets.
Our analysis draws on a hand-collected dataset that includes all public and private underwritten securities transactions over $1 million from 1933–1969. We combine this dataset with post-1970 coverage provided by Securities Data Corporation (SDC) and follow Ljungqvist, Marston, and Wilhelm (2006; 2009) in measuring the state of a client’s banking relationships as each bank’s dollar share of the client’s past securities offerings. We use a similar strategy to measure the state of a bank’s relationships within industry groups (4-digit SIC categories). Finally, we use graph-theoretic methods to measure a bank’s connectedness with other banks via syndicate participations. We then estimate conditional logit models in which issuers condition the assignment of underwrit-ing mandates on these bank-specific attributes.
The 1933 (Glass-Steagall) Banking Act provides a natural starting point for a long-run analy-sis of investment-banking relationships because it upset client relationships that rested heavily on commercial banks’ ability to underwrite securities offerings and thereby created new opportunities
1Eccles and Crane (1988) identify this behavior as a “loose linkage” between fees and service. Ellis (2009, ch.4) identifies the 1955 merger that created Warner Lambert Pharmaceuticals as the first instance in which Goldman Sachs charged a fee for merger advice. Lazard was viewed as a pioneer for developing its fee-based merger advisory business during the 1960s. Morgan Stanley did not create a mergers and acquisitions department until 1972. See Morrison and Wilhelm (2007, pp. 255–259) and Carosso (1970, p. 502) for further discussion.
2Goldman Sachs recently attempted a spectacular balancing act by advising both sides of Kinder Morgan’s pro-posed $21 billion acquisition of El Paso Corporation while also holding two board seats and maintaining a $4 billion financial stake in Kinder Morgan. A stockholder appeal for a preliminary injunction elicited a detailed and entertain-ing analysis of the case from Chancellor Strine of the Delaware Court of Chancery. See “In Re El Paso Corporation Shareholder Litigation,” Civil Action No. 6949-CS, February 29, 2012. Goldman’s experience is not unique.
for private (investment) banks.3 The Act was followed in close succession by further regulatory intervention aimed at weakening bank relationships, culminating with an unsuccessful 1947 civil suit filed by the U.S. Justice Department (U.S. v. Henry S. Morgan et al.) against 17 investment banks charged with conspiring through their syndicate connections to monopolize the U.S. securi-ties business.
During the early part of the sample period we find that, notwithstanding this regulatory up-heaval, issuers deciding whether to (re)engage a bank to manage a transaction placed increasing weight on the strength of their relationship with the bank, and upon the state of the bank’s rela-tionships with the issuer’s competitors. On the other hand, a bank’s syndicate connections had a modest but negative effect on its selection. In other words, during the early part of our sample pe-riod, it appears that the influence of bank/client relationships strengthened in the face of regulatory action intended to weaken them and that, contrary to the motivation forU.S. v. Henry S. Morgan et al., strong syndicate connections provided little, if any, competitive advantage.
In contrast, we find that the influence of bank/client relationships began to weaken, and that the importance of syndicate ties began to strengthen, in the 1960s. By the time that commercial banks began to reenter the securities underwriting business, the influence of bank/client relationships had stabilized at a level similar to that observed in the immediate aftermath of the post-Depression reg-ulatory effort. Similarly, issuers responded much less favorably to banks with strong relationships within the issuer’s SIC category after the 1970s. On the other hand, by the last decade of the sam-ple period, the increase in a bank’s odds of being selected for a one unit increase in our measure of the strength of its syndicate connections was about 8 times larger than its estimated level for the 1960s.
We explain the declining influence of bank/client relationships by first recognizing they rest upon the banks’ ability to build and preserve reputations for employing skillful and trustworthy bankers. Morrison and Wilhelm (2004) identify limited organizational scale and relative immobil-ity of human capitalists as being conducive to the building and preservation of this type of institu-tional reputation. We show that these conditions were met by banking partnerships throughout the 3By the end of the 1920s two large commercial banks, Chase National and National City of New York, sponsored over half of all new securities offerings. See Morrison and Wilhelm (2007, p. 210).
early part of our sample period. During the early part of the sample period, bankers generally spent their entire careers with a single, typically quite small, banking partnership. It was not unusual for a banker to be responsible for a specific client relationship for many years or decades. Combining long-term partnership commitments with longstanding client relationships provided bankers with the opportunity to build client trust and the incentive to protect their individual and institutional reputations for having done so.
We document the longevity of individual bankers and their long-term commitments to a single institution by tracking the identity of bank partners annually. We also illustrate bankers’ long-term responsibility for specific clients by documenting the number and length of individual bankers’ directorships through the first part of our sample period for the 17 defendant banks inU.S. v. Henry S. Morgan et al. Our data provide evidence that, starting in the late 1950s and with increasing force through the 1970s, the conditions that contributed to long-lived personal client relationships were eroded. Our bank-choice model indicates that issuers responded negatively to the departure of bank partners during the 1960s and 1970s.
These changes coincided with an unprecedented period of technological and organizational upheaval in the investment banking industry. Computers were introduced to Wall Street around 1960, and immediately started to change the way that investment banks conducted business. These changes culminated in the 1970 decision by the New York Stock Exchange’s (NYSE) membership (including virtually all of the major banks) to permit members to operate as public corporations. Morrison and Wilhelm (2008) argue that the technological changes undermined reputation con-cerns among investment bankers; at precisely the same time, our data reveal that the influence of bank-client relationships began to weaken.
Our industry-level analysis of bank relationships suggests that issuers valued industry expertise throughout the sample period. The substantial decline in the importance of same-industry relation-ships during the 1980s is consistent with evidence provided by Asker and Ljungqvist (2010) that potential conflicts of interest and leakage of strategic information caused large issuers to avoid engaging banks that also managed transactions for other firms in the same industry.4 Coupled with 4See Bodnaruk, Massa, and Simonov (2009) and Griffin, Shu, and Topaloglu (2012) for mixed evidence on whether client information is exploited for trading purposes.
the simultaneous decline in the influence of bank/client relationships and the negative effect of banker turnover, these results suggest that trust between banks and their clients started to erode in the 1970s and 1980s.
The increasing influence of syndicate connections upon issuer mandates was coincidental with the rise of institutional investing. We suggest that syndicate connections are of greatest interest to issuers when they promote efficiency in information acquisition from (institutional) investors, as in Benveniste and Spindt (1989). Pichler and Wilhelm (2001) argue that the syndicate structure is an efficient mechanism for maintaining the investor relationships that are central to information acquisition. To the extent that trust between banks and their clients was declining during the latter part of the sample period, issuers may also have valued syndicate connections more highly because they created competitive pressure and cross-monitoring opportunities among bankers. Corwin and Schultz (2005) and Morrison and Wilhelm (2007, pp. 80–81) suggest that the syndicate aligns the lead underwriter’s incentives with those of the issuer by rewarding co-managers for reveal-ing lead-underwriter malfeasance. Co-managers have incentive to communicate malfeasance if doing so increases the likelihood that they will be selected to manage the issuer’s future transac-tions. Ljungqvist, Marston, and Wilhelm (2009) provide evidence that co-management is indeed a stepping stone to management opportunities.
Our paper contributes to a growing body of work studying how issuers assign underwriting mandates for their securities offerings.5 Early work by Krigman, Shaw, and Womack (2001), Ljungqvist and Wilhelm (2005), and Chitru, Gatchev, and Spindt (2005) examined why firms switch banks between their initial public offering of equity (IPO) and first subsequent equity offer-ing. Our work is more closely related to that of Ljungqvist, Marston, and Wilhelm (2006; 2009). For the 1993–2002 period, their studies document a strong influence of the state of bank/client relationships on the selection of lead managers and co-managers for both debt and equity issues. Our findings for this period are similar but we show that the effect has diminished since 1970.6
5See Ljungqvist (2007) and Eckbo, Masulis, and Norli (2007) for reviews of the broader literature on equity offerings.
6Yasuda (2005) examines the issuer’s bank choice for a sample ofdebtissues brought to market in the United States between January 1, 1993 and August 31, 1997. For our purposes, her central finding is that issuers were more likely to choose banks with which they maintained alendingrelationship during the early stages of commercial bank entry to debt underwriting covered by her sample period. Yasuda (2007) reports similar findings for the Japanese
Our use of eigenvector centrality to study bank connectedness is motivated by recent work indi-cating that network connections influence the performance of financial intermediaries.7 Ljungqvist et. al. (2009) report that strong syndicate connections over the 1993-2002 period weakly strength-ened a bank’s bid for lead management (and only for debt offerings) but they find stronger evidence of a positive effect on the likelihood of being appointed a co-manager. We also document a positive effect of syndicate connections on lead manager choices during this period, but show that the effect was much stronger during the 2000s. Hochberg, Ljungqvist, and Lu (2007) report that funds run by better-networked venture capital firms perform better than their peers and that their portfolio companies are more likely to gain subsequent financing and achieve a successful exit. Hochberg, Ljungqvist, and Lu (2010) show further that strong local venture capital networks pose a barrier to entry for nonlocal venture capitalists.
Finally, our documentation of weakening client relationships and diminishing institutional commitment among bankers provides a suggestive backdrop for recent theoretical work aimed at better understanding why reputation concerns appear to have become less effective for control-ling conflicts of interest within investment banks. Chen, Morrison, and Wilhelm (2013b; 2013a) study the tension between a bank’s interest in maintaining a reputation for trustworthy behavior and individual bankers’ incentive to signal their ability by taking actions that conflict with their clients’ interests. In their models, the technological changes that we associate with weakening client relationships can undermine banks’ incentives to curb self-interested behavior within their ranks and give rise to the sort of transactions that have been subject to criticism in the aftermath of the recent financial crisis. The asset securitization market has been a prominent focal point for such criticism. Winton and Yerramilli (2011), Hartman-Glaser (2013), and Griffin, Lowery, and Saretto (2013) all develop models in which reputation concerns can fail to resolve conflicts of interest in this setting.
bond market. Schenone (2004) documents benefits to IPO issuers that select a bank with which they have a lending relationship and Benzoni and Schenone (2010) find no evidence of conflicts of interest in such cases.
7See Bonacich (1972) for development of the eigenvector centrality measure and Podolny (1993) for an early application to investment-banking syndicates.
2. Historical Background
Because our study of banking relationships cuts across a wide time span, much of which has been subject to limited statistical analysis, we begin with a brief summary of the events that shaped banks’ relationships both with their clients and with one another during the early decades of our sample period. Carosso (1970), Medina (1954 [1975]), and Seligman (1982) provide authoritative accounts of events through the first half of the sample period. Morrison and Wilhelm (2007, ch. 7–8) and Morrison and Wilhelm (2008) provide further detail on events during the latter part of the sample period, as well as a discussion of the influence of technological change on the industry.
From 1933 through the early 1950s, investment banks were subject to political and regulatory efforts intended to weaken their ties with clients and with one another. The 1933 Banking Act was signed into law on June 16, 1933 and was followed on June 6, 1934 by the Securities Ex-change Act. For our purposes, the Banking Act’s separation of deposit collection and lending from securities market activity (to be completed by June 16, 1934) is particularly relevant, because it forced the reorganization of many important banks, thereby potentially upsetting existing banking relationships.
Some prominent banks (e.g., Goldman Sachs, Kuhn Loeb, Lehman) already specialized in se-curities offerings and were relatively unaffected by the Banking Act. By contrast, in June 1934 J.P. Morgan formally discontinued its investment banking operations, and had effectively left the business when the Banking Act was enacted. It was not until September 16, 1935 that several J.P. Morgan partners (Harold Stanley, Henry S. Morgan, and William Ewing) left the firm to incorpo-rate Morgan Stanley & Co. They were joined by former partners from Drexel & Co. and soon thereafter by two officers from the former securities affiliate of Guaranty Trust. The fact that the founding members of the new firm had considerable experience in the industry (each of the three Morgan men had been a partner for seven years when J.P. Morgan discontinued its investment-banking operations) contributed to the new firm’s ability quickly to gain a leading position among underwriters. First Boston and Smith Barney followed similar paths, bringing together senior bankers from several pre-1933 banking organizations (Medina, 1954 [1975]).
quo soon followed. The 1938 Chandler Act implemented a statute-based approach to bankruptcy reorganization that significantly diminished the value of bank relationships as well as banks’ advi-sory role. The Act was followed by a sharp increase in private placements (especially debt), which further diminished the influence of banks in securities issuance (Morrison and Wilhelm, 2008).8
Despite repeated attempts to weaken the ties between issuers and bankers, a 1940 SEC Public Utility Division study noted that six leading New York banks managed 62% of bond issues and 57% of bond, preferred stock and common stock issues between January 1934 and June 1939. Morgan Stanley alone managed 81% of high-grade bond issues, including 70% of high-grade utility bond issues. The study alleged that such concentration reflected “an unwritten code whereby once a banker brings out an issue, the banker is deemed to have a recognized right to all future public issues of that company.”9
The SEC responded in 1941 by enacting Rule U-50, which mandated competitive bidding (instead of the traditional negotiated underwriting) for the underwriting of utility issues. It was followed in 1944 by the Interstate Commerce Commission’s requirement that railroad issues by subject to competitive bidding. The new rules had the desired effect in the sense that they enabled less prominent banks, most importantly Halsey Stuart and Merrill Lynch, to gain ground on the leading banks. To the extent that gains were made by breaking the “unwritten code,” they weakened bank-client relationships as we measure them.
U.S. v. Henry S. Morgan et al. posed a major challenge to bank syndicate relationships. The 1947 civil suit, filed under Sections 1 and 2 of the Sherman Act, charged 17 investment banks with “entering into combination, conspiracy and agreements to restrain and monopolize the securities business of the United States [. . . ]”, and it identified the underwriting syndicate as a primary ve-hicle for the alleged abuse of longstanding banking relationships. The opinion rendered by Judge
8Carosso (1970, p. 430) argues that “The ability of great corporations to finance themselves and the growth of private placements had diminished significantly the role and influence of investment bankers in the economy.” In the extreme, AT&T, for example, sold $150m of $730m of securities issued between 1935 and 1940 without the assistance of investment bankers – i.e., Morgan Stanley (Carosso, 1970, p. 405). Also see Calomiris and Raff (1995, p. 124–132) on the rise of private placements.
9“The problem of maintaining arm’s length bargaining and competitive conditions in the sale and distribution of securities of registered public utility holding companies and their subsidiaries,” Report of the Public Utilities Division, SEC, December 18, 1940. The study is quoted by Seligman (1982, p. 218) in a detailed discussion of the political backdrop for the promulgation of the compulsory bidding rules. Also see Carosso (1970, ch. 20).
Harold Medina in October 1953 (and filed on February 4, 1954) dismissed all charges against the defendants and castigated the government for the weakness of its case.10 With respect to the syndi-cate system Medina found “[. . . ]no concert of action, no agreement and no conspiracy, integrated over-all or (Medina, 1954 [1975], p. 119).
The investment syndicate’s distribution function in 1940s had changed significantly from the start of the century. Banks’ securities distribution operations were quite small in the 1900s, and they were concentrated on the East Coast. As a result, underwriting syndicates routinely remained in place for a year or more, as syndicate members travelled to peddle syndicates to individual investors. (Medina, 1954 [1975], pp. 22-23). Distribution improved as retail brokerage networks expanded (e.g., Perkins (1999, p. 219)) and by the late 1940s syndicate contracts usually were written for 15-30 days (Medina, 1954 [1975], p. 43).
The 1940s also witnessed the early stages of changes in the investor community that would re-shape both syndicate and client relationships. Institutional ownership of U.S. equities outstanding doubled from 7% to 14% between 1945 and 1960 (Federal Reserve Flow of Funds, L. 213). Mutual fund assets grew from $448 million to $3.5 billion between 1940 and 1952, while pension fund assets grew from $3 billion in 1947 to $18 billion in 1955. As their assets grew rapidly during the 1940s, life-insurance companies became dominant investors in the burgeoning market for private placements, to the point of crowding out investment banks by investing in direct placements.11
By the 1950s, The NYSE’s daily trading volume averaged about 2.2 million shares on open interest of 5.6 billion shares. Average daily trading volume stood at about 3 million shares in 1960; it then nearly quadrupled by 1970, and then quadrupled again by 1980 (Morrison and Wilhelm, 2007, pp. 232-233). The evolution of block trading provides a more direct account of the influence of institutional trading. In 1965, the NYSE reported 2,171 block trades accounting for about 3% of reported volume. By 1972 the number of block trades had grown about 15 times to 31,207 trades (18.5% of volume) and then tripled by 1979 (97,509 transactions, 26.5% of volume).
10The case did not go to trial until November 28, 1950 and it concluded on May 19, 1953. In the interim, counsel for the government and defendant banks produced, in the words of Judge Medina, “truckloads of documents[. . . ] The precise number of the hundreds of thousands of documents[. . . ] will probably never be known.” (Medina, 1954 [1975], p. 213).
In spite of fixed commission rates (which were abolished in May, 1975), the rapid increase in trading volume proved a life-threatening burden for many investment banks. The physical exchange of stock certificates was necessary to close transactions, and back office capacity was challenged by the paperwork required to manage the flood of new business. Although fixed com-missions prevented price competition, early adopters of nascent batch-processing computer tech-nology, such as Merrill Lynch, gained a competitive edge in the back office that ultimately proved to be decisive. By the late 1960s the industry was in the midst of a back-office crisis stemming from the inability of many firms to close transactions in a timely manner. Morrison and Wilhelm (2007, pp. 235-236) observe that “[l]osses associated with ‘too much business’ led approximately 160 NYSE member firms either to merge with competitors or to dissolve their operations.”
Among the firms that survived, Merrill Lynch, Goldman Sachs, and Salomon Brothers were noteworthy for having strengthened their investor relationships by investing heavily in block trad-ing and arbitrage services (New York Times, July 17, 1971). With other firms claiming that they were forced to decline institutional business for want of capital to fund investments in technology, the NYSE membership decided in 1970 to permit member firms to operate as public corporations. Investment banks went public in two waves (Morrison and Wilhelm, 2008). Most banks with sub-stantial retail brokerage operations had gone public or combined with a public firm by the end of the 1970s. By 1987, among the major wholesale banks, only Goldman Sachs and Lazard remained private partnerships.
As we note above, mergers and acquisitions advisory work evolved into a significant fee-for-service business during the 1960s and 1970s. The 1978 Bankruptcy Code reversed the provisions in the 1938 Chandler Act that prevented banks from taking an active role in corporate reorga-nization. The confluence of fee-for-service advisory operations, the new bankruptcy code, the development of the market for junk bonds, and the leveraged buyout helped to fuel 172 success-ful hostile takeovers and a total of 35,000 completed mergers in the U.S between 1976 and 1990 (Morrison and Wilhelm, 2007, pp. 251-262). Hostile takeovers were viewed from the outset as an affront to client relationships.12
12See Armour and Skeel (2007). John Whitehead justified Goldman’s policy of not working for hostile bidders during this period “partly as a matter of business ethics, but primarily as a matter of business judgment” (Ellis, 2009,
At the same time as client relationships were placed under stress by banks’ advisory work for hostile bidders, the SEC, in March 1982, implemented Rule 415, which provided for shelf registra-tion of securities offerings, with the explicit intenregistra-tion “to produce a decline in the market power of bankers in their relationship with issuers.” (Calomiris and Raff, 1995, p. 121). Bhagat, Marr, and Thompson (1985) suggest that shelf registration had the potential to intensify competition among underwriters by reducing the costs of informal competitive bidding for underwriting mandates. An initial flurry of activity in the market suggested that it may have had the desired effect. From March, 1982 through May, 1983 there were 508 shelf registrations worth a total of $79.3 billion. About 25% of equity offerings between 1982 and 1983 appearing in the sample studied by Denis (1991) were shelf registered.
On March 18, 1987 the Federal Reserve Board approved Chase Manhattan’s application to underwrite and deal in commercial paper in a commercial finance subsidiary. Approval of similar applications from Citicorp, J.P. Morgan, and Bankers Trust followed soon thereafter. It was not until January 18, 1989 that commercial banks gained approval for limited underwriting of corporate debt. As of September 1990 only J. P. Morgan (11), Citibank (14), Chemical Bank (17), Bankers Trust (19), and First Chicago (20) ranked among the top 20 debt underwriters. The Fed did not grant equity underwriting powers to commercial banks until September 1990 (Benveniste, Singh, and Wilhelm, 1993). The 1933 Banking Act was repealed in 1999 by the Gramm-Leach-Bliley Act.
Figure A.1 in the appendix summarizes the key events of this Section.
3. Data
Details of securities offerings between 1933 and 1969 are obtained from two sources. Counsel for several defendants inUnited States v. Henry S. Morgan, et al assembled details of all under-written issues of $1,000,000 or more from July 26, 1933 to December 31, 1949.13 The records p. 271).
13United States v. Henry S. Morgan, et al., doing business as Morgan Stanley & Co.; et al, (Civil Action No.
43-757),United States District Court for the Southern District of New York. Additional information related to the case is drawn either from theCorrected Opinion of Judge Harold R. Medinaor from the Harold R. Medina Papers housed at the Mudd Library, Princeton University.
were subsequently published in 1951 asIssuer Summaries.14 Data for 1950s and 1960s deals were collected from theInvestment Dealers’ Digest.15 The Appendix provides a detailed description of the data and collection process for the 1933-1969 period. Data for issues between 1970 and 2007 were taken from the Thomson Reuters SDC database. To maintain continuity with the pre-1970 data, we exclude foreign exchange-listed issues, foreign-traded issues, and issues listed by non-US incorporated entities. SDC provides incomplete records for issues between 1970 and 1979. For example, there is no private placements data for this period; SDC was unable to provide more complete data.
The full sample dataset (1933–2007) contains 287,332 transactions. To ensure consistency with the related literature, we exclude issues by financial institutions (SIC codes 6000–6999), government and public bodies (SIC codes 9000–9999), agricultural and natural resources compa-nies (SIC codes 0–1499), electric, gas, and sanitary services compacompa-nies (SIC codes 4900–4999), pipelines other than natural gas (SIC codes 4611–4619), and the United States Postal Service (SIC code 4311). We also excluded deals whose industry was recorded as falling into one of these categories.16
For the post-1969 period, for which we had more complete information, we made some ad-ditional exclusions. Deals for which the underwriter is recorded as “No Underwriter” or “Not Available” are excluded; so were issues by funds, depositaries, leveraged buyout deals, issues by limited partnerships, rights issues, unit issues, regulation S issues, World Bank issues, and self-funded issues.
Finally, we include only straight equity issues that are classified as common, ordinary, cumu-lative, or capital shares. We retain only those preferred deals that are identified in the source data as cumulative, convertible, capital, or certificate. We exclude floating, indexed, reset, serial, and
14Sullivan & Cromwell,Issuer summaries; security issues in the United States, July 26, 1933 to December 31,
1949. Prepared by counsel for defendants in United States v. Henry S. Morgan, et al., doing business as Morgan Stanley & Co.; et al. (Baker Old Class JS.065 U571h). For further discussion of the data and its collection, see the appendix toCorrected Opinion of Judge Harold R. Medina.
15Investment Dealers’ Digest, Corporate Financing, 1950-1960, 1961; Investment Dealers’ Digest, Corporate Fi-nancing, 1960-1969.
16Specifically, we excluded deals whose industry was recorded as “Other Finance,” “REIT,” “Real Estate,” “Invest-ment Bank,” “S&L/Thrift,” “Invest“Invest-ment Fund,” “Mortgage Bank,” “Agriculture,” “Fedl Credit Agcy,” “Gas Distribu-tion,” “Natural Resource,” “Oil/Gas Pipeline,” or “Water Supply.”
variable coupon debt issues, and retain other debt deals only if they are classified as bonds, deben-tures, notes, or certificates, and if they have a maturity of at least two years. These exclusions trim the sample to 63,302 transactions.
Table I provides an overview of the banking landscape from the perspective of this subsample by reporting the top 30 banks by market share for the 1933-1969 and 1970-2007 periods. Concen-tration levels increased markedly between these periods. The top 30 banks measured by proceeds held about 84% of market share during the first half of the sample and about 91% during the second half. The top 5 (10) banks accounted for 40% (61%) of proceeds during the first half of the sample and about 50% (75%) during the second half.17
3.1. The Issuer’s Bank Choice Set
Our econometric analysis involves the estimation of bank choice models for 7 time periods that, with the exception of the first, correspond to decades. The issuer’s choice set for a given transaction includes the top 30 banks ranked by the dollar volume of transactions for which they served as the lead manager during the decade in which the transaction took place. This means that transactions managed by banks outside of the top 30 in a given decade are excluded from the analysis.18 We use the 1933-1942 time window to seed the relationship measure described in the following section. Finally, we retain only those transactions for which the issuer’s SIC code is available. Taken together, these restrictions yield a final sample of 33,577 transactions for use in the econometric analysis.
Table II reports the distribution of transactions in total and by type across the estimation peri-ods. The number of transactions in an estimation period ranges from a minimum of 842 for the 1943-1949 sample to a maximum of 12,574 for 1990-1999 sample. Debt issues substantially out-number equity (and preferred) issues in every estimation period. Over the entire sample period,
17This table is not used as a basis for our relationship analysis and, in order to make trends of the type discussed in this paragraph clear, it does not reflect the lifeline mappings discussed in the next section. Hence, for example, Bank of America deals are illustrated independently of Merrill Lynch deals, even though both are assigned to the same lifeline in our relationship analyses.
18The Appendix includes a list of the 30 banks that appear in each decade’s choice set and their market share during the decade.
debt, equity, and preferred issues accounted for 64%, 31%, and 5% of the sample of transactions. We also report the number and fraction of transactions with an issuer for whom no other issue during the 10 years preceding the year of the transaction at hand was managed by a bank in that issuer’s choice set. In the full sample, the percentage of transactions carried out by issuers that had no prior relationship with a bank in its choice set ranged from 73% during the 1943-1949 estima-tion period to 21% during the 1950-1959 estimaestima-tion period. Issuers without a prior relaestima-tionship were most common between 1970 and 1989. As we show later, this was a period of considerable upheaval in bank/client relationships. Generally, equity issuers were less likely than debt issuers to have dealt with a bank in their choice set during the preceding ten years. We explain how the state of a banking relationship is measured for estimation purposes in the next section.
The relatively small number of observations for the 1970-1979 period reflects the previously mentioned absence of private placement coverage by SDC during this decade. This could bias our results if issuers systematically approach the selection of an underwriter differently for private placements than for other transactions. With respect to the relationship strength variable, there is considerable anecdotal evidence that the sharp increase in private placements following the 1938 Chandler Act’s implementation of a statute-based approach to bankruptcy reorganization dimin-ished the influence of banks in securities issuance.19 If the same is true for the 1970s, the exclusion of private placements should bias our results toward greater issuer dependence on its relationship with a prospective bank than would be the case if private transactions were included in the anal-ysis. But any such bias would then lend weight to our conclusion that the extent to which issuers conditioned their bank selection on the strength of a prior relationship declined during the 1970s.
4. Investment-Bank Relationships
The first challenge in measuring the state of banking relationships at a given time stems from the frequency of name changes and mergers involving both banks and issuers throughout the sam-ple period. If we were to base our analysis upon the names that banks had when a deal was brought to market, it would be impossible to track the fortunes of many major banks through the entire
riod considered. We avoid this problem by defining a bank’slifeline.
We follow Ljungqvist, Marston, and Wilhelm (2006; 2009) in defining a bank’s lifeline at a particular date to comprise the names of all of the institutions that were merged into, or that were acquired by, the bank prior to that date. The bank’s lifeline ends either when it fails, or when it is absorbed into another bank. Each lifeline is given a name, which we use in place of the specific name of a bank whenever it is used in our analysis as a member of the lifeline.
Merrill Lynch, for example, acquired Goodbody in 1970 and White, Weld in 1978. Each acquired firm’s lifeline terminates with the acquisition and its underwriting relationship history is merged with Merrill’s. It is impossible to avoid the exercise of judgment in creating the lifeline for a bank, as it is necessary to decide whenever two banks combine, through merger or acquisition, which bank’s lifeline terminates. When the combined entity takes the name of one of the banks this choice is easy; on other occasions, we assigned the combined institution to the lifeline that we believe to represent the more significant investment banking house. For example, after 2008 we assign Bank of America Merrill Lynch to the “Merrill Lynch” lifeline. Using a similar strategy, we assign clients and their underwriting histories with sample banks to corporate families when sample firms merge.
4.1. Measuring Bank-Client Relationships
We measure the state of relationships between banks and clients over 10-year rolling measure-ment windows, beginning with data from 1933. In the econometric analysis we use a relationship strength index in which for any bank and any issuer, the relationship strength is calculated on a particular dateD as follows. First, we calculate the total dollar quantityQof proceeds raised by any firm in the issuer’s corporate family during the preceding ten years. Second, the total amount Alead managed for the firm’s corporate family by a member of the bank’s dateDlifeline is com-puted. The strength of the relationship between the bank and the company at dateDis defined to be the ratio ofAtoQ. In our analysis we use relationship strength measures calculated using data for all deals between the bank and the company as well as separate measures for debt and equity deals.
Table III provides an overview of client relationships for the top 30 banks by market share for the periods 1933-1969 and 1970-2007. The table reports the number of clients for which each bank managed securities offerings, the percentage of its clients with which it had an exclusive relation-ship, and the fraction of all of its clients’ transactions by value for which the bank was the lead manager. Proceeds from transactions with multiple bookrunners are apportioned equally among the bookrunners.20 Table III reveals a shift from the 1933-69 market, in which it was normal for a single bank to underwrite a large fraction, and in many cases all, of an issuer’s securities offer-ings, to the 1970–2000 world, in which underwriting relationships were far less exclusive. During the first half of the sample period, 53% of all client relationships among the top 30 banks were exclusive—the bankmanaged every dealthat the issuer brought to market. This figure dropped to “only” 34% during the second half of the sample period. The larger change occurred in the banks’ share of the proceeds raised by both clients with which it maintained an exclusive relationship and those with which it did not. The decline from about 39% to 16% reflects, in no small part, large-scale “poaching” of active issuers by commercial banks during the 1990s and 2000s. This effect is most evident among relative latecomers such as UBS, which ranked 16th by market share over the 1970-2007 period but accounted for only about 7% of proceeds raised during this period by issuers for which it managed deals.
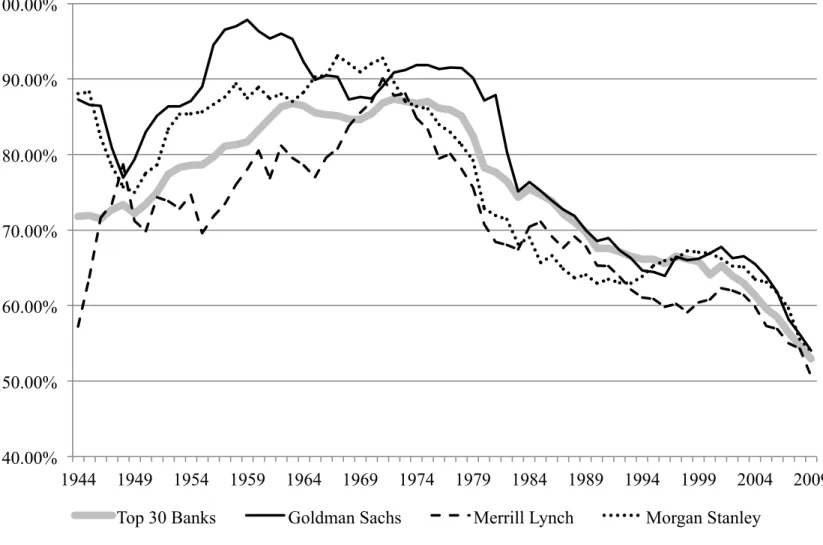
Figure 1 provides a different perspective on this change by reporting average relationship strengths on an annual basis for Goldman Sachs, Merrill Lynch, and Morgan Stanley as well as for the 30 banks that appear in the choice set facing issuers in a given year in our econometric analysis. Goldman and Morgan Stanley managed deals accounting for nearly 90% of proceeds raised by their clients through the 1960s (and later in the case of Goldman). By contrast, dur-ing the early part of the sample period Merrill accounted for less than 80% of proceeds raised by firms for which it managed a deal in the preceding 10 years. This is likely a reflection of the fact that Merrill remained primarily a retail-oriented firm with a modest underwriting presence. But over time the firm’s retail brokerage network attracted syndicate invitations and, ultimately, lead-20We use the terms “lead underwriter,” “lead manager,” and “bookrunner” interchangeably and distinguish them from co-manager with equal apportionment of proceeds. The presence of co-managers and multiple bookrunners is largely a post-1990 phenomenon. Ljungqvist, Marston, and Wilhelm (2009) provide evidence of co-management serving as a stepping-stone to lead-management opportunities.
management opportunities. By 1970 the three firms maintained similarly exclusive relationships with their clients and followed a similar path of declining exclusivity through the remainder of the sample period. By 2009, the average relationship strength among clients for all three banks, as well as the average among the top 30 banks by market share from 2000-2009, was slightly above 50%.
4.2. Measuring Bank Relationships within Industry Groups
In addition to treating issuers as conditioning their bank choice on the state of their relation-ship with each bank in the choice set, we allow for the possibility that issuers condition on whether banks have relationships with their competitors. Asker and Ljungqvist (2010) find that issuers avoid banks that work with their competitors out of concern that strategic information might leak. Alternatively, it is conceivable that some banks maintain industry-specific expertise that is attrac-tive to issuers within that industry.
We use the following strategy to design measures of each bank’s breadth and depth of activity within an industry group. For each year and bank in the issuer’s choice set during the year of a given transaction, we measure the state of the bank’s relationships with all recent issuers in 4-digit SIC categories. We use a 10-year rolling window to identify all transactions for each bank in the issuer’s choice set in a given year. These transactions are then sorted by the issuer’s 4-digit SIC code. Within each SIC code category, we identify banks that managed one or more transactions with more than one firm during the 10-year window. For these banks, we measure the relationship strength variable described above for each firm in the SIC category with which the bank worked during the window and the number of firms with which the bank worked. The relationship strength measures are averaged to create an annual measure of the state of a bank’s relationships within the SIC category. For banks that managed deals for one or fewer firms within the SIC category during the 10-year window, both the firm count variable and the average relationship strength variable within the SIC category take a zero value.
Using a 5-year rolling window, Asker and Ljungqvist (2010) show that the fraction of banks with multiple equity (debt) issuance relationships with the three largest firms within an SIC
cate-gory rarely exceeds 5% (10%) over the 1975-2003 period. Extended to the 10 largest firms in an SIC category, the fraction of banks with multiple equity relationships rises above 10% only after 2001. Similarly, the fraction of banks with multiple debt relationships does not exceed 20% before 2001.
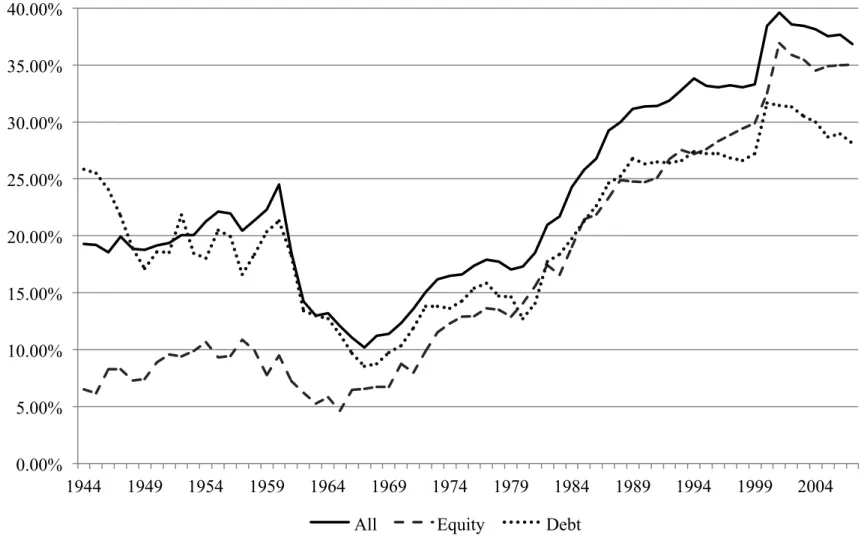
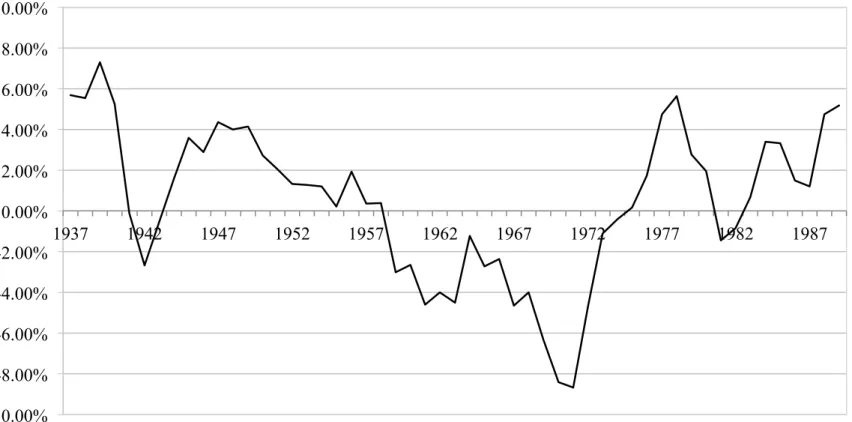
Our approach casts a wider net by considering all issuers within an SIC category. Figure 2 reveals that after 1980 the fraction of banks with multiple equity relationships exceeded 15% (peaking at 37% in 2001) and often exceeded the fraction of banks with multiple debt relationships. More striking from our perspective is the sharp decline through the 1960s in the relative frequency of banks with multiple relationships within an SIC category. Prior to 1960, the fraction of banks with multiple relationships across issue types hovered between 18 and 20%.21 The pre-1960 peak was not surpassed until 1985.
4.3. Measuring Relationships Among Banks
A substantial body of research suggests that issuers condition their bank choice on the quality of the bank’s pricing and distribution services, the quality of analyst coverage that it can deliver, and its market-making capacity. Throughout the sample period, the underwriting (and selling) syndicate played a central role in the delivery of these services. Given the importance of the syndicate, we treat issuers as conditioning on the degree and quality of a bank’s connections to other banks. We quantify the state of a bank’s relationships with other banks using techniques from graph theory.22 We regard two banks as being connected in a particular time window if one bank invites another to be a co-manager in a syndicate for which it is the lead manager. This defines a network of relationships for a 5-year, rolling time window. We then calculate annually for each bank in the choice set a standard measure of network connectedness called eigenvector 21The low relative frequency of multiple equity relationships during this period is, in part, a reflection of the low frequency of equity issuance within many SIC categories that more frequently yielded a single bank appearing in the SIC category dealing with a single issuer. For the 1944–1969 period, breaking the sample into year/SIC code pairs for which the number of banks with at least one relationship within the SIC category is less than 5 or greater than or equal to 5, yields 8% (28%) of banks in the former (latter) category with multiple relationships. For the 1970-2007 period, year/SIC code pairs with fewer than (greater than or equal to) 5 banks with one or more relationships average about 9% (41%) with multiple relationships.
22All of our network calculations were performed using the Stanford Network Analysis Platform (SNAP, available from http://snap.stanford.edu/), a C++ library for performing network and graph-theoretic calculations.
centrality (EVC).23Eigenvector centrality accounts both for the number of relationships that a bank has, and for the quality of those relationships. Hence, a bank that is networked to bulge-bracket investment banks is regarded as more connected than a bank whose network comprises smaller, less-significant players. The formal definition of this measure appears in the Appendix.
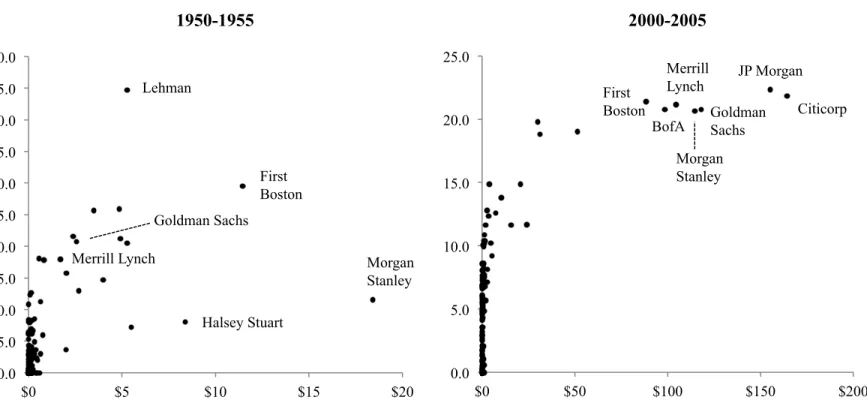
Figures 3 plotsEVC(normalized to lie between 0 and 100) against the total underwriting pro-ceeds managed by every bank in our database for the 1950-1955 and 2000-2005 time periods. In both cases, we label some of the points that correspond to particularly significant banks. The most striking feature of Figure 3 is that very profitable and reputable banks in the middle of the twen-tieth century were not necessarily closely connected to their peers. Morgan Stanley generated the highest underwriting proceeds over this period yet it maintained few connections with other well-placed firms. Indeed, the firm was noted for its unwillingness to share business.24 Halsey, Stuart & Co. also had a low EVC and high underwriting proceeds over this period. However, it was very different to Morgan Stanley in the sense that it was an aggressive bidder for competitive tenders, by which it hoped to destroy existing bank-client relationships (Chernow, 1990, pp. 506, 623) and, as shown in Table III, it maintained relatively weak relationships with its clients. In contrast, Morgan Stanley was a strong defender of traditional, negotiation-based modes of doing business during this period and its client relationships were among the strongest.25 Morgan Stanley’s low connectedness appears to reflect a strong reputation and an excellent client network, while Halsey, Stuart’s low connectedness was evidence of the opposite qualities. By the end of the sample period, there is a much stronger positive relation betweenEVCand underwriting market share. Moreover, the major commercial banks, in spite of having entered the securities markets relatively recently, were well-connected with their peers.
23EVCis calculated for the 30 banks in the choice set using all transactions and banks during the rolling time window. In other words,EVCdoes not measure connectedness strictly among the 30 banks in the choice set. Instead it measures connectedess with all banks that participated in a transaction carried out within the time window.
24As late as the 1970s, Morgan Stanley was seen as lacking distribution capacity and thus, in this respect, dependent on other, usually less prestigious, syndicate members. The firm diluted the power of individual members by working with “up to two hundred firms” in its syndicates (Chernow, 1990, p. 624).
4.4. Summary Statistics for Bank Relationship Variables
For estimation purposes, both the client relationship strength variables andEVChave been nor-malized to a 0-100 scale. Table IV reports summary statistics for these variables by time period and conditional on whether or not the bank was selected from the issuer’s choice set. For example, during the 1943-1949 period the client’s mean relationship strength with the bank it chose to man-age its transaction was 32.79. In other words, on averman-age, banks selected to manman-age transactions during this time period had management responsibility for about 33% of the issuer’s proceeds from transactions executed during the ten years preceding the transaction at hand. By contrast, banks within the choice set that were not selected to manage a transaction accounted for about 1% of the issuer’s proceeds during the preceding ten years. The difference in means is statistically significant at the 1% level. The difference in means increased during the 1950-1959 period and then decreased every period thereafter. In every period the difference in means is statistically significant.
Table IV also reveals that banks selected to manage deals generally maintained (statistically) stronger relationships with other firms in the issuer’s 4-digit SIC category. This is consistent with issuers valuing industry-specific expertise. However, the absolute difference in this measure be-tween banks that were chosen and those that were not is smaller during the latter part of the sample period. This pattern is broadly consistent with the argument advanced by Asker and Ljungqvist (2010). Moreover, it suggests that the increasing frequency of banks with multiple relationships within an SIC category documented in Figure 2 rests on a preponderance of relatively weak (non-exclusive) relationships.
On average, banks selected by issuers were better connected with their peers across the entire sample period. In absolute terms, differences inEVCacross banks selected by the issuer and those that were not are considerably smaller than for the relationship variables but they remain statisti-cally significant. In further contrast, the mean levels forEVC for both bank types are relatively stable through time.
We also report the mean rank (by market share for the decade at hand) within the issuer’s choice set for the two bank types. On average, issuers selected higher-ranking banks (with lower mean rank values) and this pattern strengthened through time. Finally, the lower panel of Table
IV provides summary statistics for two transaction-specific attributes: the dollar value of the trans-action and the number of transtrans-actions carried out by the issuer since 1933. The latter is intended as a measure of the issuer’s activity level in the capital markets. These variables, along with an indicator variable identifying equity issues, will appear in two specifications of the econometric model described in the next section.
5. Estimation of the Bank Choice Model
We use the McFadden (1973) conditional logit framework to model the issuer’s bank choice. The issuer’s choice set contains J =30 (unordered) alternative banks, representing the top 30 banks ranked by proceeds raised in offerings completed during the decade in which the issuer’s transaction takes place.
The issuer’s bank choice follows an additive random utility model which specifies utility for transactionias:
ui=Xiβ+ (ziA)0+ξi,
whereβis ap×1 vector of alternative (bank)-specific regression coefficients,Ais aq×Jmatrix of case (transaction)-specific coefficients, and the elements of theJ×1 error vectorξiare independent Type I extreme-value random variables. Each transaction iyields a set of observations Xi j∗ = (Xi, zi) whereXiis a matrix of bank-specific attribute vectors for each of theJ banks in the choice set andziis a 1x qvector of transaction-specific (bank invariant) attributes. Definingβ∗= (β,A) and yi j=1 if theithissuer selects bank jwith attribute vectorXi j∗(and 0 otherwise), the model’s choice probabilities satisfy26 Pr(yi=1|Xi,zi) = expXi j∗β∗ exp ∑Jj=1(Xi j∗β∗ .
26Note that the conditional logit model admits the possibility of more than one alternative being selected for a given transaction. This occurs in instances where the issuer selects multiple banks to co-manage its transaction. The presence of multiple bookrunners arose only during the last two estimation periods and, even during the 1990s, this was a feature of only 3% of sample transactions. During the final estimation period (2000-2007) 32% of sample transactions had multiple bookrunners.
Our primary interest is in the influence of the bank-specific attributes Xi on the issuer’s bank choice. These attributes include (i) the state of a bank’s relationship with the issuer (RelStr), (ii) the state of the bank’s relationships with other firms in the issuer’s SIC category (RelStrSIC), and (iii) the state of the bank’s relationship with other banks (EVC). Each attribute varies across banks. RelStr andRelStrSIC generally vary across transactions but EVCdoes not. RelStr does not vary across transactions for issuers with exclusive banking relationships that carry out more than one transaction during the estimation period.
We estimate three model specifications. We begin with a simple conditional logit specification (CLogit) that includes only bank-specific attributes. We also estimate conditional logit (ASCLogit) and nested logit (NLogit) specifications that includes both bank-specific and transaction-specific attributes. In theNLogitspecification banks in the choice set are assigned to one of three groups.27 There is no obviously “correct” nesting structure in our setting. Banks can differ from one another along a number of dimensions including their institutional and retail investor networks, capital-ization, and industry- and product-specific expertise. Ideally, a bank group would comprise close substitutes with one another that are distinct from banks in other groups. The nested logit results reported in the next section are based on groups defined by the top 5 banks ranked by proceeds, the next 15 banks and the final 10. These groupings roughly correspond with the industry character-ization proposed by Hayes (1979) around the midpoint of our sample period: a “special bracket” comprising 5-6 banks, a “major bracket” comprising 14-16 banks, with the remainder making up a “submajor” bracket. Returning to Table I, we see for the 1970-2007 period that this nesting struc-ture places about 50% of market share by proceeds with the top 5 banks, about 37% in the second group of 15 banks, and about 4% in the last group of 10 banks. Recognizing that there remains a degree of arbitrariness in our grouping strategy, we have experimented with other groupings. Al-though we do not report results for alternative groupings, our conclusions are not sensitive to the alternatives with which we have experimented.
27The specification names correspond with theStatafunctions (clogit,asclogit,nlogit) used in their estimation. In contrast to the expression for the conditional logit choice probabilities given above, the nested logit choice probabilities are equal to the product of the probability of selecting a group and the probability of selecting a bank conditional on having selected the bank’s group. The nested logit specification reduces to the conditional logit model under the assumption of independent and identically distributed errors. See Cameron and Trivedi (2008, ch.15) for further details.
The (ASCLogit) and (NLogit) specifications reported in the next section include three transaction-specific attributes: an indicator for whether the transaction is an equity issue; the log of the dollar value of the transaction; and the number of previous transactions brought to market by the is-suer measured from the beginning of the sample period (1933). In the (ASCLogit) specification each transaction-specific attribute gives rise to 29 bank-specific parameter estimates with the 30th bank’s parameter estimate normalized to zero. In the (NLogit) specification transaction-specific parameters are estimated for the top 5 and next 15 bank groups with the bottom 10 bank group providing the base for comparison. The results are not sensitive to the inclusion of additional transaction-specific attributes that were available for the entire sample period.
Assuming independent and identically distributed errors in the conditional logit framework yields the independence of irrelevant alternatives (IIA) property that the odds ratio for a given pair of alternatives is independent of the characteristics of other alternatives. In practice, the assumption may be violated when members of the choice set are close substitutes for one another as quite plausibly could be the case among at least some of the banks in our choice sets. In fact, tests for violations of the IIA assumption [see Hausman and McFadden (1984)] reveal this to be the case. The nested logit specification addresses this problem by permitting error correlation within groups while treating errors across groups as independent.
6. Estimation Results
Table V presents results for three specifications of the bank choice model for each of the 7 estimation periods. It is evident that the alternative specifications yield qualitatively similar results. As we noted in the preceding section, tests for independent and identically distributed errors reject the independence of irrelevant alternatives assumption. Thus we focus our discussion of the results on theNLogitspecification. We report estimated coefficients (with standard errors in parentheses) for each bank-specific attribute. The signs of the coefficients for these attributes can be directly interpreted to indicate the effect of a change in the attribute on the probability of a bank being selected by the issuer. For the sake of brevity, we do not report coefficients for transaction-specific attributes but rather discuss their implications in the text below.
Because the three model specifications are nested, the reported log-likelihood values, which can reach a maximum of zero, generally would be directly comparable across estimation periods. Focusing on the first three periods, we see that the ASCLogit specification provides the best fit. This is not surprising given the greater flexibility afforded by the specification. Both likelihood ratio and Akaike information criterion tests generally favor the more complex specification at a 0.05 significance level. During the last four estimation periods there are transactions for which the issuer selects more than one bank. Stata’sNLogitroutine excludes these transactions from the estimation sample. The number of excluded transactions ranges from 5 during the 1970s to 1,797 (32% of the total) during the 2000s. As a consequence of these exclusions the goodness of fit is not directly comparable across model specifications during these estimation periods. However, it is clear from the χ2 test statistics that each specification in every estimation period provides a
very good fit to the data. Consistent with these test statistics, the (unreported) average predicted probabilities for individual banks generally correspond closely with their sample probabilities.
The influence of a bank’s relationship with an issuer (RelStr) on its choice probability is positive and statistically significant during each of the seven estimation periods. The influence of relation-ship strength on issuer decisions reached its height during the 1960s and then declined thereafter. The estimated coefficients forRelStrSICindicate that the state of a bank’s relationships with other firms within the issuer’s 4-digit SIC category had a more modest (but statistically significant) pos-itive influence on the issuer’s bank choice through the entire sample period. But the coefficient declined in value by over 50% from the 1970s to the 1980s. By contrast, the influence of a bank’s syndicate relationships (EVC) on its choice probability was negative and statistically significant through the 1950s. Issuers began to respond positively to this attribute during the 1960s. Issuer sensitivity to this attribute increased sharply during the 1970s and then again during the 2000-2007 period.
Turning to the transaction-specific coefficients estimated for the top 5 and middle 15 bank nests, we find that equity issuers generally are less likely to select a bank from these two groups relative to the bottom 10 banks after controlling for bank-specific and other transaction-specific attributes. Unconditionally, the bottom 10 banks are less likely to be selected to lead any type of deal but their
share of equity deals generally is larger than for either debt or preferred deals. In contrast, relative to the bottom 10 banks, the top 5 and middle 15 banks are more likely to be selected for larger deals and for deals brought to market by more active issuers.
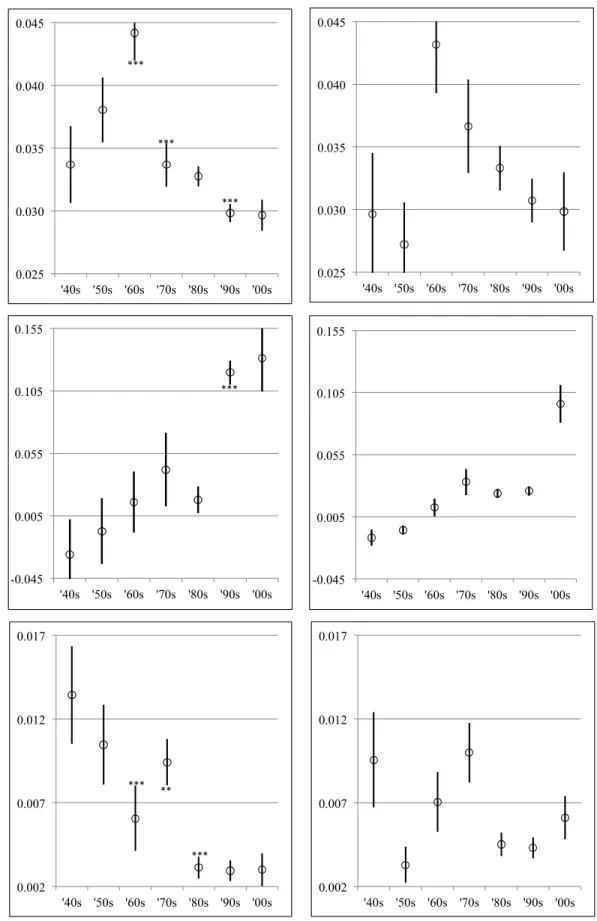
Figure 4 provides a graphical summary of the 95% confidence intervals for the estimated co-efficients from both the ASCLogitand NLogit specifications. For theASCLogit specification we conduct χ2 tests of differences in individual coefficients across decades and we indicate in the
figure instances in which the null of equality of coefficients across decades is rejected.28 Figure 4 indicates that the declining influence of relationship strength on issuer decisions documented in Table V is statistically significant. The coefficient forRelStrestimated for the 1970s is statistically different from the 1960s coefficient at the 1% level in theASCLogitspecification. Similarly, there is little overlap in the confidence intervals for the NLogit RelStr coefficients from the 1960s and 1970s. It is less clear that the change from the 1970s to the 1980s is statistically significant, but the difference between the 1970s and 1990s clearly is significant.29 We provide further evidence and an interpretation of this time pattern in the following section. Similarly, the results forRelStrSIC suggest a significant long-run decline in the influence of the state of a bank’s relationships with a client’s potential competitors with the exception of a temporary increase during the 1970s.
The pronounced increase inEVC’sinfluence over time is consistent with both issuers benefiting from the rise of institutional investing and potential incentive conflicts. Concentrated ownership by institutional investors provides greater scope for internalizing the net benefits of costly infor-mation production. Pichler and Wilhelm (2001) argue that syndicates benefit issuers by enabling cross-monitoring among bankers that promotes efficiency in the acquisition of investor information
28We use Stata’s suest (“seemingly unrelated estimation”) routine to carry out the test. Stata’s NLogit rou-tine does not provide a similar test and we have been unable to devise one that would suit our purpose. The problem can be understood by recognizing that the suestroutine combines parameter estimates and associated co-variance matrices into one parameter vector and simultaneous coco-variance matrix of the sandwich/robust type (see http://www.stata.com/manuals13/rsuest.pdf). But it does not admit the estimated nest-selection probabilities obtained for theNLogitspecification. It is possible to simultaneously estimate separate coefficients for each decade in a single nested logit and test for differences but this requires imposing an equality constraint on the nest probabilities across decades. This constraint yields different parameter estimates from those reported in Table V and a poorer model fit as indicated by the log likelihood for the regression.
29Given that commercial banks began to enter debt underwriting in 1987, we examined whether early entry into securities underwriting influenced the results for the 1980-1989 period by reestimating theNLogit specification ex-cluding the years 1987-1989. This specification yielded results that were not meaningfully different with respect to these bank attributes from those reported in Table V for the full 1980-1989 estimation period.
(e.g., Benveniste and Spindt (1989) and Sherman and Titman (2002)). This potential for cross-monitoring may also have served to dampen a growing threat of banker malfeasance as bank/client relationships weakened (e.g., Corwin and Schultz (2005) and Morrison and Wilhelm (2008)). Fi-nally, the sharp increase in the influence ofEVCduring the 2000-2007 period corresponds with in-creased interest among issuers for using the syndicate to obtain wider analyst coverage and greater market-making capacity (Corwin and Schultz, 2005) and for preserving concurrent lending rela-tionships as commercial banks gained entry to securities underwriting (Drucker and Puri, 2005).
A rough measure of the economic significance of the estimated coefficients is gained by expo-nentiating the coefficients to obtain an estimated odds ratio. For bank-specific attributes, the odds ratio reflects the change in the issuer’s odds of selecting a given bank in the choice set for a 1 unit change in the bank attribute. If, for example, we consider RelStr during the 1943-49 estimation period, the estimated coefficient of 0.0296 implies an odds ratio of 1.0273. Keeping in mind that RelStr is the normalized dollar share of the client’s proceeds raised during the preceding decade, this implies that the issuer’s odds of selecting a given bank in the choice set increase by about 2.7% for a 1 percentage point increase inRelStr. This is nearly three times the effect of a 1 percentage point increase inRelStrSIC. The estimated coefficient of -0.0118 forEVC during the first estima-tion period yields an odds ratio of 0.988. In other words, a one unit change inEVCdecreases the odds of selecting a given bank by about 1%. Unfortunately the scale of EVCdoes not have any direct economic interpretation. However, the absolute magnitude of the increase in the coefficient forEVCover the entire sample period suggests a nontrivial change in issuer behavior.
The summary statistics in Table IV provide further information useful in understanding the eco-nomic scale of the effects of bank attributes on issuer decisions. Among banks that were selected to manage transactions,RelStrhad a mean value of 32.79% with standard deviation of 40.71% for the 1943-1949 estimation period. This suggests that among selected bank, the odds of being selected by the issuer would increase by about 110% (2.7×40.71), or roughly double, for a 1 standard deviation increase in the strength of the bank’s relationship with the issuer (predicted probabilities range from about 2-8% during this estimation period). As we turn our attention to changes across periods, it is useful to note that both the underlying coefficients (and odds ratios) forRelStr and
the standard deviation of the client relationship strength among selected banks declined after 1970. Judged from the same perspective, the economic significance ofRelStrSICandEVCappears more modest although unit changes inEVCdo not have a direct economic interpretation.
Banks that were not selected by an issuer generally had no relationship with the issuer during the decade preceding the transaction. For an issuer that raises new capital relatively infrequently, selecting a bank with which it previously had no relationship results in a relatively large value for RelStr going forward and a potentially large decline in RelStr for the bank(s) that it selected in the past. For example, a firm that did two deals of the same size with two different banks would maintain a value for RelStr of 50% with each bank. If the firm selected a new bank to lead a subsequent deal of the same size, the new bank’sRelStrvalue would rise by 33 percentage points. Simultaneously, the two banks with which the firm dealt in the past would each suffer nearly a 17 percentage point decline inRelStr.
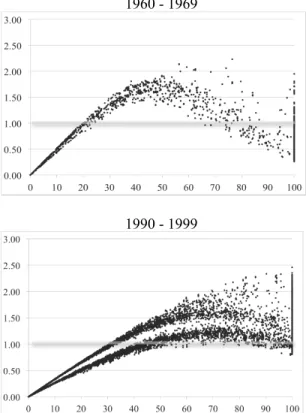
We shed further light on the economic significance of the state of the bank/client relationship by examining choice probability elasticities with respect to RelStr. For each transaction iduring an estimation period, the elasticity with respect toRelStrfor bank jis
Elasi= ∂pˆi j ∂RelStri j ×RelStrj ˆ pi j ,
where ˆpi j is the predicted probability of the issuer selecting bank j for transactioni andRelStri j is bank j’s relationship strength with the issuer.30 Figure 5 plots elasticities against against their corresponding value ofRelStrfor each estimation period. In each panel we pool elasticities from all transactions (and banks) during the estimation period. For example, the sample for the 1943-1949 estimation period included 842 transactions. For each transaction we obtain an elasticity for each of the 30 banks in the choice set. Each of the 30 elasticities for each transaction are then plotted against the bank’s measure of RelStr for the issuing firm. For a given transaction, most banks in the choice set have no prior relationship with the issuing firm. By definition, the elasticity of their choice probability with respect toRelStris zero, so that the scatterplots are anchored at the 30See Cameron and Trivedi (2008, p. 492). The partial derivative can either be calculated numerically or by making use of the fact that
∂pˆi j
∂RelStrj
origin.
Several patterns emerge across the seven estimation periods. First, the scatterplot of elasticities is concave in every period. From 1943-1969, for both low and high levels ofRelStr the concen-tration of data points indicates that choice probabilities are inelastic (< 1.0) with respect toRelStr and elastic (> 1.0) for intermediate levels ofRelStr; issuers were relatively insensitive to a small change inRelStr for banks with which they had very weak or very strong relationships. This is consistent with the high level of relationship exclusivity observed in the data. A well-established relationship was not easily contested. From 1970-1999, there is a much greater frequency of choice probability elasticities greater than 1.0 among bank/client pairs with intermediate to high levels of RelStr. As issuer’s conditioned less heavily on RelStr, existing relationships were more open to challenge from competitors.
With the exception of the 1960-1969 estimation period, there is an apparent separation among elasticities for a given value of RelStrthat corresponds roughly with the nesting structure in the nested logit. Especially from 1970 forward, elasticities for a given level ofRelStrare lowest among the top 5 banks and greatest among the bottom 10 banks. After 1980 the elasticities for the top 5 banks generally cluster around 1.0 or slightly above for values ofRelStrgreater than 50. Over the same range, the next 15 banks maintain a modest degree of concavity with elasticities less than 1.0 appearing only during the 2000-2007 period. By the 2000-2007 period there is little observable difference between the top 5 and next 15 banks. The bottom 10 banks exhibit a positive slope over this range but for a wide distribution with a minimum near 1.0 in cases whereRelStr= 100.
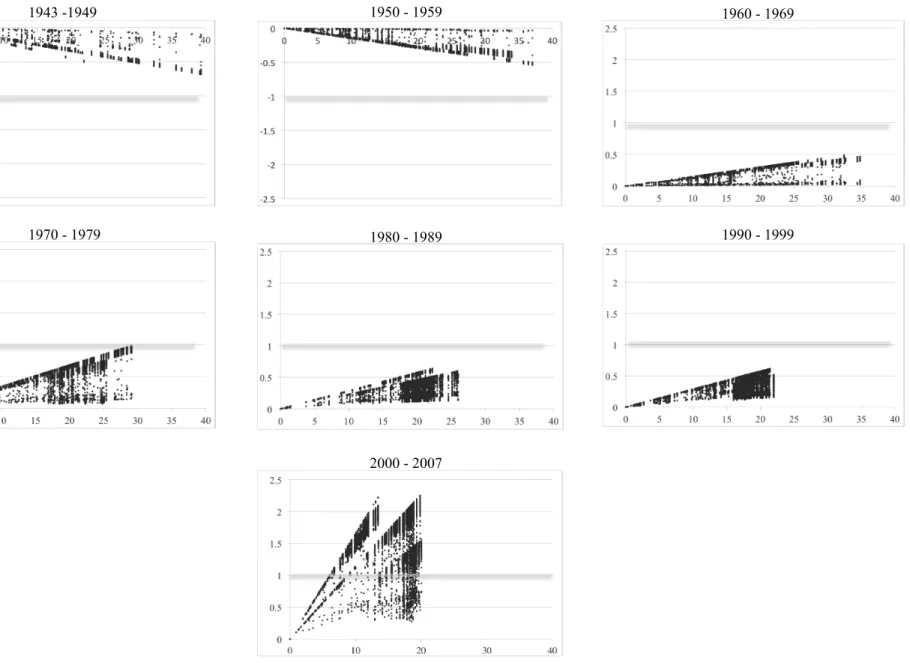
Figure 6 shows choice probability elasticities with respect toEVC. The general message corre-sponds with the observation above that the economic significance ofEVCis modest relative to that ofRelStr. Only during the final estimation period do we observe elasticities greater than 1 (in ab-solute value). With the exception of a small number of observations associated with relatively high values forEVC during the 1970-1979 estimation period, choice probabilities are highly inelastic with respect toEVC. Although the influence ofEVCon issuer decisions is statistically significant, the effect is weak. By contrast, during the final estimation period for values ofEVCexceeding 5 on the 100 point scale, there are many instances in which choice probabilities are highly elastic.