T. Paul McCartney, Kenneth J. Goldman
WUCS-97-48
Department of Computer Science
Washington University
Campus Box 1045
One Brookings Drive
Saint Louis, MO 63130-4899
December 1997
of Distributed Aggregate Data
T. Paul McCartney, Kenneth J. GoldmanDepartment of Computer Science Washington University St. Louis, Missouri 63130, USA
{paul | kjg}@cs.wustl.edu
http://www.cs.wustl.edu/cs/playground/euphoria/
Abstract
Aggregate visualization and manipulation enables the viewing and interaction of dynamically changing data sets in a graphically meaningful way. However, off-the-shelf applications typically provide only limited ways to view static aggregates and generally do not support manipulation of aggregate data through the resulting visualization. To be fully dynamic, an aggregate visualization should be customizable to suit the individual’s needs and should allow end-users to modify the data through direct manipulation. This paper describes a software system that empowers end-users to create interactive aggregate visualizations through a visual language interface. Included are mechanisms for specifying how aggregate data is processed from multiple sources of a distributed application, providing functionality similar to project, select, join, and cross product of relational databases. This approach gives end-users the power to create customized, interactive visualizations of dynamically changing aggregate data without the need for textual programming.
Keywords: aggregate data, constraints, direct manipulation, distributed computing, matching, multi-way constraints, user interface management system, visualization
1. Introduction
Most large scale applications use aggregates to store collections of element data. For example, an air traffic control center may have a database that stores an aggregate of airplane information (e.g., identification, aircraft type, passenger/cargo classification, etc.); each airplane record represents an element of the aggregate. Visualization of an aggregate can make the information easier to comprehend, and may give the end-user insight that may not have been achieved otherwise. Direct manipulation with the visualization gives the user the ability to modify the data in a natural way. However, insight can only be achieved if the visualization reflects what the end-user would like to see. A visualization that includes extraneous information or uses an unintuitive graphical representation can be more confusing than viewing the aggregate information textually. Since each end-user may be interested in a different aspect of an aggregate, customization is the key to making an aggregate’s visualization effective to individuals. Moreover, it is often the case that the user does not know in advance the most effective way to visualize the data to lead to a meaningful understanding. Therefore, it is also important to facilitate dynamic modification of the visualization.
Communication networks, such as the Internet, allow distributed applications to be constructed from communicating components (e.g., processes) running on separate computers. Parallel processing and support for multi-user applications are some of the benefits of a distributed approach. Visualization and manipulation of a distributed application’s data is particularly challenging. Many times, aggregate data is
spread across multiple components of a distributed application. For example, the server component of a client-server application commonly stores an aggregate of information obtained from each client component. The application’s visualization component may be completely separate from the other components, requiring careful communication and synchronization among the visualization and other components.
This paper discusses mechanisms that enable end-users to create customized, interactive visualizations of dynamically changing aggregate data. These mechanisms were developed in the context of state-based distributed computing, but are equally applicable to non-distributed applications. This process, known as aggregate mapping, involves three distinct stages. First, the method of how aggregate data is gathered and processed from computation sources is specified. Our goal here was to allow the visualization to be decoupled from its underlying application. End-users can visually specify how aggregate data is to be processed from multiple aggregates, using mechanisms functionally similar to select, project, join, and cross product of relational databases [1], [2]. Second, the relationship of the aggregate data to its visualization is specified. The goal of this stage was to enable end-users to create customized visualizations through a visual language interface. Third, the system maintains the relationship of the visualization with the aggregate, and the aggregate with its computation sources. The visualization must always be consistent with the underlying data of the application, reacting to both changes to the application data and end-user direct manipulation of the visualization.
The organization of this paper is as follows. Section 2 provides an overview of related work in the area of aggregate visualization and manipulation. Section 3 gives a brief discussion and tutorial of the software systems that this work was built upon. It should be emphasized that this section is only presented as background information to aid the reader in understanding aggregate mappings. The contributions of this work are presented in Section 4, which discusses aggregate mappings. Section 5 discusses future work, and Section 6 provides a brief summary.
2. Related Work
Commercial products such as Microsoft Excel[12] and LabView [10] provide some support for end-user aggregate visualization. Excel users may choose from a number of pre-defined chart representations (e.g., pie charts, histograms) to view spreadsheet data. Excel’s visualization is static; once a chart is created the user cannot interact with the display. Our system supports end-user interaction with the aggregate visualization and automatic updates of the display in response to dynamically changing data sets. The LabView visual programming environment allows users to construct array types interactively and, like Excel, allows plotting of the array data using built-in chart displays. Although LabView’s chart displays are updated when the underlying data is changed, aggregate data cannot be manipulated interactively. Excel and LabView allow only limited customization of how the data is visualized. For example, it is possible to specify the color of a bar chart’s graphics in Excel. However, more involved customization such as creating a completely new type of chart representation is not supported in Excel or LabView. Our system gives end-users the ability to specify arbitrary graphical representations of aggregate data and how it is “mapped” to the display. This gives users the ability to create highly customized, interactive visualizations.
Graphics toolkits such as Garnet [18] and Interviews[11] provide programmatic support for visualizing data sets such as lists and graphs. Our work focuses on allowing end-users to create aggregate visualizations without textual programming. Research systems such as Pavane[20] and Weasel[3] allow the visualization of aggregate data through the use of a high-level specification language. With Swarm, a specification language associated with Pavane, programmers can write formal textual specifications of
concurrent algorithms. The execution of the algorithms can be mapped to a visual display using Pavane. However, Pavane visualizations cannot be manipulated. Our system allows end-users to specify aggregate visualization graphically at run-time. Visualizations are created which reflect the state of distributed applications in real-time, allowing the viewer to manipulate the data and change the state of the application as it is running. GVL provides a functional specification language for Weasel, and is used to specify the mapping from the program’s data state to the display. Like our work, Weasel decouples the program state from its visualization. Weasel provides support for visualizing dynamically changing data in real time, but does not support manipulation of the visualization. However, it is not clear that end-users (i.e., non-programmers) would be able to construct visualizations with Weasel.
Other systems such as Magic Lens[5], GQL[19], and Visage[4] have focused on the visual specification of database queries. While our system enables end-users to visually specify the functionality of project, select, join, and cross product database operations, our primary contribution is in integrating this functionality with end-user defined dynamic visualizations. Our system allows end-users to define basic operations on the data of distributed applications, to create a customized visualize of the result, and to manipulate the underlying data interactively.
Magic Lens[5] provides the ability to filter a data set through the use of multiple, overlapping filters. The filtered data is visualized using 2D scatterplots. The strength of this approach is that it allows users to explore data by adjusting the filters interactively. Although our system includes a data filtering mechanism, it does not address methods of “browsing” data through the modifications of visual queries. Instead, our system focuses primarily on creating customized visualizations and reacting to dynamic updates of the data.
The Visage system[4] enables users to specify visual queries on multiple data sets. Used in conjunction with the SageBrush tool[21], visualizations of a visual query may be created, browsed, and refined. Like our work, the Visage system provides the ability to work with multiple data sets, providing the functionality of a relational database’s project and select operations. Like our work, Visage’s visualization system operates directly in terms of a database query’s source data rather than a derived result (see Section 4.5.2). This allows changes of a query’s resultant data to be coordinated with its original data set. The main difference between our work and Visage/SageBrush is that our work focuses on dynamically changing aggregate visualizations for “live” distributed applications, whereas Visage focuses on interactive visualization and browsing of shared databases. Visage supports direct manipulation of visual query specifications, but does not offer direct manipulation of the data itself through the visualization. Supporting this direct manipulation feedback to the application is particularly challenging because it means that all of the visualization steps are invertible so that changes of the resulting visualization can be mapped back to the application. In addition, our system supports creating interactive user interfaces for distributed applications. User interfaces constructed in this way respond to both continuously changing aggregate data of a distributed application and end-user manipulation of the data through the visualization.
3. Background
This section describes the software systems that this work was built upon, including a distributed programming environment and a user interface management system. Section 4 presents aggregate mappings, the central research contribution of this paper.
3.1
The Programmers’ Playground
The Programmers’ Playground (Playground)[9] is a software library and run-time system that supports the I/O abstraction programming model for distributed applications. I/O abstraction provides a separation of computation from communication that is well-suited for end-user construction of customized distributed applications from computational building blocks. Playground users do not need to write any source code to establish communication among the components of a distributed application, nor do they need to understand the details of how communication occurs.
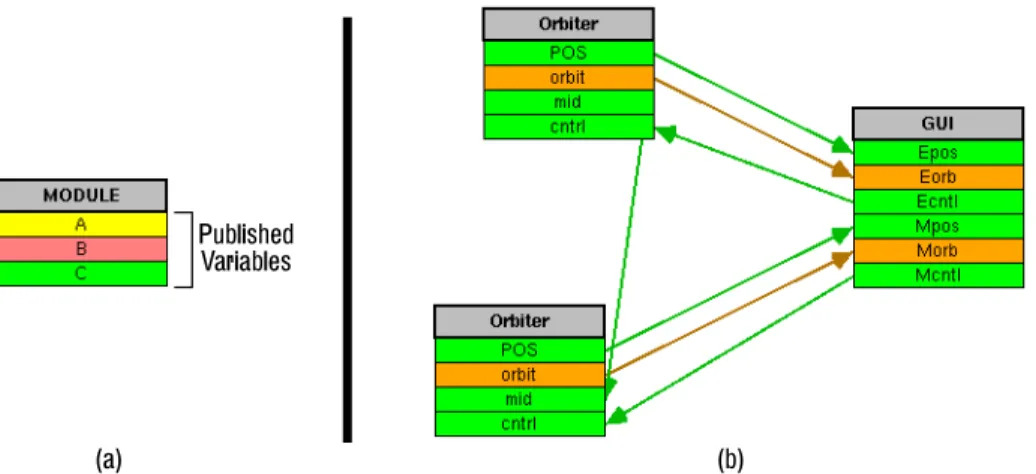
In the I/O abstraction model, each module of a distributed application has a data boundary containing published variables that may be externally observed and/or changed. Modules are written in a standard programming language (e.g., C++) using the Playground library. This library provides publishable data types, including base types (e.g., integer, real, string), tuples, and aggregates (e.g., arrays, lists). These types may be arbitrarily nested to form new publishable tuple types, and new types of publishable aggregates may be defined as well. Playground modules have a visual representation that was designed as part of a visual configuration language for interprocess and intraprocess communication[15]. Figure 1a shows the visual representation of a module with three published variables. The color of a published variable is used to represent its data type.
A distributed application consists of a collection of independent modules (i.e., processes, each of which may run on a separate computer) and a communication configuration. The communication structure is established by creating logical connections among the published variables of the modules. The configuration of connections is determined dynamically at run-time, rather than statically at compile time. In the visual configuration language, end-users simply draw logical connections among the modules to specify how the modules communicate. In this way, users have the ability to create distributed applications by combining a number of “off the shelf” components interactively, rather than by textual programming. Figure 1b shows the visual representation of an application consisting of three modules and a configuration of logical connections, shown as arrows.
Whenever a module updates one of its published data items, the new value is implicitly communicated to all connected variables of other modules. The details of how the communication is handled are hidden from the creator and users of the module. For example, the application shown in Figure 1b represents an planetary orbits simulation. TwoOrbiter modules are used to simulate the orbits of the Earth and Moon,
Figure 1: (a) Visual representation of a module. (b) An application with three modules and a communication structure of logical connections.
(a) (b)
Published Variables
respectively. Each Orbiter module has a POS published variable that represents a computed (x, y) position that is updated over time. The firstOrbiter module, representing the Earth, has itsPOS variable connected to the Epos (Earth position) variable of the GUI module. Whenever this Orbiter module updates the value of itsPOS variable, this new value is communicated to theGUI module and is stored in the Epos variable. The GUI module, described in the next section, uses these updates to animate the movement of the Earth within a graphical interface.
3.2
EUPHORIA User Interface Management System
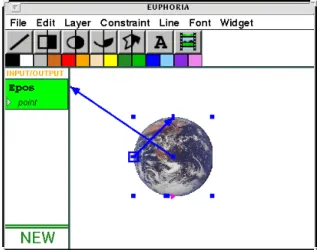
EUPHORIA, Playground’s user interface management system [13], [16], is a specialized module for creating customized direct manipulation graphical user interfaces (GUIs) without the need to write user interface source code. In EUPHORIA, end-users simply draw GUIs using an interactive graphics editor. GUIs can consist of various types of graphics items, including simple shapes, text, images, and end-user defined widgets (encapsulated grouping of graphics items). Figure 2 shows theEUPHORIA editor during the creation of the planetary orbits GUI for the application described in the previous section. The editor contains a drawing area, tool palette, and data boundary for publishing variables (note that the published variables in Figure 2 correspond to the published variables of the GUI module in Figure 1b). GUIs are created and associated with their underlying application interactively; there are no separate “design” and “run” modes. When aGUI is complete, the tool palette and data boundary may be hidden.
Each graphics item drawn inEUPHORIA has a number of associated attributes (e.g., position, size, etc.). These attributes can be used in forming multi-way constraints relationships [7] to other shapes and to external Playground modules. The “handles” of a selected graphics item act as data ports to the item’s attributes, allowing end-users to define the constraints. For example, Figure 3 shows how the Earth graphical object from Figure 2 is constrained to be strictly circular and fixed in size. In Figure 3a, the Earth is selected, showing its handles; the user constrains the Earth to be strictly circular by drawing a constraint between the height and width handles. Figure 3b shows the result of applying this constraint. EUPHORIA allows end-users to optionally view the established constraint relationships among graphics
Figure 2: Interactive Orbital Simulation in EUPHORIA.
pu b li sh e d v a r i a b l e s tool palette drawing area d a t a bo un d a r y
objects. The constraint between the width and height is shown as an arrow in Figure 3b. One can also “anchor” an attribute, preventing its value from being changed. In Figure 3c, the “width” handle is anchored; this constraint is shown as a square around the width handle. Also note that the direction of the width-height constraint changes as a result of anchoring the width. Since constraints are multi-way, the computation flow of the constraints changes dynamically based on the addition/deletion of constraints, user interaction, and external updates from published variables. More information about EUPHORIA’s constraint system may be found in[13],[16].
End-users can publish Playground variables from EUPHORIA and form constraints among the variables and graphics item attributes. This allows other Playground modules to selectively observe or control the state ofEUPHORIA’s display. Also, this decouples the application from the visualization since external modules only operate in terms of their published state rather than the specifics of the graphical display. Figure 4 shows how the position of the Earth may be exposed to external modules: by forming a constraint between the Earth’s center attribute and anEpos published variable. When an external change is received for theEpos variable (i.e., communicated through a logical connection), the system responds by animating the Earth’s picture to the appropriate location. Similarly, manipulating graphics items associated with EUPHORIA’s published variables results in communication of the new state information to external modules. For example, in Figure 2, there are three points that control the shape of the Earth’s orbit. Manipulating these points results in a communication of the updated state information to the Earth’s orbiter module through theEcntl variable, resulting in a change to the simulation.
Figure 3: Defining constraints on the Earth graphical object.
Figure 4: Publishing the position of the Earth.
The features of EUPHORIA described in this section allow end-users to construct GUIs that consist of a fixed number of graphical components. This is presented as background information to aid in the understanding of the remainder of this paper. Many applications require the visualization and manipulation of an arbitrary number of graphical items. For example, a graph visualizationGUI must be capable of viewing many vertices and edges; it is not reasonable to force the GUI designer to draw each item separately. The research contributions of this paper concern the use of aggregate mappings, an interactive technique that enables end-users to define how aggregate data is to be visualized and manipulated. The next section describes the design and implementation of aggregate mappings.
4. Aggregate Mappings
For the purposes of this paper, an aggregate is a data structure that is a collection of element data. Examples of aggregates include arrays and lists. Aggregate mapping is a mechanism to define how an aggregate is to be represented in an interactive graphical display. InEUPHORIA, an aggregate mapping mechanism was designed and implemented according to the following goals:
• Creation of aggregates and their associated mappings should not involve textual programming. • Aggregate data are to be sent and received through Playground published variables, providing a
sep-aration of the visualization from its underlying application.
• An aggregate mapping visualization should be dynamic and bidirectional, responding interactively to both updates in underlying data elements and user manipulation during application execution. • The relational database techniques of project, select, join, and cross product[1],[2] should be
avail-able to allow basic processing of a mapping’s aggregate data.
We intended aggregate mappings to be definable by a broad class of end-users. Visual programming techniques enable end-users to create aggregate mappings that visualize aggregate data received from any Playground module. In addition, we also wanted to provide sufficient capabilities for creating non-trivial, interactive visualizations from scratch. The following subsections describe the aggregate mappings in the context of examples.
4.1
Collaborative Medical Imaging Example
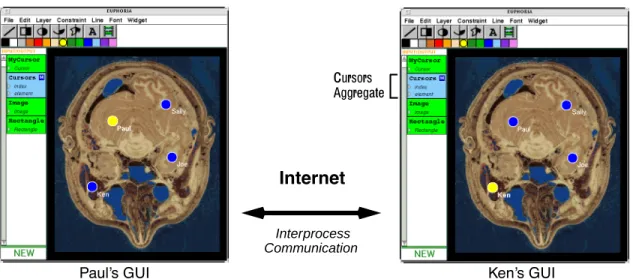
As an example usage of aggregate mappings, consider the following collaborative medical imaging application. Given a shared graphical display, physicians at different locations (e.g., a city and its suburb) wish to discuss a medical image while using cursors to point to areas of interest. That is, each physician’s GUI has a picture of the shared image, a labelled cursor that can be moved, and a number of other cursors that are controlled by collaborating physicians.
For example, Figure 5 shows theGUIs of two application participants, Paul and Ken. Paul’s display shows a yellow cursor that he can move as well as the cursors of Ken and the other participants, shown in blue. When Paul moves his cursor, the updated state information is communicated to the other participants, resulting in real-time animation1. This distributed application consists of a server module and a clientGUI module for each participant. These components are launched and configured through an Application
Management System[13] that is accessible through a World Wide Web interface. However, the details of how the application is started is not important to this discussion.
Each participant’sGUI has a published variable,Cursors, which is a list aggregate containing information about all of the participant’s cursors. This representation allows an arbitrary number of participants to be present in a session, and supports the incremental addition and removal of participants. An aggregate mapping in each participant’sGUI defines how this aggregate is represented graphically. In this case, each cursor is represented as a labelled graphics item.
4.2
End-User Speci
fi
cation of Aggregate Mappings
InEUPHORIA, new data types can be created interactively and published by end-users through standard “dialog box” style user interfaces [16]. EUPHORIA supports the construction all Playground types, including arbitrarily complex nested types. Playground supports the following aggregate types: static array (fixed size), dynamic array (adjustable size), list, and mapping2. Each of these types can be used in forming aggregate mappings.
Aggregate mappings are defined by specifying relationships among the aggregate’s element type and a prototype instance of the visualization. An aggregate mapping is similar to the “project” operation of relational databases, since a subset of the element data fields may be “projected” onto the visualization. In EUPHORIA’s data boundary, the element type is displayed as part of the published aggregate variable. In the collaborative imaging example, eachGUI has a publishedCursors variable (Figure 5). The element type of this aggregate isCursor, a tuple which contains coordinate and label information (Figure 6a). A prototype instance is a set of graphics items and constraints that are used to specify how each aggregate element is to be represented graphically. In the collaborative imaging example, the prototype instance is a cursor widget consisting of various simple shapes (Figure 6b). As described in [16], widgets are constructed interactively by the end-user inEUPHORIA.
2. Playground’s “mapping” datatype should not to be confused with “aggregate mappings.” The mapping datatype is a function, in the mathematical sense, from domain values to range values. Aggregate map-ping is a mechanism for defining how aggregate data is to be represented graphically.
Figure 5: Collaborate medical imaging application. Each participant’s GUI has a publishedCursors aggregate.
Interprocess Communication
Internet
Paul’s GUI Ken’s GUI
Cursors Aggregate
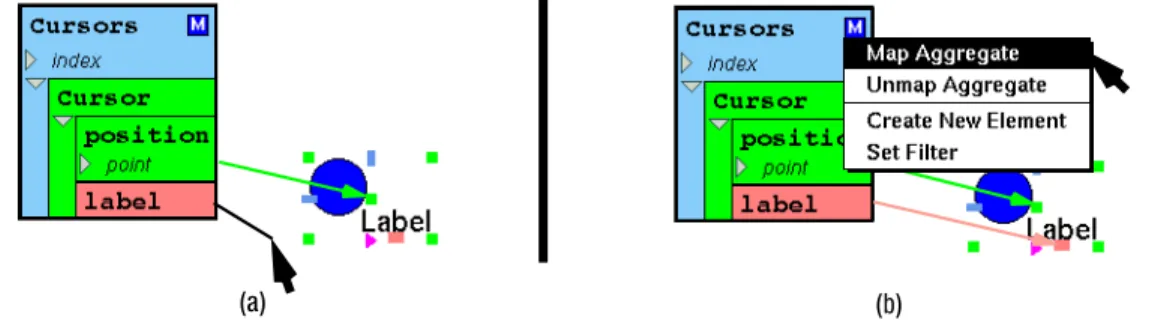
Recall that graphics object handles are used for forming constraint relationships in EUPHORIA (Section 3.2). Handles are also used in defining the equality relationships between the aggregate’s element type and the prototype instance. This is done by drawing connection lines between the prototype instance’s handles and the fields of the element type. For example, Figure 7a shows how the relationships for the incoming cursors of the collaborative imaging application are created. The prototype instance’s center handle is connected to thepositionfield of the element type. The instance’s text handle is connected to thelabel
field of the element type. As shown in Figure 7b, each aggregate has a pop up menu that is used to define aggregate operations. In this case, choosing “Map Aggregate” is used to specify that the required relationships are complete and the aggregate can be visualized.
For each aggregate element, EUPHORIA creates a copy of the prototype instance and inserts it into the visualization. Each copy’s attributes are constrained to the corresponding element fields according to the specified relationships between the element type and the prototype instance. The result is a collection of graphics instances whose attributes are associated with the aggregate’s elements. In the collaborative imaging example, a cursor widget is created for each aggregate element. Theposition andlabelfields of each element are connected to the attributes of each cursor through constraints. For example, thelabel
field is connected to the text handle, meaning that the text of the cursor displays the value of thelabel
field. Since multi-way constraints are used, consistency between the aggregate and its visualization is automatically enforced. External updates to the aggregate are propagated to visualization instances through constraints, resulting in display updates or animation (Figure 8). Similarly, user direct manipulation with the visualization instances causes state changes to be propagated back to the aggregate. In Playground, this results in the updated state being sent out to external modules3.
3. In the collaborative imaging application, theCursors aggregate mapping is used only for displaying the cursors of other participants. A separate cursor is created for each individual to control. This confi gura-tion adds the restricgura-tion that each participant can only move and change the label of their own cursor. Figure 6: (a) Aggregate with its associated element type exposed. (b) Prototype instance of the aggregate mapping.
Figure 7: (a) Creating relationships between the element type and prototype. (b) Performing the mapping operation.
element type aggregate
(list ofCursor) (seleprototype instancected, handles shown)
(a) (b)
implicit index mapping pop-up menu
Related Features
EUPHORIA offers other features that enable further customization of an aggregate mapping visualization. Since these features are general toEUPHORIA, and not specific to aggregate mappings, we list only a brief description of each in this paper. For more information on these and other features ofEUPHORIA, see[13], [14],[16]. Other features include:
• Customizable coordinate systems. • Hierarchical constraints (priority based). • Implicit aggregate indices.
• Arbitrary multi-way constraint computations.
First, it is possible to change the properties of the visualization coordinate system. This allows the data of the aggregate to be mapped using arbitrary, application-oriented coordinates, rather than the physical pixel values of the display. Second, in establishing constraints among prototype items and the element type, one can assign a priority “strength” value to each constraint. This can be used to customize the update and interaction behavior of mapping items. For instance, one could create anchor constraints on the prototype with a particular strength so that aggregate mapping items can only be modified by external modules and not by the user. Third, it is possible to use the “implicit index” value of each aggregate element (i.e., the index representing an element’s order in the aggregate) while forming an aggregate mapping. One use of this feature would be to create a layout of an aggregate’s elements. Fourth, in addition to the equality and anchor constraints described previously, EUPHORIA also allows end-users to create multi-way constraint computations from algebraic formulas (e.g., “x = y2 + 10”) using a “calculator” like interface. These constraints can be used to establish arbitrary relationships among prototype graphic items and the aggregate’s element type.
4.3
End-user Interaction with Aggregate Mappings
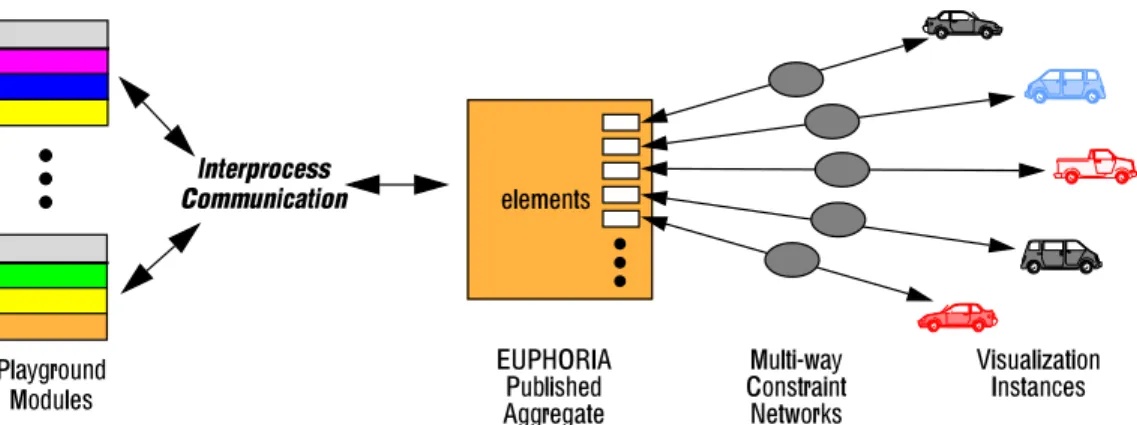
Given a mapped aggregate, the user can change the element data by manipulating the visualization. Depending on how the aggregate was mapped, visualization instances can be modified by moving, resizing, modifying textual values through typing, interacting with widgets, loading image data, and forming additional constraint relationships. Each of these actions can result in the propagation of updated
Figure 8: Communication among Playground modules and aggregate mappings.
Playground Modules
Interprocess
Communication elements
Multi-way Constraint Networks Visualization Instances EUPHORIA Published Aggregate
values through the mapping’s underlying multi-way constraint graph. These updates may then modify the aggregate’s underlying data elements. If the aggregate has outgoing logical connections, the modifications are communicated to external Playground modules (i.e., the underlying application components). In addition, users may also add or delete visualization elements to the aggregate mapping, resulting in the addition or deletion of data elements to the underlying aggregate.
End-users may edit how an aggregate is mapped at any time during the application’s execution. This is done by “unmapping” the aggregate through the aggregate’s pop-up menu, editing the prototype instance and its relationships, and remapping the aggregate.
4.4
Filtered Aggregate Mappings
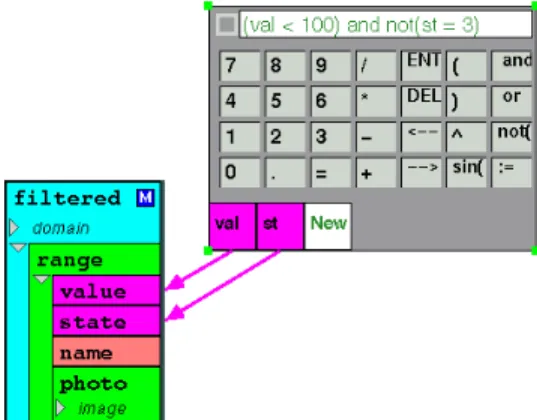
It is often advantageous to view only a subset of an aggregate’s elements. Filtering of extraneous elements results in a faster display that is easier to comprehend. For this reason, we have developed a mechanism that allows the end-user to filter an aggregate mapping’s displayed elements based on a predicate. This filtering operation is functionally similar to the “select” operation of relational databases.
Figure 9 shows how a filter is specified on an example aggregate. A calculator interface, mentioned earlier, allows the user to enter arbitrary computation formulas, including boolean expressions. At the bottom of the calculator, boxes are shown representing the variables of the computation. These variables can be connected to the aggregate’s element type fields and prototype instance attributes. In this example, a filter is created specifying “(val < 100) and not(st = 5).” Theval andst variables are connected to thevalue andstatefields of the aggregate’s element type. Once specified, the user can identify that this expression represents a filter of the aggregate mapping (i.e., as opposed to just a computation on values of the mapping) by choosing “Set Filter” from the aggregate’s pop-up menu. Once mapped, the calculator interface is hidden and only the elements of the aggregate satisfying the predicate are visualized by the aggregate mapping.
Some may argue that this approach is not consistent with standard visual programming methods of constructing computation components. We feel that since virtually all users are fluent with standard mathematical notation, this is the fastest and easiest way for end-users to specify simple computation and boolean predicates.
4.5
Joined Aggregate Mappings
Many times, single aggregates do not contain all of the relevant information needed to make a desired aggregate mapping. Instead, information may be spread among multiple aggregates and, in Playground, among modules of a distributed application. This is especially true of an application that is constructed from different components that were created by multiple programmers. With ajoined aggregate mapping, the data of multiple aggregates is coordinated within an aggregate mapping based on matching operations.
4.5.1 Motivating Example
We present the following example to motivate joined aggregate mappings. The Gallager-Humblet-Spira algorithm [8] is a distributed algorithm for computing the minimum spanning tree among a number of independent processes. Each process, implemented as a Playground module for this example, represents a vertex of a complete graph. The vertex modules work together to find the minimum spanning tree of the graph according to the Euclidean distance among the vertices. A message passing mechanism is used to coordinate the computation of the minimum spanning tree. Concurrently, tree fragments are formed by merging adjacent fragments, starting with single vertex fragments and ending with the minimum spanning tree.
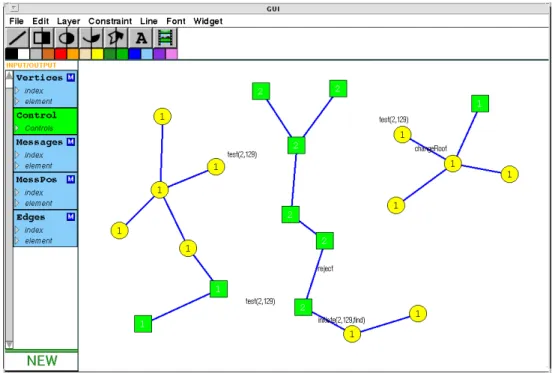
Figure 10 shows a EUPHORIA interactive visualization of the Gallager-Humblet-Spira algorithm during the execution of a 20 vertex graph. The visualization consists of vertex widgets, edge lines, and message text strings. As the algorithm progresses,EUPHORIA continuously updates the display to reflect the state of the application’s modules. The vertex widgets display the state of their underlying modules by changing shape (i.e., circles or squares), color, and level number (text value). Edge lines are added as the algorithm progresses and are removed upon resetting the computation. Message strings are used to show message passing communication between vertex pairs. When a vertex passes a message to another vertex, a textual representation is added to the display and is animated to move from the source vertex to the destination
vertex. Users can interact with the visualization by moving vertices, adding vertices, or deleting vertices. Each of these actions resets the state of the graph and re-executes the algorithm.
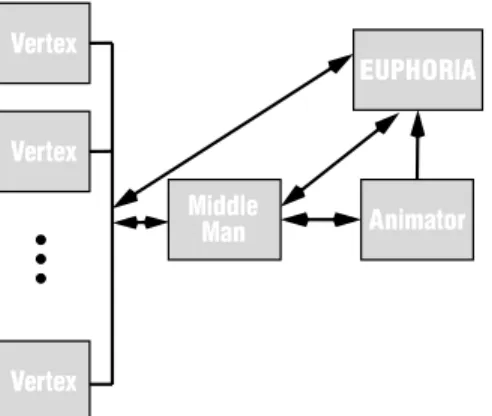
Figure 11 shows relationships among the modules of this application. The EUPHORIA module, which represents the visualization from Figure 10, is connected to each vertex module through the use of element-to-aggregate connections[9]. In this way,EUPHORIA gathers vertex information from each vertex module and combines it into a list published variable called Vertices (Figure 10). An intermediary module, called the “Middle Man,” is used to intercept messages passed among the vertices, providing EUPHORIA with the Messages and Edges aggregates (Figure 10). This module also monitors the
Vertices aggregate, and launches or terminates vertex modules in response to user addition or deletion of vertices.
A general purpose “Animator” module is used to animate the movement of the messages inEUPHORIA. EUPHORIA receives the animation positions of the active messages through theMessPos published list variable. Having EUPHORIA’s animation generated by separate modules gives application designers a great deal of flexibility in creating visualizations, allowing “plug-in” components. In addition, handing off complex animation computations to separate modules (running on different computers) can increase performance.
In this example, three aggregate mappings are used to visualize the vertices, edges, and messages, respectively, from the published variables described in the previous paragraphs. However, both the edges and the messages aggregate mappings require the use of joined aggregate mappings, as described in the next section.
4.5.2 End-user Speci
fi
cation of Joined Aggregate Mappings
The purpose of a joined aggregate mapping is to combine the data from multiple aggregates through the use of matching operations. The combined aggregate data is then used in creating an aggregate mapping. As an example, consider the visualization of the Edges aggregate of the minimum spanning tree application. This aggregate stores edge information in an aggregate containing reference ID pairs of vertices (Figure 12). In this case, vertex state information is not known to the module that provides the edge information (the Middle Man module). Instead, theVertices aggregate containing the state of each vertex is only available inEUPHORIA. The edge ordered pairs alone do not provide sufficient information to visualize the edges since the positions of each edge’s end points are not included. A joined aggregate
Figure 11: Modules of the minimum spanning tree application.
Vertex Middle Animator EUPHORIA Man Vertex Vertex
mapping allows the information of the Vertices aggregate to be used within the Edges aggregate mapping through a matching operation with theVertices idfield.
In EUPHORIA, end-users specify matching operations by connecting key fields of the element types of published aggregates. Connecting key fields is achieved in a way that is similar to how aggregate mapping relationships are formed: by drawing connection lines between fields of the aggregates’ element types. Connections are drawn from a key field in aprimary aggregate to a key field in aindexed aggregate. This has the effect of creating a virtual representation of the indexed aggregate’s element type in place of the primary aggregate’s key field. The virtual representation of the element type can then be used in forming an aggregate mapping.
For example, Figure 13 shows how an Edges aggregate (primary) is joined twice with a Vertices
aggregate (indexed). Figure 13a shows the unjoined representation of the Edges and Vertices
aggregates. Joining the firstidfield of theEdges element type with theidfield ofVertices element type creates a virtual representation of theVertex type in the Edges aggregate Figure 13b. Similarly, joining the second id field of the Edges element type with the idfield of the Vertices element type creates another virtual representation in theEdges aggregate.
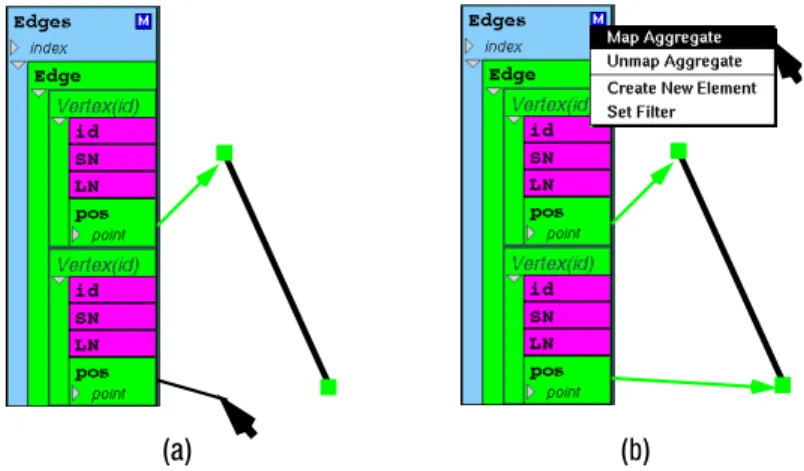
Figure 14 illustrates how the joinedEdges aggregate can be used in creating an aggregate mapping. In Figure 14a, the Vertex virtual representations are expanded, revealing the fields of that element type. Given a prototype instance of the aggregate mapping, a line graphics item in this case, the relationship between the joined aggregate and the prototype can be established by connecting the pos element fields
Figure 12: Using join to visualize graph edges.
Figure 13: Joining Edges and Vertices aggregates.
Vertices Edges
0
1
3
4
2
Join
list of: id pos list of: id id From vertex modules:Frommiddleman module: SN LN primary aggregate indexed aggregate (a) (b) (c)
(position of vertices) to the handle attributes of the prototype. Once these relationships are established, the aggregate can be mapped in the usual way (Figure 14b), resulting in the visualization of the graph’s edges. In a conventional join operation, a new aggregate representing the result of the join is created using the source aggregate data. However, this approach is not sufficient if one wants to manipulate the visualization, since changing a copy of the data will not affect the original. Our join operation does not create such copies. Instead, visualization instances are associated directly with both the original primary and indexed aggregates through the use of multi-way constraints. In this way, visualization instances may be “linked,” providing consistency among the aggregates and their visualizations. For example, in the minimum spanning tree application, theEdges aggregate is visualized using line graphics items through a join with theVertices aggregate. Separately, theVertices aggregate is visualized as vertex widgets. Since both visualizations use portions of same underlying data (vertex positions), manipulating either of these visualizations can affect the other. For instance, moving a vertex has the effect of changing the end point of each incident edge, updating the visualization of the edges as a result. Moving an edge has a similar effect on its end point vertices, and in turn, the edges connected to those vertices. Deleting a vertex also affects the edge mapping, removing all incident edges from the visualization.
4.5.3 Join Algorithm Overview
For each primary aggregate element (e.g., edge pair from the previous example), a matching operation is performed to find the indexed aggregate elements (e.g., vertices from the previous example) matching each of the key fields. The primary aggregate element and its matches are used to create aggregate mapping visualization instances (e.g., edge lines from the previous example). Since each key field can have multiple matches, a cross product operation may be used to create multiple visualization instances. For example, if half of the vertices have id=0 and half have id=1, specifying an edge of (0, 1) would result in the visualization of a bipartite graph (i.e., an edge between each 0 vertex and each 1 vertex). In this way, joined aggregates are functionally similar to “join” and “cross product” operations of relational databases. A joined aggregate’s matches may change incrementally over time in several different ways. For example, key field values of one or more primary and/or indexed aggregate elements may be changed at any time by its application. Also, values from primary and/or indexed aggregates may be added or removed at any time by either the application or the user. For reasonable performance, the storage for matches must be fast, must support cross products efficiently, must keep track of existing matches to avoid redundancy, and must be able to quickly remove matches in a variety of ways. See[13] for details on our algorithm for managing the matches of a joined aggregate.
Figure 14: Defining the Edges aggregate mapping.
5. Future Work
It would be helpful to have an end-user mechanism to specify the layout of aggregate mapping instances. Although the end-user can currently specify simple layouts through the use of an aggregate’s implicit indices and arbitrary constraint computations (Section 4.2), this approach can be cumbersome. Another approach to this problem would be to specify the layout graphically through induction-style rules. With this strategy, similar to a demonstrational approach[6],[17], the end-user would specify the mapping of the first aggregate element (base case) and the relationship between an aggregate instance k and the next element k+1. From this information, the system would inductively place each instance element of the aggregate. In addition, a number of boundary conditions could be included to deal with special cases. For example, consider the visualization of items in a row-column organized table. The position of each item is determined by the size of previous items and the dimensions of the table (i.e., for wrapping). With layout rules, the end-user could specify this organization inEUPHORIA without relying on external modules to explicitly set the position of each item.
6. Summary
We have presented aggregate mapping, a mechanism that enables end-users to visualize and manipulate the data of an aggregate, such as an array or a list. End-users specify aggregate mapping visualizations through visual programming techniques in theEUPHORIA user interface management system. No textual programming is required. Used in conjunction with The Programmers’ Playground distributed programming environment, aggregate mappings offer a way to customize distributed applications, enabling end-user construction of graphical user interfaces and visualizations. User interfaces and visualizations constructed in this way respond to both continuously changing aggregate data of a distributed application and end-user manipulation of the data through the visualization. Supporting this direct manipulation feedback to the application is particularly challenging because it means that all of the visualization steps are invertible so that changes of the resulting visualization can be mapped back to the application.
By nature, a distributed application’s state is divided among potentially many components. This property makes it difficult to construct visualizations since information must be combined from different sources in a meaningful way. We have presented several mechanisms to address this problem. Playground’s element-to-aggregate connection type enables data to be aggregated from many distributed application components. Filtered aggregate mappings enable the end-user to selectively view only certain aggregate elements, resulting in an display that is easier to understand. Joined aggregate mappings provides a way to combine data from multiple aggregates into a single aggregate mapping, using an end-user defined matching. These mechanisms are powerful tools in the construction of aggregate visualizations, providing functionality similar to that of project, select, join, and cross product of relational databases.
Acknowledgments
We thank David Saff for developing the calculator mechanism for creating arbitrary constraint computations. This research was supported in part by National Science Foundation grantsCCR-91-10029, CCR-94-12711, andARPA contractDABT63-95-C-0083.
References
Englewood Cliffs, N.J. Prentice-Hall, pages 65-98, 1972.
[2] Codd, E. F. “A relational model for large shared data banks,”Communications of the ACM, 13(6):377-387. [3] Cordy, James R. and T. C. Nicholas Graham. GVL: Visual Specification of Graphical Output. Journal of
Visual Languages and Computing 3(1):25-47, March 1992.
[4] Derthick, M., Kolojejchick, J. A., and Roth, S. F. An Interactive Visual Query Environment for Exploring Data. Proceedings of the ACM Symposium on User Interface Software and Technology (UIST '97), ACM Press, October 1997, pp 189-198.
[5] Fishkin, Ken and Stone, Maureen C. Enhanced Dynamic Queries via Movable Filters. Proceedings of CHI '95,(Denver, CO, May 8-11) ACM, New York, 1995, pp. 415-420.
[6] Frank, Martin R. Grizzly Bear: A demonstrational learning tool for a user interface specification language. In
Proceedings of the ACM Symposium on User Interface Software and Technology, Pittsburgh, Pennsylvania, pages 75-76, November 1995.
[7] Freeman-Benson, Bjorn, John Maloney, Alan Borning. An Incremental Constraint Solver.Communications of the ACM, 33(1):54-63, 1990.
[8] Gallager, R. G., P. A. Humblet, and P. M. Spira. A Distributed Algorithm for Minimum-Weight Spanning Trees. ACM Transactions on Programming Languages and Systems, 5(1):66-77, January 1983.
[9] Goldman, Kenneth J., Bala Swaminathan, T. Paul McCartney, Michael D. Anderson, and Ram Sethuraman. The Programmers’ Playground: I/O Abstraction for User-Configurable Distributed Applications. IEEE Transactions on Software Engineering, 21(9):735-746, September 1995.
[10] Jagadeesh, J. and Y. Wang. LabVIEW. Product Review,Computer, February 1993.
[11] Linton, Mark A., John M. Vlissides and Paul R. Calder. “Composing User Interfaces with InterViews.” IEEE Computer 22(2):8-22, February 1989.
[12] Microsoft Corporation. One Microsoft Way, Redmond, WA 98052-6399.
[13] McCartney T. Paul. End-user Construction and Configuration of Distributed Multimedia Applications. D.Sc. Dissertation, Washington University 1996. Also appears as Washington University Department of Computer Science technical report WUCS-96-24, September 1996.
[14] McCartney, T. Paul and Kenneth J. Goldman. EUPHORIA Reference Manual. Washington University Department of Computer Science WUCS-97-13, February 1997.
[15] McCartney, T. Paul and Kenneth J. Goldman. Visual Specification of Interprocess and Intraprocess Communication. InProceedings of the 10th International Symposium on Visual Languages, October 1994, pages 80-87.
[16] McCartney, T. Paul, Goldman, K., and Saff, D., “EUPHORIA: End-User Construction of Direct Manipulation User Interfaces for Distributed Applications,” Software-Concepts and Tools,16(4):147-159, December 1995. [17] Myers, Brad A. Creating User Interfaces by Demonstration. Academic Press, Boston, 1988.
[18] Myers, Brad A., et al. Garnet: Comprehensive Support for Graphical, Highly Interactive User Interfaces.
IEEE Computer, 23(11):71-85, November 1990.
[19] Papantonakis, A., and King, P. J. H. Synatx and semantics of GQL, a graphical query language. Journal of Visual Languages and Computing, 6:3-25, 1995.
[20] Roman, G.-C., Kenneth Cox, C. D. Wilcox, and J. Y. Plun. Pavane: a system for declarative visualization of concurrent computations. Journal of Visual Languages and Computing 3, 161-193.
[21] Roth, S.F., Kolojejchick, J., Mattis, J., and Goldstein, J., Interactive Graphic Design Using Automatic Presentation Knowledge, Proceedings of the Conference on Human Factors in Computing Systems (SIGCHI '94), Boston, MA, April 1994, pp. 112-117.