1994 Michigan Boating Survey
TABLE OF CONTENTS
Page
List of Tables ... iii
List of Figures ... v
Introduction ... 1
Study Objectives ... 2
Methods ... 2
The Population of Active Registered Pleasure Craft ... 3
Sampling Design ... 4 Measurement ... 7 Data Gathering ... 8 Survey Response Response Rate ... 9 Inactive Boats ... 11 Weights ... 12
Success of the Questionnaire ... 14
Results: Fleet and Owner Characteristics ... 14
Boat Owners ... 14
The Michigan Active Registered Pleasure Boating Fleet ... 15
Boat Segments ... 19
Boating Activity ... 22
Boating Use in 1994 ... 25
Boating Spending ... 27
Toilet Facilities ... 29
Summary of Boat Use and Characteristics by Segment ... 32
Regional Distribution of Use ... 36
The Approach ... 36
Results ... 41
Trends in Boating Activity ... 51
Number of Active Craft ... 51
Days of Use ... 54
Other Trends ... 55
Recommendations ... 56
Boat Owner Survey Design ... 57
A Statewide Boating Information System ... 58
LIST OF TABLES
1. Number of registered watercraft (summer 1994) by region of registration and size class ... 4
2. Distribution of sample by size class and region of registration ... 5
3. 1994 Michigan boater survey response rate ... 9
4. Response rates by region of registration and boat size class ... 10
5. Completed sample of active boats by region of registration and boat size class ... 11
6. Percentage of registered boats inactive in 1994 by boat size class ... 12
7. Number of active watercraft (summer 1994) by region of registration and size class ... 12
8. Weights to adjust the sample to michigan’s active registered fleet ... 13
9. Weighted sample by region of registration and size class ... 13
10. Multiple boat ownership ... 14
11. Boat owner characteristics by type of boat ... 16
12. Boat type and storage by size of boat ... 17
13. Size of boat by boat type and storage ... 18
14. Boat segments ... 20
15. Boat owner characteristics by segment ... 21
16. Types of boating use by segment and size class ... 22
17. Transporting and launching by segment and size class ... 23
18. Temporary use of marina spaces by segment and size class ... 24
19. Frequency of boat use by segment and size class ... 26
20. Boat use by great lakes vs. inland locations ... 26
21. Boat operating expenses by size of boat ... 27
22. Annual boat operating expenses by segment ... 28
23. 1994 Michigan registered boat fuel use by size class ... 29
24. Number of boats with toilet facilities by segment and size class ... 30
25. Toilet use by boat size class ... 31
26. Summary by boat size class ... 33
27. Summary by boat storage categories ... 34
28. Summary by great lake vs. inland usage ... 35
29. Number of boats by segment and region where the boat is kept during the boating season ... 38
30. Number of boats by segment and county where the boat is kept ... 39
31. Total boat days by segment and region where the boat is kept ... 42
32. Total great lakes boat days by segment and region where the boat is kept ... 43
33. Total inland boat days by segment and region where the boat is kept ... 43
LIST OF TABLES (Continued)
35. Number of boats stored at marinas by segment and region where the boat is kept ... 44
36. Number of boats with installed toilets (head) by segment & storage region ... 45
37. Number of times pumped out by segment and region where the boat is kept ... 45
38. Total boat operating expenses by segment and region where the boat is kept ($millions)... 46
39. Gallons of boat fuel purchased by segment and region where the boat is kept (millions) ... 46
40. Estimates of boat use by county where the boat is kept ... 47
41. Boats with installed toilets (head) and total pumpout use by county where the boat is kept .... 48
42. Boats stored at seasonal homes and marinas by county where the boat is kept ... 49
43. Boat operating expenses and fuel purchases by county where the boat is kept ... 50
44. Trends in boating activity, 1971-1994 (unadjusted) ... 52
LIST OF FIGURES
1. 1994 Michigan Boat registrations by month ... 3
2. Sampling regions ... 6
3. Survey response by date of return ... 9
4. Boating regions for estimating use and needs ... 37
Clean Vessel Act/Michigan Boating Study, 1994-95: REPORT 2
1994 Michigan Boating Survey
Daniel J. Stynes, Tsung Chiung Wu and Edward M. Mahoney
INTRODUCTION
The 1994 Michigan Boating Survey was conducted in conjunction with a broader effort to assess both boating supply and demand in order to guide development, planning and management of facilities for boaters throughout the state. The purpose of the registered boat owner survey is to measure patterns of boating activity as a basis for evaluating current and anticipated future needs. The 1994 survey extends the series of statewide boater surveys in Michigan dating back to 1965. In addition to gathering current information about general patterns of boating activity around the state, the 1994 survey focuses especially on Great Lakes boating and boater use of marinas and sanitation facilities.
The mailed survey of a representative sample of almost 4,000 boat owners (returns) provides projectible totals of days of boat use on both Great Lakes and inland waters and precise estimates of the number of craft with portable and installed toilets. Models estimated from the survey data provide projections of the number of craft, days of boating, and use of dump stations and pumpout facilities down to a county level. Assessments of needs for marina and pumpout facilities around the state are presented in separate reports . The approach is to combine quantitative demand estimates from the registered boater survey (this report) with supply data from a
comprehensive statewide inventory of marinas (Report 1) to assess needs for Great Lakes marina facilities and pumpouts (Report 3). The quantitative needs analysis is supplemented by more qualitative information about boater attitudes and behavior gathered in a follow-up to the general boater survey and in focus groups around the state (Report 3).
In this report, we present the methods and results of the general boat owner survey. Readers are reminded that the study covers only boats that were registered in Michigan during the 1994 boating season. Smaller
unpowered craft and boats visiting Michigan waters from out of state are not included in the study population. The survey does, however, include some 34,000 boats that are registered in Michigan from out-of-state origins. These are primarily boats owned by non-residents that are berthed at marinas or seasonal homes in Michigan and used principally in Michigan waters.
STUDY OBJECTIVES
1. Describe the characteristics of boats and boat owners. Develop market segments that are useful for characterizing the fleet and estimating demands for boating facilities and services.
2. Estimate boating activity in Michigan for 1994 including:
• Great Lakes and inland boat days by origin and destination regions.
• Boat days by boat size and storage class.
• Use of marinas, launch sites and pumpout facilities by boat size and storage categories. 3. Estimate boater operating expenses in 1994 for equipment, repairs, insurance, storage and fuel.
4. Identify the number, types and spatial distribution of boats with toilet facilities (fixed and portable) and estimate boater use of pumpout facilities in Michigan.
5. Identify trends in boating activity in Michigan via comparisons with previous surveys.
METHODS
The procedures follow those of previous boater surveys in Michigan to provide comparable results and make use of tested designs. An end-of-season mailed survey is used to gather information from a stratified random sample of registered boat owners. Some adjustments were made in the previous mailed survey instrument to accommodate questions related to the Clean Vessel Act and focus more attention on Great Lakes boating use and
facility needs. The approach to gathering the number of days a boat was used was also modified somewhat from previous designs to avoid potential double counting.
The Population of Active Registered Pleasure Craft
The study population consists of all non-commercial watercraft with valid Michigan registrations as of July 1, 1994. The computer file of registered watercraft maintained by Michigan’s Secretary of State provides a convenient sampling frame, though it includes a number of boats that were inactive in 1994 or had expired registrations. The number of registered craft on the monthly reports of registrations for 1994 increased from 840,760 in January to 901,480 in December (Figure 1). These counts include commercial and other non-pleasure boats as well as about 100,000 registrations that had expired in 1992 and 1993.
We estimate the number of valid registrations for the 1994 boating season at about 770,000 boats. This is a sum of the December count of watercraft with registrations expiring in 1995, 1996 or 1997 plus one-third of the 1994 expirations remaining in December. The 60,898 craft with 1994 expirations in December are boats with registrations that had not yet been renewed by the end of 1994. Based on previous years, we estimate that up to a third could be included in our sample of boats with valid registrations as of July 1994. Note that no boats with 1992
Figure 1. Michigan Boat Registrations by Month, 1994
-50,000 100,000 150,000 200,000 250,000 300,000 350,000 400,000 450,000 500,000 550,000 600,000 650,000 700,000 750,000 800,000 850,000 900,000 950,000
Jan Feb Mar Apr May Jun Jul Aug Sep Oct Nov Dec
Month
Number of Registered Boats
770,000 valid registrations in 1994 1995 expirations 1996 expirations 1997 expirations 1994 expirations 1993 expirations 1992 expirations
or 1993 expirations were included in our sample. The December count of boats with 1997 expirations includes all boats newly registered in 1994 and all of the boats with 1994 expirations that were renewed. Multiplying the 770,000 valid registrations by the percentage of registered boats classified as pleasure craft ( 97.35 percent) yields 749,518 pleasure craft with valid Michigan registrations in 1994 (Table 1).
Table 1. Number of registered watercraft (summer 1994) by region of registration and size class.a SIZE OF BOAT (feet)
REGIONb <16' 16 to 20’ 21 to 28’ >29' Total
Southeast Michigan 13,769 74,747 46,615 12,262 247,393 Southwest Michigan 79,598 33,873 15,020 2,062 130,553 West Central Michigan 58,952 25,471 11,609 2,776 98,808 Thumb Region 50,694 27,209 12,734 2,035 92,672 Northeast Michigan 17,731 9,229 3,868 276 31,105 Northwest Michigan 35,893 16,068 6,895 1,033 59,890 Straits 13,585 5,079 2,633 461 21,758 U.P. Lake Superior 16,677 4,925 1,538 247 23,387 U.P. Lake Michigan 6,298 1,883 491 120 8,792 Out of state 17,060 9,806 5,579 1,929 34,374
Missing registration county 362 221 151 52 786
Total 410,619 208,512 107,134 23,253 749,518 a. Includes only boats with valid registrations during the summer of 1994.
Estimated from March registration statistics by county and size class provided by Michigan Secretary of State. b. Sampling regions are shown in Figure 2.
Sampling Design
A stratified random sample of approximately 10,000 boats was drawn by the Secretary of State’s office from the list of valid registrations on July 1, 1994. We then sampled from this list of names and addresses to obtain the desired sample size of 6,000 boats. The sample is stratified by four boat size classes ( <16 feet, 16 to 20 feet, 21 to 28 feet and 29 feet and over) and 10 boating regions (see Figure 2). The boating regions were developed in the 1980 Michigan Boater Survey (Stynes and Safronoff, 1982) to capture Great Lakes market regions. As in prevous boater surveys, we intentionally oversampled larger craft and regions with smaller population sizes to have adequate subsamples to make estimates by size class and region. The oversampling of larger boats was also
designed to assure adequate numbers of boats stored at marinas, boats using Great Lakes waters and boats having toilet facilities on board. These subgroups of boaters are particularly important to assess marina and pumpout facility needs.
A sample of 6,000 boats was selected from the names and addresses provided by the Secretary of State to yield roughly 1,500 boats within each of the four size classes (see Table 2). Because pontoon boats are primarily used on inland waters, they were sampled at half the rate of other craft to yield 560 pontoon boats in the final sample. The sampling unit is the boat, not the boat owner. For boaters owning more than one registered boat, we requested that they report only for the boat that was sampled. The type and size of the boat were printed on the mailing label to identify the boat for which we were requesting information. By matching survey responses with the registration information, we were able to verify that subjects reported for the boat that was sampled. Owners reporting for more than one boat were excluded from the analysis.
Table 2. Distribution of sample by size class and region of registration. SIZE OF BOAT (Feet)
REGIONa <16' 16 to 20’ 21 to 28’ >29' Total Percent
Southeast Michigan 350 209 357 329 1,244 21% Southwest Michigan 267 211 122 224 824 14% West Central Michigan 213 169 144 193 719 12% Thumb Region 201 230 177 238 846 14% Northeast Michigan 98 114 79 78 369 6% Northwest Michigan 190 202 155 190 737 12% Straits 60 98 92 99 349 6% U.P. Lake Superior 45 115 118 64 342 6% U.P. Lake Michigan 14 44 48 29 135 2%
Out of state 26 137 129 145 437 7%
Total 1,463 1,528 1,420 1,588 6,000 100%
Percent 24% 25% 24% 26% 100%
Measurement
A four-page mailed questionnaire, similar to those used in previous boater surveys, was used to gather the information. The questionnaire (see Appendix A) was developed by making adjustments to the 1980 (Stynes and Safronoff, 1982) and 1986 (Talhelm et al., 1988) Michigan boater survey instruments. Information gathered included:
• Characteristics of boats, boat owners and boating households.
• Information on where the boat is kept during the boating season and the use of marinas and launching facilities.
• Boating use for 1994 divided between Great Lakes and inland waters and reported by county.
• Annual expenses on the boat for equipment, repairs, insurance, storage and fuel.
• Presence of toilet facilities on the boat and use of pumpouts.
The most notable changes from previous boater surveys were:
1. Categories identifying where the boat is kept during the boating season were expanded to further differentiate types of marinas (public, commercial, dockaminium and yacht/boat clubs) and to better cover dry stack facilities and other kinds of storage.
2. Measures of boating use by county on Great Lakes and inland waters were adjusted to reduce potential double counting and assure consistent totals. In 1980, separate tables were used to report Great Lakes and inland use (inland lake, river or stream). A third table was added in 1986, separating use of rivers and streams from use of inland lakes. In the 1980 and 1986 surveys, total use was estimated by adding up the use reported by county under Great Lake, inland, and stream categories. Given the difficulty in distinguishing between the three categories, particulary when boating in Michigan’s drowned river mouths and Great Lakes connecting waters, some double reporting likely occurred. Double counting also could occur when boaters report use in more than one county on a given day.
The 1994 instrument first asks for the total number of days the boat was used in Michigan waters in 1994. The boat owner then divides this use between Great Lakes and inland waters, and then in a table itemizes the number of days within each county (see question 10 on questionnaire).
3. Our definition of boating use on Great Lakes waters was “any day the boat was underway on the Great Lakes and connecting waterways (Lakes Huron, Superior, Erie, Michigan and St. Clair; and the St. Mary’s, St. Clair and Detroit Rivers), including lakes and rivers that provide access to the Great Lakes.” Our intent was to include boating use on river mouths and lakes that provide direct access to the Great Lakes as Great Lakes use, because many facilities for Great Lakes boaters are located here and boaters will frequently use both Great Lakes waters and these connecting lakes and streams on a single day. Some confusion likely remains between “Great Lakes” and “inland waters”, but the revised procedures appear to improve the reliability and validity of the use measures. In particular, we can guarantee that for each boater, the estimates of Great Lakes and inland use by county add up to the total days reported. 4. Several questions were added to gather information relative to Michigan’s efforts to determine needs for
pumpout facilities and dump stations (questions 16a-d). The objectives for the registered boater survey include estimating the number and types of watercraft with portable or fixed toilet facilities, the frequency of use of on-board toilet facilities, and the use of pumpout facilities and dump stations. A follow-up survey of a sample of boaters agreeing to complete an additional questionnaire gathered more detailed attitudinal information about boaters’ use of toilets and pumpout facilities (see Report 3). Data from the registered boater survey are combined with results of the follow-up survey and focus group interviews in Talhelm et al. (Report 3) to assess needs for pumpout facilities and educational and other programs.
Data Gathering
A first-class mailing to the sample of 6,000 boat owners was followed by a certified letter to those who had not responded within three weeks. Questionnaires were numbered sequentially to trace returns for follow-ups and to match the returns with data on the registration file. A business reply return address was printed on the questionnaire. The initial questionnaires were mailed October 7 by first-class mail. A cover letter explained the study, noted that participation was voluntary and explained procedures for assuring confidentiality of the
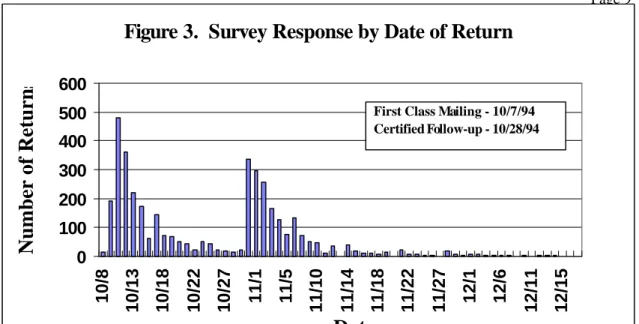
responses. Three weeks later, a second complete mailing was sent by certified letter to all subjects who had not yet responded (4,000). Surveys were coded and cleaned as they were received using the SPSS Data Entry software. Figure 3 shows the pattern of survey response by week.
SURVEY RESPONSE
Response RateApproximately 2,000 responses were received within three weeks of the initial mailing and another 2,277 after the follow-up mailings for an overall response rate of about 70 percent of the deliverable surveys (6 percent of mailings were returned as undeliverable because of faulty addresses). About 20 percent (743 responses) of the boat owners returning usable surveys indicated that their boats were not used in 1994; another 83 boaters reported for more than one boat. Omitting inactive craft, multiple-boat responses, and other unusable returns resulted in a sample of 2,980 boats for our primary analyses (Table 3).
Table 3. 1994 Michigan boater survey response rate.
Total Questionnaires Mailed
N Pct of total Pct of deliverable
Total questionnaires mailed 6,000 100.0%
Not deliverable 362 6.0% Delivered 5,638 93.9% 100.0% Returned surveys 3,909 65.1% 69.3% Active boats 2,980 49.6% 52.9% Inactive boats 743 12.4% 13.2% Non-usable questionnairesa 186 3.1% 3.3% Nonresponse 1,729 28.8% 30.7%
a. The 186 non-usable questionnaires included 25 incomplete surveys, 78 boats that had been sold or disposed of in 1994 and 83 boat owners who reported for more than one boat.
Figure 3. Survey Response by Date of Return
0
100
200
300
400
500
600
10/8
10/13
10/18
10/22
10/27
11/1
11/5
11/10
11/14
11/18
11/22
11/27
12/1
12/6
12/11
12/15
First Class Mailing - 10/7/94 Certified Follow-up - 10/28/94
Number of Returns
Rates of response are fairly uniform across counties and size classes. As in previous surveys, response rates are slightly lower in southeastern Michigan. The sample includes higher proportions of boats in larger size classes and from northern Michigan to yield adequate samples for the Great Lakes counties and regions (Table 4)
The sampling plan succeeded in obtaining good size samples in all of our key subgroups. The sample includes more than 700 boats in each size class, almost 1,000 boats stored at marinas, 1,500 boats kept at Great Lakes waterfront sites, 650 boats kept at inland waterfront sites, 650 boats at non-waterfront sites, 1,260 boats with toilet facilities and 900 boats with a installed heads. The regional distribution of responses provides samples ranges from 724 in southeastern Michigan to 95 in the Lake Michigan section of the Upper Peninsula (Table 5). A sample of 3,000 boats yields sampling errors of plus or minus 1 percent (95% confidence interval) on binomial distributed variables (yes or no); subgroups of 1,000 are accurate to plus or minus 2 to 3 percent and subgroups of 500 within plus or minus 5 percent. Models are estimated from the survey data and applied to registration statistics to increase the reliability of estimates at the county level.
Table 4. Response rates by region of registration and boat size class.
Mailings Returnsa Undeliverable Response rateb
SAMPLING REGION
Southeast Michigan 1,244 724 100 63%
Southwest Michigan 824 531 44 68% West Central Michigan 719 497 36 73%
Thumb Region 846 559 44 70%
Northeast Michigan 369 251 20 72% Northwest Michigan 737 475 45 69%
Straits 349 243 19 74%
U.P. Lake Superior 342 233 16 71% U.P. Lake Michigan 135 95 6 74%
Out of State 437 297 35 74%
BOAT SIZE CLASS
Less than 16' 1,463 948 83 69%
16 to 20' 1,528 1,022 76 70%
21 to 28' 1,420 911 93 69%
Larger than 29' 1,588 1,024 113 69%
Total 6,000 3,909 365 69%
Table 5. Completed sample of active boats by region of registration and boat size class. SIZE OF BOAT (feet)
REGION <16' 16 to 20' 21 to 28' >29' Totala
Southeast Michigan 145 90 152 151 538
Southwest Michigan 112 99 63 139 413
West Central Michigan 104 85 71 123 383
Thumb Region 78 92 93 138 401
Northeast Michigan 46 54 45 45 190
Northwest Michigan 79 99 81 101 360
Straits 24 46 59 63 192
U.P. Lake Superior 18 58 71 41 188
U.P. Lake Michigan 6 24 25 19 74
Out of state 12 78 77 70 237
Total 624 725 737 890 2976
a. Four surveys were returned without numbers to identify the registration county.
Inactive Boats
Not all registered boats were active in 1994. Active craft were defined as boats used in Michigan waters at least once in 1994. Boat owners were asked to check a box at the top of the questionnaire if their boat was not used in Michigan in 1994. About a quarter of all registered boats were inactive in 1994 (Table 6). The percentage of boats that were inactive varied by size class, dropping from 30 percent for boats under 16 feet in length to 25 percent for boats 16 to 20 feet, to 15 percent for boats 21 to 28 feet to 10 percent for boats over 29 feet. Rates of inactivity could be slightly higher, given that owners of inactive boats may have been less likely to return the survey instrument.
The rate of inactivity is up somewhat from 1980, when 14.5 percent of the boat owners sampled reported their boats were not used in that year (Stynes and Safronoff, 1982). The 1980 figure, however, was not adjusted for the disproportionate sampling across size classes. The 1980 rate would be comparable to the raw percentage of inactive boats in the 1994 sample, about 20 percent. The rate of inactivity in the 1986 survey appears to have been considerably underestimated at 6.5 percent. An aging boating fleet and boat owner population are factors likely contributing to somewhat higher rates of inactivity in 1994.
Applying the rate of inactivity for each size class to the number of registered pleasure craft (Table 1) yields a population of 555,188 active pleasure craft with valid registrations . The number and distribution of these boats by size class and region in Table 7 is the population of boats to which survey estimates are expanded
Table 6. Percentage of registered boats inactive in 1994 by boat size class.
BOAT SIZE CLASS Usable returnsa Inactive boats Active boatsa Pct inactiveb
Less than 16' 893 269 624 30% 16 to 20' 968 243 725 25% 21 to 28' 866 129 737 15%
Larger than 29' 992 102 890 10%
Total 3,723 743 2,980 25%
a. Four surveys were returned without numbers to identify the registration county. b. Inactive percent = inactive/ (active+inactive).
Weights
Because we sampled disproportionately across regions and size categories, weights are needed to adjust the final sample of completed boater surveys to the population of active pleasure craft with valid Michigan registrations during the summer of 1994. The distribution of boats in the population by size, type and county of registration is known, so we can adjust for the disproportionate sampling to provide estimates that will represent the registered boating fleet as a whole. Weights are assigned for each boat size class, region and type to expand the final completed sample to the population of active registered watercraft. The weights for pontoon boats and non-pontoon boats are shown in Table 8 for each size class and region. These weights are
Table 7. Number of active watercraft (summer 1994) by region of registration and size class.a SIZE OF BOAT (feet)
REGION <16' 16 to 20' 21 to 28' >29' Total Percent
Southeast Michigan 79,498 55,983 39,671 11,001 186,154 34%
Southwest Michigan 55,620 25,370 12,783 1,850 95,625 17%
West Central Michigan 41,194 19,077 9,880 2,491 72,644 13%
Thumb Region 35,423 20,379 10,838 1,825 68,469 12%
Northeast Michigan 12,390 6,912 3,292 248 22,847 4%
Northwest Michigan 25,081 12,035 5,868 927 43,917 8%
Straits 9,493 3,804 2,241 414 15,958 3%
U.P. Lake Superior 11,653 3,688 1,309 221 16,880 3%
U.P. Lake Michigan 4,401 1,411 418 108 6,346 1%
Out of state 11,921 7,344 4,748 1,731 25,754 5%
Unknown 253 166 129 46 594 0%
Total 286,927 156,168 91,175 20,862 555,188 100%
Percent 52% 28% 16% 4% 100%
derived by first dividing the cell counts in Table 7 by the number of completed surveys in each corresponding category from Table 5. Resulting weights were then further adjusted to correct for disproportionate sampling of pontoon boats. The distribution of the final weighted sample by region of registration and size class is shown in Table 9. Comparison of Tables 7 and 9 shows that the weighting scheme successfully adjusts the sample to the 1994 active registered boating fleet.
Table 8. Weights to adjust the sample to Michigan's active registered fleet.
NON-PONTOON BOATS PONTOON BOATS
Size of boat (feet) Size of boat (feet)
REGION <16' 16 to 20' 21 to 28' >29' <16' 16 to 20' 21 to 28' >29'
Southeast Michigan 692 502 245 68 158 545 500 69
Southwest Michigan 539 243 127 13 287 170 385 14
West Central Michigan 475 219 108 20 164 151 194 20
Thumb Region 519 213 95 14 219 103 250 13
Northeast Michigan 315 155 44 6 95 99 69 6
Northwest Michigan 372 113 53 10 219 125 96 9
Straits 432 74 29 7 305 240 80 7
U.P. Lake Superior 583 60 14 6 497 126 40 5
U.P. Lake Michigan 635 66 13 7 163 20 47 6
Out of state 982 98 45 25 132 105 135 25 Average weight 531 209 94 22 219 149 223 90
Table 9. Weighted sample by region of registration and size class.
SIZE OF BOAT (feet)
REGION <16' 16 to 20' 21 to 28' >29' Total Percent
Southeast Michigan 79,555 56,098 39,636 10,822 186,111 34% Southwest Michigan 55,709 25,422 12,809 1,777 95,717 17% West Central Michigan 41,247 19,116 9,900 2,511 72,774 13%
Thumb Region 35,363 20,421 10,657 1,849 68,290 12%
Northeast Michigan 12,394 6,926 3,299 243 22,861 4% Northwest Michigan 24,997 12,059 5,880 944 43,880 8% Straits 9,525 3,812 2,245 426 16,008 3% U.P. Lake Superior 11,686 3,696 1,312 229 16,922 3% U.P. Lake Michigan 4,457 1,413 418 123 6,412 1% Out of State 11,945 7,359 4,554 1,740 25,599 5%
Unknown 0 568 0 45 612 0%
Total 286,878 156,891 90,711 20,708 555,188 100%
Success of the Questionnaire
The questionnaire and overall approach worked well. The use of a single certified mailing for follow up was very effective though it generated a number of complaints from boat owners about inconvenience or use of public monies. The certified letter doubled the response rate and actually cost less than multiple postcard and first-class mail reminders would have.
The most significant problems in the instrument itself were respondents reporting for more than one boat and use estimates not consistently adding to the totals. Eighty-three respondents reported for more than one boat in spite of the instructions in the survey instrument and the cover letter. Reports of boat use in 1994 were carefully checked and edited to assure that Great Lakes and inland estimates add up to totals and boat use by county adds to this same total. Careful examination of the responses to the 1994 questionnaire suggests that double counting problems may have been considerable in previous surveys. There remains some inevitable fuzziness in
respondents’ understandings of distinctions between public and commercial marinas and what constitutes Great Lakes and connecting waters vs. inland waters.
RESULTS: FLEET AND OWNER CHARACTERISTICS
Boat OwnersTo describe boat owners, we must first adjust the sample for multiple boat ownership. The 555,000 active boats are owned by 439,000 boat owners. Owners with more than one registered boat would have a greater chance of being chosen in our sample than owners of a single boat, so cases were weighted inversely to the number of boats owned. Eighty percent of the boat owners own single boats, while 15 percent own two boats and 5 percent more than two (Table 10).
Table 10. Multiple boat ownership.a
Number of boats owned Percent Number of owners
1 boat 80% 351,857
2 boats 15% 65,773
3 boats 4% 15,966
4 or more boats 1% 5,329
100% 438,925
a. Unit of analysis in this table is the boat owner. The sample of boats was weighted inversely to the number of boats owned by each respondent.
Boat ownership cuts across a wide spectrum of demographic and socioeconomic groups. Boat owners are considerably older than Michigan’s population and have somewhat higher incomes. The median age of boat owners is 56 and the median income is just under $40,000 a year. About half of all boat-owning households have one or more children in the household. Almost a third of boat owners own seasonal homes (Table 11). The geographic distribution of boat owners reflects Michigan’s population distribution, though per capita rates of boat ownership are lower in southern, inland and metropolitan regions ( see Table B4 in Appendix B). The number of active registered boats as a percentage of the number of residents of the county varies from 2 percent in Wayne County to more than 20 percent in Roscommon and Leelanau counties. These differences in part capture the greater propensity to own boats in areas with ample boating opportunities, but they also result from inconsistency in whether boat owners choose to register their boats from their permanent residences or in the counties where they keep the boats -- i.e., at seasonal homes or marinas.
Owner characteristics vary quite a bit with type of craft. More than half of pontoon boat owners are over 60 years of age, compared with 31 percent of sailboat and inboard owners. Sailboat owners have the highest incomes of owners, followed closely by owners of inboards (Table 11).
The Michigan Active Registered Pleasure Boating Fleet
The active registered fleet is made up mostly of smaller craft. Eighty percent of all active registered boats are 20 feet or less in length. Four percent of registered craft are over 29 feet. More than half of all registered craft are outboards; 24 percent are inboards (including inboard/outboards). Sailboats make up 6 percent of the fleet, pontoons 8 percent and canoes/row boats another 7 percent. Sailboats are slightly underrepresented in the sample. Unpowered craft under 16 feet do not need registrations and, therefore, are not included in this study (Table 12).
Sixty percent of boats are kept at the owners’ permanent residences during the boating season, a fourth at seasonal homes, and about 11 percent at marinas or yacht clubs. Marinas provide storage primarily for larger boats. The percentage of craft kept in a marina or yacht club increases from 1 percent for boats under 16 feet, to 10 percent for boats 16-20 feet long, to 31 percent for boats 21 to 28 feet long to 78 percent for boats over 29 feet in length. Just under 40 percent of boats are kept in the water during the boating season, 55 percent on land, and small percentages in dry stack and other locations. Two out of five boats are kept at non-waterfront locations and
transported to boating sites. Over a third are kept at inland waterfront sites (lake or river) and almost a fourth are kept at Great Lakes waterfront sites (Table 12).
Table 11. Boat owner characteristics by type of boat.
aBoat type
Inboardb Outboard Sail Pontoon Canoe/row Total
percent AGE OF BOAT OWNER
younger than 40 22 22 19 11 21 21 41-50 26 16 31 15 20 19 51-60 21 17 19 17 12 17 61-65 9 10 11 15 11 11 66-70 10 15 7 17 16 14 Older than 70 12 21 13 24 20 19 100 100 100 100 100 100
NO. OF ADULTS IN THE HOUSEHOLD 1 17 17 28 17 21 18 2 70 71 66 72 64 70 3 8 8 3 8 12 8 4 4 3 3 2 3 3 5 or more 1 1 0 0 0 1 100 100 100 100 100 100
HOUSEHOLDS WITH CHILDREN no children 51 53 54 68 53 53
1 child 20 21 18 16 17 20
2 children 17 15 18 10 20 15
3 children 9 8 7 4 6 8
more than 4 children 4 3 3 1 3 4 100 100 100 100 100 100 HOUSEHOLD INCOME Under $20,000 10 28 7 21 21 22 $20,000-$39,999 27 36 17 41 41 34 $40,000-$59,999 26 22 27 22 18 23 $60,000-$99,999 22 13 29 12 20 16 Over $100,000 15 2 20 5 1 6 100 100 100 100 100 100 SEASONAL HOME
Own a seasonal home in Michigan 32 29 20 42 38 31
Do not own a seasonal home in Michigan
68 72 80 59 62 69
100 100 100 100 100 100
a. Unit of analysis in this table is the boat owner. The sample of boats was weighted inversely to number of boats owned by each respondent.
Almost 70 percent of boats kept at non-waterfront sites are less than 16 feet long. Marinas in general and dockaminiums and yacht clubs in particular house the largest boats. Boats at Great Lakes waterfront sites tend to be significantly larger than those at inland sites (Table 13). Boat storage locations are important because they are the best predictors of where boats are used and, along with boat size, explain the types and amounts of use. Boat summer storage locations and size therefore provide the basis for the primary segmentation of boats used throughout this report.
Table 12. Boat type and storage by size of boat.
Size of boat <16' 16 to 20' 21 to 28' >29' Total column percent BOAT TYPE Inboard 1.1 28.4 45.5 65.6 18.5 Inboard/outboard 0.8 12.5 8.7 3.4 5.5 Outboard 81.5 43.9 6.2 0.8 55.5 Sail, unpowered 0.9 2.0 1.3 1.3 1.3
Sail, with power 0.0 0.6 9.0 27.4 2.7
Pontoon 0.6 9.1 29.1 1.3 7.7 Canoe or rowboat 14.2 3.2 0.1 0.0 8.2 Personal watercraft 0.4 0.2 0.0 0.0 0.3 Other 0.5 0.2 0.1 0.2 0.3 100.0 100.0 100.0 100.0 100.0 STORAGE FACILITY Permanent residence 68.4 60.6 39.7 13.4 59.4
Cottage or second home 26.6 25.4 24.0 5.1 25.0
Public marina 0.1 3.2 6.3 12.6 2.5
Rented space in commercial marina 0.2 4.6 19.5 37.9 6.1
Owned space in marina/dockaminium 0.5 0.5 0.6 9.0 0.8
Yacht/boat club 0.3 1.1 4.7 18.4 1.9
Other 4.0 4.5 5.2 3.6 4.3
100.0 100.0 100.0 100.0 100.0
STORAGE LOCATION
On land 74.7 49.3 14.8 3.0 55.0
In a dry stack facility 0.5 2.1 1.5 0.3 1.1
In the water (wet slip, mooring or dockside) 18.7 44.8 78.9 95.7 38.8
Attached to or on a larger boat 1.3 0.2 0.0 0.2 0.7
Other 4.8 3.6 4.8 0.8 4.3
100.0 100.0 100.0 100.0 100.0
TYPE OF STORAGE LOCATION
A waterfront site w/ Great Lakes access 9.9 20.3 54.8 96.4 23.5
An inland lake waterfront site 32.4 37.5 31.5 1.4 32.5
A river or stream waterfront site 2.4 3.6 3.3 2 2.9
A non-waterfront site 55.3 38.5 10.4 0.3 41.1
Table 13. Size of Boat by Boat Type and Storage Size <16' 16 to 20' 21 to 28' >29' Total row percents BOAT TYPE Inboard 3.0 43.6 40.2 13.2 100 Inboard/outboard 7.8 64.1 25.7 2.3 100 Outboard 75.7 22.4 1.8 0.1 100 Sail, unpowered 36.4 43.6 16.3 3.6 100
Sail, with power 0.0 6.1 55.5 38.4 100
Pontoon 3.8 33.6 62.0 0.6 100 Canoe or rowboat 88.8 11.0 0.2 0.0 100 Personal watercraft 78.2 21.8 0.0 0.0 100 Other 77.8 13.6 6.0 2.6 100 STORAGE FACILITY Permanent residence 59.0 29.1 11.0 0.9 100
Cottage or second home 54.4 29.0 15.8 0.8 100
Public marina 2.7 36.8 41.4 19.0 100
Rented space in commercial marina 1.6 21.8 52.9 23.7 100
Owned space in marina/dockaminium 29.0 16.2 13.1 41.7 100
Yacht/boat club 6.6 17.0 40.3 36.1 100
Other 47.2 29.7 19.9 3.2 100
STORAGE LOCATION
On land 70.0 25.4 4.4 0.2 100
In a dry stack facility 24.4 52.5 22.0 1.1 100
In the water (wet slip, mooring or dockside) 24.9 32.7 33.3 9.1 100
Attached to or on a larger boat 89.6 9.4 0.0 1.0 100
Other 57.6 23.6 18.1 0.7 100
TYPE OF STORAGE LOCATION
A waterfront site w/ Great Lakes access 21.7 24.5 38.3 15.5 100
An inland lake waterfront site 51.2 32.7 15.9 0.2 100
A river or stream waterfront site 42.9 35.7 18.8 2.6 100
A non-waterfront site 69.2 26.6 4.1 0 100
Boat Segments
To help describe and explain patterns of boating use, we divide Michigan’s registered boating fleet into 11 segments based on location (Great Lakes waterfront, inland waterfront or non-waterfront), size class and use of a marina. There are five Great Lakes waterfront segments, three inland waterfront segments and three
non-waterfront segments.
GREAT LAKES WATERFRONT SEGMENTS
SEGMENT # Size Storage location
1 29 feet or longer Permanent or seasonal waterfront home
2 29 feet or longer Marina
3 21-28 feet Permanent or seasonal waterfront home
4 < 29 feet Marina
5 < 21 feet Permanent or seasonal waterfront home
INLAND WATERFRONT SEGMENTS
6 21 feet or longer Permanent or seasonal waterfront home
7 < 21 feet Permanent or seasonal waterfront home
8 Any size Inland marina
NON-WATERFRONT SEGMENTS
9 < 16 feet Non-waterfront site
10 16-20 feet Non-waterfront site
11 21 feet or longer Non-waterfront site
Table 14 presents both weighted and unweighted frequencies by segment from the sample. The unweighted figures show the actual number of boats of each type in our sample. Larger craft were intentionally oversampled to develop reliable estimates of demand for marina slips and pumpout facilities. This sampling
strategy resulted in more than 170 boats in each of our segments with the exception of boats larger than 21 feet at non-waterfront sites (n=101) and boats kept at inland marinas (n=70).
The weights adjust the sample to represent the active registered fleet. More than half of all registered boats fall into two segments -- 29 percent are smaller (<21 feet) boats kept at inland waterfront sites, and 28 percent are small boats (<16 feet) kept at non-waterfront sites. The largest Great Lakes segment is also smaller craft -- boats under 21 feet kept at Great Lakes waterfront homes represent 9 percent of the active pleasure fleet. In total, Great Lakes waterfront segments constitute about 23.7 percent of the fleet, inland waterfront segments 35.7 percent and boats stored at non-waterfront sites 40.7 percent . Though the larger craft are small percentages of the overall fleet, their impacts on Great Lakes marina and pumpout facilities are substantial, as is their economic impact. Table 15 profiles the characteristics of boat owners in each of the 11 segments.
Table 14. Boat segments.
Unweighted sample Weighted sample
SEGMENT N Percent N Percent
Great Lakes waterfront segments 1,499 51.7% 126,828 23.7%
29'+ GL waterfront home 171 5.9% 4,198 0.8%
29'+ GL marina 660 22.7% 15,548 2.9%
21 to 28' GL waterfront home 230 7.9% 25,842 4.8%
<28' GL marina 266 9.2% 34,903 6.5%
<21' GL waterfront home 172 5.9% 46,337 8.6%
Inland Lake waterfront segments 737 25.4% 191,320 35.7%
21'+ IL waterfront home 196 6.8% 26,684 5.0% <21' IL waterfront home 471 16.2% 155,482 29.0% IL marina 70 2.4% 9,154 1.7% Non-waterfront segments 666 22.9% 217,920 40.7% <16 non-waterfront site 289 10.0% 149,560 27.9% 16 to 20' non-waterfront site 276 9.5% 57,746 10.8% 21'+ non-waterfront site 101 3.5% 10,614 2.0%
Boats with missing data 78 19,118
Table 15. Boat owner characteristics by segment.a
Great Lakes waterfront Inland waterfront Non-waterfront
29’+ Home 29’+ Marina 21- 28' Home <28' Marina <21' Home 21'+ Home <21' Home Marina <16' Boats 16- 20' Boats >20' Boats Total ... percent ... AGE OF BOAT OWNER
younger than 40 20 16 20 22 18 13 11 18 28 33 28 21 41-50 22 28 25 25 17 18 16 21 19 20 25 19 51-60 25 27 18 17 24 16 16 28 16 16 18 17 61-65 17 13 13 13 12 17 13 9 8 9 7 11 66-70 8 5 11 11 15 10 18 6 13 10 8 14 Older than 70 8 12 12 11 14 26 27 18 16 13 14 19 100 100 100 100 100 100 100 100 100 100 100 100 NO. OF ADULTS IN THE HOUSEHOLD
1 20 16 19 22 18 19 21 16 16 12 25 18 2 67 69 65 68 73 69 68 71 72 71 59 70 3 8 11 11 8 8 10 7 0 9 9 12 8 4 5 4 5 2 1 2 3 12 3 8 3 3 5 or more 0 0 1 0 0 0 2 0 1 1 2 1 100 100 100 100 100 100 100 100 100 100 100 100 HOUSEHOLD WITH CHILDREN
no children 60 56 61 52 48 67 63 64 40 43 40 53 1 child 12 19 17 26 18 11 19 20 26 21 21 20 2 children 17 14 16 15 16 16 9 10 23 19 21 15 3 children 9 7 4 5 15 4 6 3 7 14 16 8 more than 4 2 5 2 3 3 3 3 3 4 4 2 4 100 100 100 100 100 100 100 100 100 100 100 100 HOUSEHOLD INCOME Under $20,000 4 3 11 9 24 20 23 12 27 19 25 22 $20,000-$39,999 21 18 26 31 30 33 32 27 40 37 30 34 $40,000-$59,999 38 25 27 29 20 20 23 21 20 29 19 23 $60,000-$99,999 23 33 24 18 18 13 17 24 13 14 22 16 Over $100,000 13 21 11 13 9 13 5 16 1 2 4 6 100 100 100 100 100 100 100 100 100 100 100 100 OWN SEASONAL HOME IN MICHIGAN
Yes 24 15 33 21 45 48 55 22 13 13 20 31
No 76 85 67 79 55 52 45 78 87 87 80 69
100 100 100 100 100 100 100 100 100 100 100 100 a. Unit of analysis in this table is the boat owner. The sample of boats was weighted inversely to number of
BOATING ACTIVITY
The two most frequent uses of boats are fishing from boats (56 percent) and pleasure cruising (39 percent). Smaller craft kept at non-waterfront sites are used mainly for fishing while owners of larger craft report more pleasure boating than fishing. Boats at inland waterfront sites are more likely to be used for fishing and water-skiing than boats kept at Great Lakes waterfront sites (Table 16)
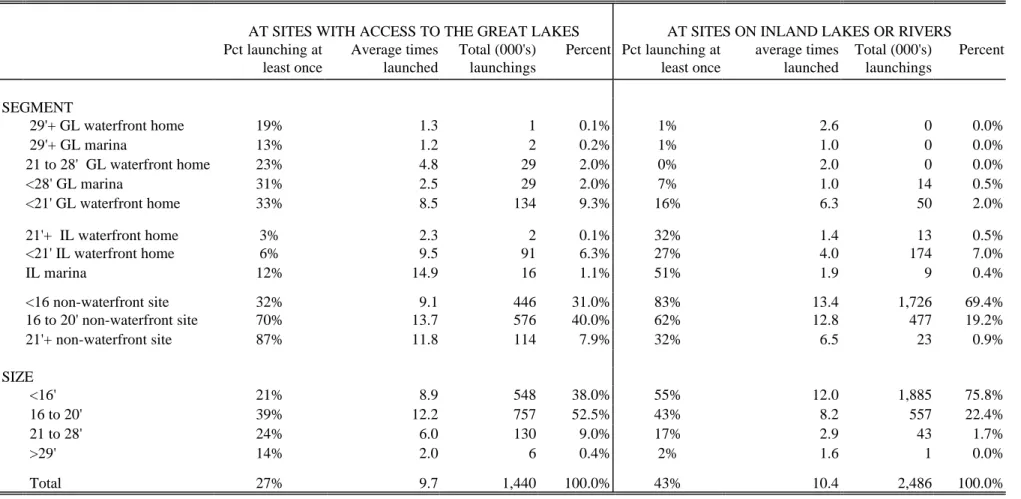
We estimate that almost 2.5 million launchings of boats occurred on inland waters and 1.4 million launchings took place on Great Lakes waters in 1994. Boats kept at non-waterfront sites account for 80 percent of the launchings at Great Lakes sites and 90 percent of the launchings at inland sites. Sixteen-to- twenty foot boats kept at non-waterfront sites account for the highest numbers of Great Lakes launchings, while smaller craft (under 16 feet) kept at non-waterfront sites report the most launchings at inland lakes and streams (Table 17).
Table 16. Types of boating use by segment and size class.
Pleasure boating Fishing from boat Waterskiing Other
SEGMENT 29'+ GL waterfront home 87% 12% 0% 1% 29'+ GL marina 91% 7% 0% 2% 21 to 28' GL waterfront home 76% 21% 1% 1% <28' GL marina 70% 27% 1% 2% <21' GL waterfront home 46% 47% 4% 3% 21'+ IL waterfront home 67% 30% 2% 1% <21' IL waterfront home 44% 48% 6% 1% IL marina 67% 24% 6% 3% <16 non-waterfront site 10% 88% 0% 1% 16 to 20' non-waterfront site 34% 60% 5% 1% 21'+ non-waterfront site 34% 56% 3% 7% SIZE <16' 19% 77% 1% 2% 16 to 20' 51% 40% 8% 1% 21 to 28' 69% 27% 2% 2% >29' 90% 8% 0% 2% All boats 39% 56% 3% 2%
Table 17. Transporting and Launching by Segment and Size Class.
AT SITES WITH ACCESS TO THE GREAT LAKES AT SITES ON INLAND LAKES OR RIVERS
Pct launching at least once Average times launched Total (000's) launchings Percent Pct launching at least once average times launched Total (000's) launchings Percent SEGMENT 29'+ GL waterfront home 19% 1.3 1 0.1% 1% 2.6 0 0.0% 29'+ GL marina 13% 1.2 2 0.2% 1% 1.0 0 0.0% 21 to 28' GL waterfront home 23% 4.8 29 2.0% 0% 2.0 0 0.0% <28' GL marina 31% 2.5 29 2.0% 7% 1.0 14 0.5% <21' GL waterfront home 33% 8.5 134 9.3% 16% 6.3 50 2.0% 21'+ IL waterfront home 3% 2.3 2 0.1% 32% 1.4 13 0.5% <21' IL waterfront home 6% 9.5 91 6.3% 27% 4.0 174 7.0% IL marina 12% 14.9 16 1.1% 51% 1.9 9 0.4% <16 non-waterfront site 32% 9.1 446 31.0% 83% 13.4 1,726 69.4% 16 to 20' non-waterfront site 70% 13.7 576 40.0% 62% 12.8 477 19.2% 21'+ non-waterfront site 87% 11.8 114 7.9% 32% 6.5 23 0.9% SIZE <16' 21% 8.9 548 38.0% 55% 12.0 1,885 75.8% 16 to 20' 39% 12.2 757 52.5% 43% 8.2 557 22.4% 21 to 28' 24% 6.0 130 9.0% 17% 2.9 43 1.7% >29' 14% 2.0 6 0.4% 2% 1.6 1 0.0% Total 27% 9.7 1,440 100.0% 43% 10.4 2,486 100.0%
To assess demand for temporary storage at marinas, boaters were asked how many nights they occupied a marina space on a temporary basis in 1994. All size craft and segments reported some temporary use of marina slips, though larger craft were more likely to use temporary slips than smaller craft. In total, 41,000 boats or about 7 percent of active craft used marina slips on a temporary basis, accumulating a total of 315,000 nights in marinas in 1994 (Table 18). This estimate is about three times the number of transient boat nights reported by Michigan’s public marinas in 1993, suggesting that private facilities, including yacht clubs, provide about two-thirds of the transient boat nights.
Table 18. Temporary use of marina spaces by segment and size class.
TEMPORARILY KEPT THE BOAT OVERNIGHT AT A MICHIGAN MARINA Percent of # Boats using Avg. nights
all boats temp. space useda Total nights Percent
SEGMENT 29'+ GL waterfront home 43% 1,908 10 19,541 6.2% 29'+ GL marina 55% 8,796 10 92,175 29.3% 21 to 28' GL waterfront home 24% 6,410 6 35,345 11.2% <28' GL marina 19% 6,929 8 56,746 18.0% <21' GL waterfront home 4% 1,767 8 14,244 4.5% 21'+ IL waterfront home 3% 767 2 1,545 0.5% <21' IL waterfront home 1% 995 7 7,163 2.3% IL marina 10% 971 14 14,035 4.5% <16 non-waterfront site 3% 4,302 9 37,927 12.1% 16 to 20' non-waterfront site 10% 5,701 3 19,445 6.2% 21'+ non-waterfront site 24% 2,674 6 16,462 5.2% SIZE <16' 2% 4,837 8 39,947 12.7% 16 to 20' 6% 9,802 6 63,515 20.2% 21 to 28' 18% 15,957 6 102,494 32.6% >29' 51% 10,516 10 108,673 34.5% Total 7% 41,084 8 314,629 100.0%
Boating use in 1994
Boating use is measured as the number of days a boat was underway in 1994. Boating use questions were modified slightly from previous surveys to reduce potential double counting. For example, boaters who boated in more than one county or on both Great Lakes and inland waters on the same day could have been counted for more than one day of boating in the 1986, 1980 and previous Michigan boater surveys. In 1994, boaters were asked to first report total days of boating and then to divide use between Great Lakes and inland waters, counting any day in which all or part of the day was spent on the Great Lakes and connecting waters as a Great Lakes boat day. These procedures yield more conservative and, we believe, more accurate estimates of actual boating use. Readers are cautioned, however, that the modification in the questions yields results that are not directly comparable with those of previous studies. These changes may in part explain lower estimates of inland boat use in 1994. In the “Trends” section we suggest some adjustments to estimates of previous studies to facilitate comparisons.
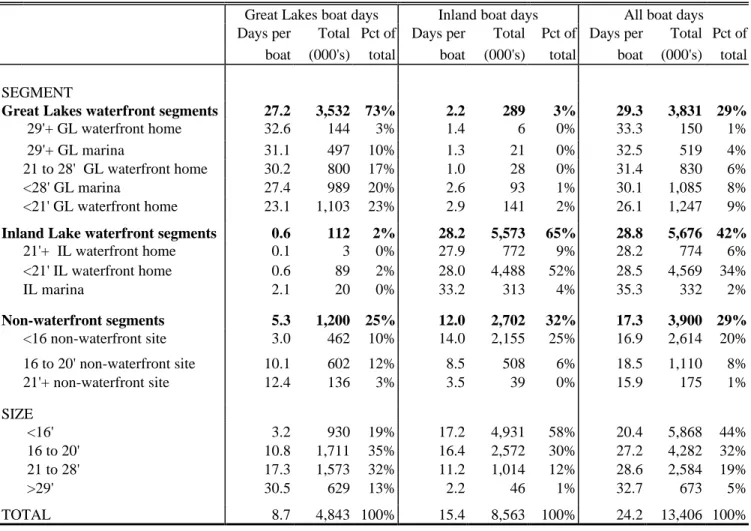
Craft registered in Michigan logged an estimated 13.4 million days of boating in 1994, 4.8 million on Great Lakes waters and 8.6 million on inland waters (Table 19). Boat use increases with size of the boat from 20 days a year for boats under 16 feet to 33 days for boats over 29 feet. Boats kept at Great Lakes or inland waterfront sites average about 29 days of use per year, with the preponderance of use on the bodies of water where the boats are kept. Boats kept at non-waterfront sites averaged about 17 days of use in 1994. These boats used both Great Lakes and inland waters, with the percentage of use on the Great Lakes increasing with the size of the boat (Table 19).
The majority of boats use either Great lakes (28 percent) or inland waters (58 percent) exclusively. Only 14 percent of boats use both Great Lakes and inland waters. Great Lakes boaters averaged about 26 days of use in 1994, compared with 23 days for inland boaters. Boaters using both Great Lakes and inland waters averaged 25 days of boating in 1994, split about two fifths to Great Lakes and three-fifths to inland waters (Table 20).
Table 19. Frequency of boat use by segment and size class.
Great Lakes boat days Inland boat days All boat days
Days per Total Pct of Days per Total Pct of Days per Total Pct of
boat (000's) total boat (000's) total boat (000's) total
SEGMENT
Great Lakes waterfront segments 27.2 3,532 73% 2.2 289 3% 29.3 3,831 29% 29'+ GL waterfront home 32.6 144 3% 1.4 6 0% 33.3 150 1% 29'+ GL marina 31.1 497 10% 1.3 21 0% 32.5 519 4% 21 to 28' GL waterfront home 30.2 800 17% 1.0 28 0% 31.4 830 6%
<28' GL marina 27.4 989 20% 2.6 93 1% 30.1 1,085 8%
<21' GL waterfront home 23.1 1,103 23% 2.9 141 2% 26.1 1,247 9%
Inland Lake waterfront segments 0.6 112 2% 28.2 5,573 65% 28.8 5,676 42% 21'+ IL waterfront home 0.1 3 0% 27.9 772 9% 28.2 774 6% <21' IL waterfront home 0.6 89 2% 28.0 4,488 52% 28.5 4,569 34% IL marina 2.1 20 0% 33.2 313 4% 35.3 332 2% Non-waterfront segments 5.3 1,200 25% 12.0 2,702 32% 17.3 3,900 29% <16 non-waterfront site 3.0 462 10% 14.0 2,155 25% 16.9 2,614 20% 16 to 20' non-waterfront site 10.1 602 12% 8.5 508 6% 18.5 1,110 8% 21'+ non-waterfront site 12.4 136 3% 3.5 39 0% 15.9 175 1% SIZE <16' 3.2 930 19% 17.2 4,931 58% 20.4 5,868 44% 16 to 20' 10.8 1,711 35% 16.4 2,572 30% 27.2 4,282 32% 21 to 28' 17.3 1,573 32% 11.2 1,014 12% 28.6 2,584 19% >29' 30.5 629 13% 2.2 46 1% 32.7 673 5% TOTAL 8.7 4,843 100% 15.4 8,563 100% 24.2 13,406 100%
Table 20. Boat use by Great Lakes vs inland locations.
Boating use
GL only IL only Both GL and IL Total
No. of boats 157,648 319,663 77,877 555,188
Percent 28% 58% 14% 100%
AVERAGE DAYS OF USE
Great Lakes use 26 0 10 9
Inland use 0 23 15 15
Total 26 23 25 24
TOTAL BOAT DAYS (000's)
Great Lakes use 4,049 - 794 4,843 Inland use - 7,428 1,135 8,563 Total 4,049 7,428 1,929 13,406 PERCENT OF TOTAL
Great Lakes use 30% 0% 6% 36%
Inland use 0% 55% 8% 64%
BOATER SPENDING
Michigan boaters reported spending $418 million to operate and maintain their boats in 1994. This figure does not include purchases of new boats or, with the exception of spending on fuel for the boat, spending on boating trips. Expenses for equipment (24 percent) and repairs/maintenance (24 percent) are the largest shares of the $418 million, followed by slip rental (15 percent). Boat insurance, fuel and storage/put-in/haul-out fees (combined) each accounted for about $50 million in spending by boaters in 1994 (Table 21).
Boats stored at Great Lakes marinas have the largest economic impacts, accounting for about 40 percent of the $418 million (Table 22). Boat owner spending increases with boat size from an average of $205 a year to operate boats under 16 feet in length to $4,500 to operate and maintain a boat over 29 feet. The average boat owner spends $753 a year in operating expenses. Spending is broken down by the 11 segments in Table 22. Owners of boats over 29 feet kept at Great Lake marinas spend almost $5,000 a year, including $1,400 in slip fees and $543 in boat fuel. At the other extreme are owners of craft under 16 feet kept at non-waterfront homes. These boaters spend about $200 a year. Boaters on inland lakes spend considerably less than Great Lakes boaters in
corresponding length and storage categories.
Table 21. Boat operating expenses by size of boat.
SIZE OF BOAT
<16' 16 to 20' 21 to 28' >29' All boats Percent AVERAGE SPENDING ($ per boat)
Boating equipment $93 $251 $221 $631 $182 24%
Repair and maintenance $39 $231 $353 $924 $183 24%
Seasonal slip rental or dry stack $9 $58 $288 $1,129 $115 15%
Put-in and haul-out fees $7 $27 $50 $146 $26 3%
Off-Season Storage $5 $63 $132 $642 $68 9%
Fuel $34 $119 $179 $510 $101 13%
Boat insurance $18 $97 $140 $463 $79 11%
Total $205 $845 $1,362 $4,445 $753 100%
FLEET TOTAL SPENDING ($MM, 1994)
Boating equipment $27.1 $40.2 $20.4 $13.2 $100.9 24%
Repair and maintenance $11.4 $37.5 $33.0 $19.6 $101.5 24%
Seasonal slip rental or dry stack $2.8 $9.5 $27.3 $24.3 $63.9 15%
Put-in and haul-out fees $2.1 $4.3 $4.6 $3.1 $14.2 3%
Off-Season Storage $1.4 $10.3 $12.4 $13.8 $37.9 9%
Fuel $9.9 $18.9 $16.4 $10.6 $55.8 13%
Boat insurance $5.3 $15.8 $13.1 $9.9 $44.0 11%
Total $60.5 $136.8 $127.0 $94.1 $418.3 100%
BOATING-RELATED EXPENSES
Repair and Seasonal Put-in & Off-season Boat
Equipment maintenance slip rental Haul-Out fees storage Fuel insurance Total Percent
AVERAGE SPENDING ($ per boat)
29'+ GL waterfront home $340 $872 $327 $125 $537 $445 $401 $2,837 29'+ GL marina $730 $932 $1,387 $153 $701 $543 $491 $4,967 21 to 28' GL waterfront home $179 $442 $160 $61 $150 $257 $157 $1,407 <28' GL marina $309 $346 $704 $54 $235 $209 $178 $2,037 <21' GL waterfront home $328 $158 $62 $14 $42 $98 $71 $773 21'+ IL waterfront home $80 $175 $8 $23 $29 $78 $75 $469 <21' IL waterfront home $110 $104 $5 $9 $28 $61 $52 $378 IL marina $340 $477 $317 $36 $110 $112 $167 $1,631 <16 non-waterfront site $98 $43 $0 $6 $1 $33 $13 $201 16 to 20' non-waterfront site $223 $203 $2 $36 $21 $103 $59 $599 21'+ non-waterfront site $177 $375 $26 $32 $44 $195 $99 $970 Total $182 $183 $115 $26 $68 $101 $79 $753
FLEET TOTAL SPENDING ($MM, 1994)
29'+ GL waterfront home $1.5 $3.9 $1.5 $0.6 $2.5 $2.0 $1.9 $13.9 3% 29'+ GL marina $12.0 $15.3 $23.5 $2.7 $11.7 $8.7 $8.2 $81.7 20% 21 to 28' GL waterfront home $4.9 $12.0 $4.5 $1.8 $4.2 $6.8 $4.4 $38.5 9% <28' GL marina $11.4 $12.7 $26.6 $2.1 $8.8 $7.5 $6.6 $75.2 18% <21' GL waterfront home $16.0 $7.7 $3.1 $0.7 $2.1 $4.6 $3.5 $37.8 9% 21'+ IL waterfront home $2.3 $4.9 $0.2 $0.7 $0.8 $2.2 $2.2 $13.4 3% <21' IL waterfront home $18.1 $17.1 $0.9 $1.5 $4.7 $9.7 $8.8 $61.0 15% IL marina $3.3 $4.6 $3.1 $0.4 $1.1 $1.1 $1.6 $15.1 4% <16 non-waterfront site $15.6 $6.8 $0.1 $1.0 $0.2 $5.1 $2.1 $30.9 7% 16 to 20' non-waterfront site $13.7 $12.4 $0.1 $2.4 $1.3 $6.2 $3.7 $39.9 10% 21'+ non-waterfront site $2.0 $4.2 $0.3 $0.4 $0.5 $2.2 $1.1 $10.8 3% Total $100.9 $101.5 $63.9 $14.2 $37.9 $55.8 $44.0 $418.3 100% percent 24% 24% 15% 3% 9% 13% 11% 100%
The estimates of spending on fuel by boat owners provide the basis for a fairly accurate estimate of boat fuel consumption in 1994. Assuming an average cost of marine fuel of $1.50 a gallon, we estimate that Michigan registered boaters consumed 37 million gallons of fuel in 1994, about 67 gallons per active boat (Table 23). This estimate is consistent with a national study of boat fuel consumption conducted by Price Waterhouse in 1991 (U.S. Fish and Wildlife Service 1992).
Using diary methods and a sample of 3,122 Michigan registered boaters, Price Waterhouse estimated that 48.8 million gallons of fuel were purchased by boaters in Michigan in 1990. This estimate must be reduced first by 13 percent for the portion of boat fuel purchased by other than registered boat owners and then by another 14 percent for differences in assumptions about the number of active craft (we estimate 555,000 active craft in 1994, while Price Waterhouse estimates fuel use for 643,300 registered boats in 1991). After these adjustments, the corresponding Price Waterhouse estimate is just under 37 million gallons. Our estimates of fuel use per boat in total and by size class are quite consistent with Price Waterhouse’s 1991 national averages.
Table 23. 1994 Michigan boat fuel use by size class.
Boat size class (feet)
<16' 16 to 20' 21 to 28' 29+ Total
Active craft summer 1994 286,878 156,891 90,711 20,708 555,188
Average fuel spending 1994 ($ per boat) 34.1 119.3 179.3 510.5 100.5
Total fuel spending ($millions) 9.8 18.7 16.3 10.6 55.3
Total gallons (million)a 6.5 12.5 10.8 7.0 36.9
a. Total gallons estimated by dividing fuel spending in dollars by an average price of $1.50
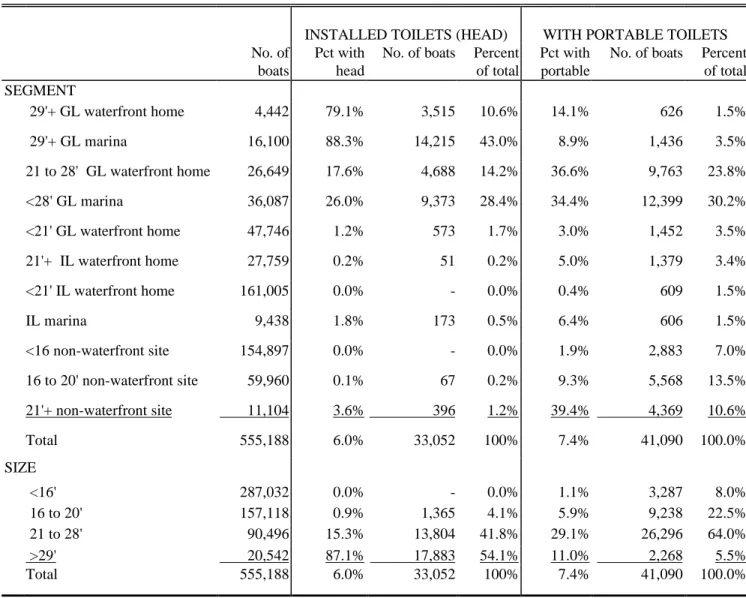
TOILET FACILITIES
There were 74,000 active registered craft with on-board toilet facilities in 1994, representing 13 percent of all active registered boats. Fifty-six percent of the boats with toilets had portable toilets and 45 percent had
installed toilets. Virtually all boats over 29 feet have toilet facilities. The percentage of craft with portable or fixed toilets drops to 44 percent for boats 21 to 28 feet and to 7 percent for boats 16 to 20 feet. Smaller boats tend to use portable toilets. Of boats with toilet facilities the percentage with installed toilets rather than portables increases from 13 percent for 16 to 20 foot craft to 35 percent for 21 to 28 foot boats to 90 percent for boats over 29 feet (Table 24).
Boaters with toilet facilities were asked about their frequency of use of their on-board toilets and use of pumpout facilities and dump stations in Michigan. Almost half of boaters with installed toilets report using them
on most trips, compared with a quarter of boaters with portable toilets. Use of pumpout facilities for installed toilets increases from 2.2 times a year for 16 to 20 foot craft to 5.6 times for the largest boat size class. When asked about problems in finding or using pumpouts, almost half of boaters with installed toilet facilities reported that they “never encountered problems in finding or using pumpout facilities”, 29 reported reported “hardly ever” and 20 percent reported “sometimes”. Owners of larger craft were somewhat more likely to report problems. Portable toilets were used less frequently than installed toilets. Over half of boats with portable toilets reported they never or rarely use them. Portable toilets were generally emptied at a private home or cottage for smaller boats or at a dump station or public restroom for the larger boats (Tables 24 and 25).
Table 24. Number of boats with toilet facilities by segment and size class.
INSTALLED TOILETS (HEAD) WITH PORTABLE TOILETS
No. of boats
Pct with head
No. of boats Percent of total
Pct with portable
No. of boats Percent of total SEGMENT 29'+ GL waterfront home 4,442 79.1% 3,515 10.6% 14.1% 626 1.5% 29'+ GL marina 16,100 88.3% 14,215 43.0% 8.9% 1,436 3.5% 21 to 28' GL waterfront home 26,649 17.6% 4,688 14.2% 36.6% 9,763 23.8% <28' GL marina 36,087 26.0% 9,373 28.4% 34.4% 12,399 30.2% <21' GL waterfront home 47,746 1.2% 573 1.7% 3.0% 1,452 3.5% 21'+ IL waterfront home 27,759 0.2% 51 0.2% 5.0% 1,379 3.4% <21' IL waterfront home 161,005 0.0% - 0.0% 0.4% 609 1.5% IL marina 9,438 1.8% 173 0.5% 6.4% 606 1.5% <16 non-waterfront site 154,897 0.0% - 0.0% 1.9% 2,883 7.0% 16 to 20' non-waterfront site 59,960 0.1% 67 0.2% 9.3% 5,568 13.5% 21'+ non-waterfront site 11,104 3.6% 396 1.2% 39.4% 4,369 10.6% Total 555,188 6.0% 33,052 100% 7.4% 41,090 100.0% SIZE <16' 287,032 0.0% - 0.0% 1.1% 3,287 8.0% 16 to 20' 157,118 0.9% 1,365 4.1% 5.9% 9,238 22.5% 21 to 28' 90,496 15.3% 13,804 41.8% 29.1% 26,296 64.0% >29' 20,542 87.1% 17,883 54.1% 11.0% 2,268 5.5% Total 555,188 6.0% 33,052 100% 7.4% 41,090 100.0%
Table 25. Toilet use by boat size class.
BOAT SIZE CLASSa
16 to 20' 21 to 28' >29' Total
... percents ... BOATS WITH INSTALLED TOILETS (HEAD)
FREQUENCY OF USING HEAD
Most trips 37.4 27.7 62.9 47.2
Some trips - 21.1 18.9 19.0
Rarely 37.4 30.5 14.7 22.2
Not used 25.2 20.7 3.4 11.5
PROBLEM IN FINDING OR USING PUMPOUT FACILITIES
Most of the time - 4.1 1.1 2.3
Sometimes 47.2 17.7 19.2 19.5
Hardly ever - 27.8 31.3 28.8
Never 52.8 50.4 48.3 49.3
BOATS WITH PORTABLE TOILETS
FREQUENCY OF USING PORTABLE TOILET
Most trips 20.0 17.5 54.6 24.7
Some trips 13.9 25.5 19.8 20.8
Rarely 54.5 46.7 22.1 45.0
Not used 11.6 10.3 3.6 9.5
PLACES FOR DISCHARGING PORTABLE TOILET
At a dump station 14.0 22.7 31.0 20.5 In a public restroom 4.1 8.1 21.8 8.7 At a home or cottage 80.2 66.2 36.4 66.4 In the water 0.9 - - 0.2
Other 0.7 1.0 1.2 2.3
More than two places - 2.1 9.6 1.9 PROBLEM IN FINDING OR USING DUMP STATIONS
Most of the time 8.8 3.4 6.6 4.3
Sometimes 6.0 5.6 23.8 6.3
Hardly ever 15.8 23.6 24.1 20.2
SUMMARY OF BOAT USE AND CHARACTERISTICS BY SEGMENT
We have consistently reported most of the key variables from the 1994 boater survey broken down by both size class and the 11 size and storage segments. In Tables 26-29, we provide comparable data for three simple segmentations of boats: size class, storage type and use of Great Lakes or inland waters. We have already
discussed the patterns of ownership and use by size class. Bringing the variables together in a single table helps to show the importance of boat size in explaining patterns of boating use and needs for facilities and services. The number of boat days, proportion of pleasure cruising, use of temporary marina slips, spending, use of pumpout facilities and boat owner incomes all increase with the size of the boat (Table 26).
In Table 27, boats stored at permanent homes are compared with those stored at seasonal homes or marinas. Days of use, percent pleasure boating and spending increase across these three storage categories. Fishing is the most prominent use of boats kept at permanent residences. Boats kept at seasonal homes are used about equally for fishing and pleasure cruising, while boats at marinas devote only a quarter of their use to fishing. Another useful way of segmenting boats is by use of Great Lakes vs. inland waters (Table 28). The majority of boats are used either on the Great Lakes (28 percent of all boats) or on inland waters (58 percent). Boats that use both (14 percent) divide their use 10 days to Great Lakes and 15 days to inland lakes and streams. These boats are mostly stored at non-waterfront homes and account for the vast majority of launchings at both Great Lakes and inland sites. Fishing is a popular activity for these more mobile boats. Though generally somewhat smaller craft than those used solely on the Great Lakes, boats used on both waters account for a substantial number of temporary overnights at Great Lakes marinas.
Table 26. Summary by boat size class.
BOAT SIZE CLASS
<16' 16 to -20' 21 to 28' >29' All boats AVERAGE BOATING DAYS OF USE
Total boating days 20.4 27.3 28.6 32.7 24.2
Great Lakes boating days 3.2 10.8 17.3 30.5 8.7
Inland boating days 17.2 16.4 11.2 2.2 15.4
TYPES OF BOATING
Pleasure boating 19% 51% 69% 90% 39%
Fishing 77% 40% 27% 8% 56%
Waterskiing 1% 8% 2% 0% 3%
Other 2% 1% 2% 2% 2%
TIMES TRANSPORTED & LAUNCHED AT
Great Lakes sites 1.9 4.8 1.4 0.3 2.6
Inland sites 6.6 3.6 0.5 0.0 4.5
TEMPORARY USE OF MARINA SPACE (pct.) 2% 6% 18% 51% 7%
ANNUAL OPERATING EXPENSES
Boating equipment $93 $251 $221 $631 $182
Repair and maintenance $39 $231 $353 $924 $183
Seasonal slip rental or dry stack $9 $58 $288 $1,129 $115
Put-in and haul-out fees $7 $27 $50 $146 $26
Off-season storage $5 $63 $132 $642 $68
Fuel $34 $119 $179 $510 $101
Boat insurance $18 $97 $140 $463 $79
Total $192 $833 $1,367 $4,436 $753
BOATS WITH TOILETS
Installed toilet (head) 0% 1% 15% 87% 6%
Portable toilet 1% 6% 29% 11% 7%
AGE OF BOAT OWNER (years) 57 54 54 53 55 HOUSEHOLD INCOME DISTRIBUTION
Under $20,000 23% 15% 10% 3% 18%
$20,000-$39,999 32% 27% 26% 16% 29%
$40,000-$59,999 18% 21% 23% 24% 20%
$60,000-$99,999 13% 16% 18% 29% 16%
Over $100,000 2% 9% 14% 19% 7%