Cardiovascular risk assessment
Blom DJ, MBChB (UCT), FCP (SA), MMed (UCT), PhD (UCT) Division of Lipidology, Department of Medicine, University of Cape Town, South Africa
Correspondence to: Dr Dirk Blom, e-mail: [email protected]
Keywords: cardiovascular risk; Framingham; CRP; carotid intima media thickness; coronary artery calcium score
Abstract
Cardiovascular disease remains the leading cause of mortality in the Westernised world. Lifestyle changes and drug therapy can reduce cardiovascular risk. Many interventions such as lipid-lowering therapy reduce relative risk to the same extent irrespective of baseline risk, but the absolute benefit is still highest in those with the highest absolute risk. Cardiovascular risk assessment is a tool to determine absolute cardiovascular risk in asymptomatic patients and to select those most likely to benefit from intervention. Conventional risk assessment (Framingham) requires age, gender, blood pressure, smoking status, total cholesterol and high-density lipoprotein cholesterol (HDLC) to determine risk. This is usually expressed as the 10-year risk of coronary heart disease. The accuracy and predictive ability of conventional risk assessment have limitations. Many biomarkers, genetic tests and vascular imaging procedures correlate statistically with vascular risk. Adding these tests to conventional risk assessment (expanded risk assessment) may therefore improve our ability to predict risk. It has, however, been difficult to conclusively demonstrate that expanded risk assessment outperforms conventional risk assessment. Many tests and procedures require further validation before they become part of routine clinical practice. Additional testing may be useful in patients with intermediate risk or where risk is difficult to determine for other reasons.
Peer reviewed. (Submitted: 2010-09-02, Accepted: 2010-10-31). © Medpharm S Afr Fam Pract 2011;53(2):121-128
Prediction is very difficult, especially if it’s about the future
(Niels Bohr, Danish physicist)
Introduction
Cardiovascular disease remains the most common cause of death in the Westernised world, accounting for 43.8% of male deaths and 57% of female deaths in the World Health Organization (WHO) European region in 2004.1 The risk of
cardiovascular death can be reduced by both lifestyle (e.g. smoking cessation, dietary changes and exercise) and pharmacological interventions (e.g. lipid-modifying drugs and treatment of hypertension). For patients to benefit optimally, these interventions should ideally be started long before cardiovascular disease is clinically overt. Primary prevention of cardiovascular disease thus often involves asking people with no symptoms of cardiovascular disease to change their lifestyle and to take medication for the rest of their lives. Such interventions are clearly associated with costs. Medication, laboratory monitoring and doctor’s visits cost money, while there are also potential psychological costs associated with the transition from a state of perceived health to being a ‘patient’ taking daily medication. (See Spence2 for an interesting critique of current medical
practice.)
Cardiovascular risk assessment is a tool used to select patients for ‘intervention’. For many interventions, the relative risk reduction achieved is independent of baseline risk, but interventions are primarily targeted at those with the highest absolute risk, as these patients stand to gain the most in absolute risk reduction. The intensity and number of interventions recommended rise with the risk.
Clearly, cardiovascular risk assessment does involve ‘trying to predict the future’, and it is thus not surprising that it is neither very exact nor free of problems. This article deals with risk assessment in the primary prevention setting. Patients with established cardiovascular disease and type 2 diabetes mellitus should not be risk-scored for primary prevention. There are tools to assess future risk in those with established cardiovascular disease and type 2 diabetes mellitus; however, these are not discussed here.
Cardiovascular risk
Cardiovascular risk is determined by the interaction of many different risk factors. Some factors increase risk, while others are protective. In the individual, cardiovascular risk is determined by the balance of these opposing forces. Risk may be high because of a single dominant force (a markedly elevated risk factor such as very high low-density lipoprotein cholesterol [LDLC] in familial hypercholesterolaemia), or
multiple individually moderately deleterious risk factors (e.g. moderately high LDLC, low high-density lipoprotein cholesterol [HDLC] and mild hypertension) may combine to elevate risk significantly.
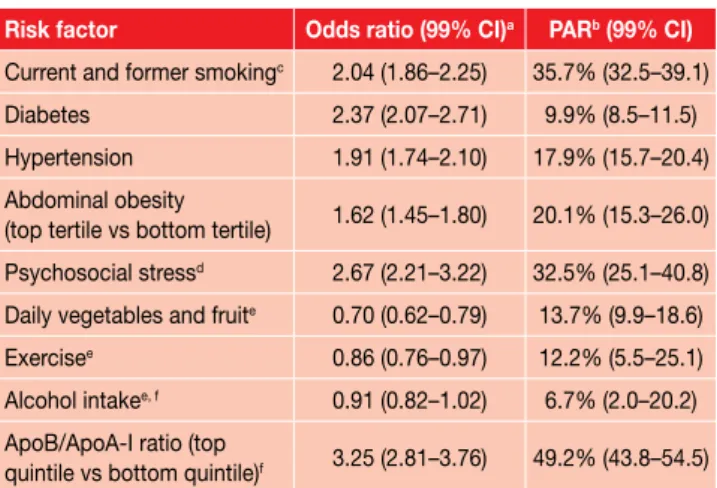
The INTERHEART study was a case-control study of risk factors for myocardial infarction in 52 countries.3 It showed
that, although the relative prevalence of risk factors differed geographically, for example, smoking rates were lower in more developed countries, the effect of the studied risk factors was consistent across geographic regions, ethnic groups and gender. More than 90% of observed risk was explained by nine modifiable risk factors (Table I).3 Conventional risk assessment does not utilise all the
INTERHEART risk factors and data collection is generally limited to lipid and demographic variables, blood pressure and smoking status. Conventional risk assessment does include age and gender – these variables were adjusted for in the INTERHEART study, but they were not further analysed, as they are non-modifiable risk factors. In conventional risk assessment, age and gender are, however, crucial variables. Age in particular is a very strong determinant of absolute cardiovascular risk and is the dominant risk force in older people.
Conventional risk assessment
The Framingham algorithm4 is probably the best-known
risk-assessment tool, but alternative risk scores are available. Some of the better known risk scores include the European SCORE project,5 which was derived from a large
database of prospective European studies; the PROCAM Score6 from Germany; and the QRisk Score,7,8 derived
from a general practitioner database in Britain. Apart from QRisk, all scores were derived in a similar fashion. Multiple clinical variables are documented in a population of individuals free of clinical cardiovascular disease. These individuals are then prospectively followed up over many years and all cardiovascular events are documented. The data set is then analysed to identify clinical variables (risk factors) associated with cardiovascular outcomes. With this information, a statistical model is developed that attempts to predict the measured outcome based on clinical variables documented at study entry. The final product is a complex mathematical risk model and equation. Risk equations are cumbersome and difficult to work with and thus are not routinely used in clinical practice. Instead, clinicians generally use tables derived from the risk equation, but many online risk calculators are now available that utilise risk equations (See www.chd-taskforce.com). The current Framingham tables for South Africa can be found at the end of the article.
Although the principles underlying all risk models are the same, there are some important, clinically relevant differences between them. Age, gender and smoking status are common input variables, but the Framingham Score, for instance, uses total cholesterol and HDLC values as lipid values, while PROCAM uses HDLC, LDLC and triglycerides and SCORE only uses total cholesterol. QRisk includes social deprivation as a risk factor. Because treatment decisions are often based on the final derived risk, it is important to know what risk is being calculated and what the risk threshold in local guidelines refers to. The best-known version of the Framingham Score estimates the 10-year risk of hard coronary endpoints (myocardial infarction, coronary death), while SCORE calculates 10-year cardiovascular mortality. It is thus not surprising that European guidelines based on the SCORE risk recommend intervention when risk is more than 5%, while guidelines based on Framingham have a threshold of 20%.
Box 1 illustrates how risk assessment may be used in practice.
Absolute and relative risk
Most risk-assessment tools report the absolute 10-year risk. A low short-term absolute risk may sometimes mask high long-term risk. The 10-year risk for a young patient with multiple risk factors may for instance be 3%, which does not appear particularly high. However, the risk for age-matched peers without additional risk factors is likely to be less than 1%. These patients would be falsely reassured if told there is no cause for concern. The risk of myocardial infarction will remain low for the next few years, but could be substantial by middle age. These patients should thus be informed of the increased long-term risk and risk reduction should be started. This need not necessarily be drug therapy, but could initially be lifestyle advice.
Table I: Risk factors for myocardial infarction identified in the INTERHEART study
Risk factor Odds ratio (99% CI)a PARb (99% CI)
Current and former smokingc 2.04 (1.86–2.25) 35.7% (32.5–39.1)
Diabetes 2.37 (2.07–2.71) 9.9% (8.5–11.5) Hypertension 1.91 (1.74–2.10) 17.9% (15.7–20.4) Abdominal obesity
(top tertile vs bottom tertile) 1.62 (1.45–1.80) 20.1% (15.3–26.0) Psychosocial stressd 2.67 (2.21–3.22) 32.5% (25.1–40.8)
Daily vegetables and fruite 0.70 (0.62–0.79) 13.7% (9.9–18.6)
Exercisee 0.86 (0.76–0.97) 12.2% (5.5–25.1)
Alcohol intakee, f 0.91 (0.82–1.02) 6.7% (2.0–20.2)
ApoB/ApoA-I ratio (top
quintile vs bottom quintile)f 3.25 (2.81–3.76) 49.2% (43.8–54.5)
a. The odds ratio is fully adjusted for all additional risk factors
b. PAR: Population attributable risk. This is calculated as the risk attributable to a risk factor (e.g. risk of lung cancer in smokers minus the risk in non-smokers) multiplied by the prevalence of exposure of the population to the risk factor (e.g. percentage of population that smokes). The PAR therefore measures the potential impact on a population if one were to eliminate the risk factor completely (e.g. reduction in lung cancer if everybody stops smoking). The PAR presented here is fully adjusted for all other risk factors. c. The risk is compared to that in never-smokers.
d. Defined as an index of positive exposure to depression, perceived stress at home and work, low locus of control and major life events and referenced to non-exposure to all five risk factors.
e. These factors are protective, as reflected in the odds ratio less than one. The PAR is that in the group without the protective exposure.
f. Alcohol intake was defined as the regular consumption of alcoholic beverages more than three times a week.
The SCORE algorithm uses relative risk to identify young patients with high long-term risk. Relative risk is the patient’s risk compared to age-matched peers with optimal risk factors. The Framingham study group has developed a lifetime risk calculator based on long-term follow-up of their initial cohort.9 Alternatively, one can use the standard
Framingham algorithm and project risk to age 60.
Problems with risk assessment
Prevention strategies
Current primary prevention strategies suggest drug therapy for patients with high short-term (10-year) absolute risk. The aim is to prevent as many cardiovascular events as possible, while keeping the number of treated patients as small as possible. This strategy provides the ‘most bang for the buck’ in the short term, but many events remain unprevented for the following reasons. Prevention reduces, but does not abolish, risk in those offered therapy. The majority of the population will be classified as low risk and not offered treatment. However, a low event rate in a large population contributes many events to the final event tally. Using data from the PROCAM study, Assmann estimates that 80% of the male population aged 35 to 65 is at low risk (mean 10-year risk 3%), 14% is at intermediate risk (mean 10-year risk 13%) and 6% is at high risk (mean 10-year risk 33%). Thirty-two per cent of all myocardial infarctions will occur in the low-risk group, 35% in the intermediate-risk group and 33% in the high-risk group.10 Were one to offer
20% of the population treatment (high and intermediate risk), approximately one-third of all patients with myocardial infarction would not have had the chance to benefit from preventative treatment. This has led some to suggest that a universal prevention strategy using a ‘poly-pill’ would be more effective. The ingredients of the poly-pill would include several low-dose antihypertensives, a statin and folic acid. The poly-pill would be prescribed to everybody once they reach a certain age, irrespective of blood pressure or lipid levels.11 There has been much debate about the poly-pill
strategy, as it ‘medicalises’ the entire population. A more appealing strategy is to reduce risk factors at a population level by population level interventions (e.g. tobacco legislation, reducing salt in processed foods and creating urban environments conducive to walking) and then targeting drug interventions at selected high-risk individuals.
Epidemiology
Cardiovascular disease rates differ substantially among populations, and equations derived in one population may not be directly transferable to other populations. The Framingham equation can be calibrated for non-USA populations with the aid of local cardiovascular disease Example 1
Mr Smith is 43 years old. He comes in for a general check-up, but you soon realise that his main concern is his risk of coronary heart disease, as a colleague of his died suddenly during a board meeting a week ago. You obtain the following additional information: • Smoker of 20 cigarettes a day for the last five years. • Blood pressure 114/70 mmHg on no treatment. • Total cholesterol: 3.9 mmol/L; HDLC: 1.9 mmol/L. • Fasting glucose: 4.1 mmol/L.
You calculate his Framingham risk at 1% for the next 10 years. The only intervention you recommend is smoking cessation, maintaining a healthy diet and regular exercise. He wants to know why you did not request an hsCRP (“All my friends’ doctors do it”) and whether he should not go for the ‘heart scan test’. You explain that his risk is low and further investigations are very unlikely to reclassify risk as high. You explain that a study of CAC scoring did show that patients with high CAC and low Framingham scores had higher observed event rates than those in whom both scores were low. However, the absolute event rate in those with high CAC and low Framingham scores was still in the low-risk range.
Example 2
Mrs Potgieter is 32 years old and had a lipid test, as she is applying for life insurance. The total cholesterol was 9.3 mmol/L, with an HDLC of 1.4 mmol/L and LDLC of 7.5 mmol/L. The BP is 124/80 mmHg on no treatment and she has never smoked. She grew up in an orphanage because her mother died during childbirth and her father had a fatal myocardial infarction at age 33. You palpate a small nodule in her left Achilles tendon.
You apply for funding of statin therapy from her medical aid, but the application is declined because the Framingham risk is less than 1% for the next 10 years.
This patient clearly has the phenotype of familial hyper-cholesterolaemia and should not be risk-scored. Framingham grossly underestimates her risk and she should receive treatment irrespective of the calculated risk. Do not forget to make sure she is taking adequate contraception before starting the statin.
Example 3
Mr Douglas is 52 years old, and would like your opinion on his lipids. His wife is nagging him “to do something”, but he says that his lipids are “not really that high”. You obtain the following additional information:
• Smoker of 10 cigarettes a day for 20 years.
• Blood pressure “just a bit high” at 148/93 mmHg, despite treatment.
• Total cholesterol: 5.7 mmol/L; HDLC 0.8 mmol/L.
You calculate his Framingham risk. It is 25%, even though none of his values is “shockingly high”, as he puts it. You use the risk calculation to explain how multiple factors are combining to create high absolute risk and to justify the need for lifestyle and drug intervention.
statistics. The SCORE algorithm divides Europe into high-risk countries (e.g. Germany and the United Kingdom) and low-risk countries (e.g. France and Italy) with separate charts. South Africa does not have sufficiently accurate cardiovascular data to allow accurate algorithm calibration and our very diverse population further complicates the matter. South African guidelines thus currently recommend the use of the unmodified Framingham equation. Cardiovascular disease rates also change with time and it is important to adjust algorithms accordingly. Unmodified algorithms over-predict events in countries with declining cardiovascular disease rates.
Statistical issues
Risk prediction operates at a population and not at an individual level. A 5% 10-year risk turns into a ‘100% risk’ for the individual who does have the event. Unfortunately, we are not yet able to pinpoint risk at an individual level and provide truly personalised medicine.
Risk charts categorise continuous variables such as total cholesterol. Small changes in a variable may move it from one category to the next, significantly altering the calculated risk. Online risk calculators use the original risk equation and are not affected by this problem. Algorithms also generally do not account for risk variables changing over time. Smoking, for instance, is generally classified as ‘Yes’ or ‘No’, with little regard to dose and duration. A person classified as a ‘non-smoker’ may have never smoked or might have smoked 40 cigarettes a day for 30 years before quitting and subsequently earning the ‘non-smoker’ classification a year later.
The statistical models used to analyse the data generated from the study population have in general been fairly simplistic. More sophisticated analysis and modelling techniques such as neuronal network analysis may improve algorithm performance.
Clinical issues
Risk algorithms were designed for patients with risk factors within the ‘usual range’ and do not cater for patients with markedly elevated risk factors. Framingham, for instance, allocates the same point score to all total cholesterol values > 7.2 mmol/L, but cholesterol readings of 7.3 mmol/L or 20.0 mmol/L clearly have very different implications. Patients with genetic dyslipidaemias such as familial hypercholesterolaemia should thus not be risk-scored, as their risk will be severely underestimated.4;5
Because risk algorithms incorporate a limited number of variables, they may not be appropriate in all situations. Risk may for instance be increased by other non-measured factors such as renal dysfunction or chronic inflammation.
Expanded risk assessment
Multiple alternative risk-prediction strategies have been explored in an effort to overcome the limitations of conventional risk prediction. The two main alternatives are adding further blood tests or evaluating the vasculature directly. The optimal expanded risk-assessment strategy has not been defined as yet and the literature on the topic is characterised by debate and controversy. Many authors hold strong views and strongly propagate their ‘favourite’ blood test or imaging modality. At times, it can be difficult to distinguish science from opinion and self-interest.
One of the debates is on what the optimal statistical tests for evaluating new markers are. To be clinically useful, new markers must not only be statistically significantly associated with cardiovascular risk (all markers should meet this standard), but the addition of the information provided by the new risk marker to conventional risk assessment must significantly improve overall predictive ability. Of particular relevance is the ‘reclassification index’: how many patients will be correctly reclassified from one risk category (high risk, low risk and intermediate risk) to another. Reclassifications from intermediate risk are particularly relevant, as they often affect treatment decisions. A comprehensive review of all alternative strategies is beyond the scope of this article, and I only touch on a few points of particular relevance.
Additional blood tests
Additional blood tests may include more detailed lipid testing, the measurement of other biomarkers or genetic testing. Of the additional lipid tests, apolipoproteinB100 (apoB) and lipoprotein(a) are probably the best known. ApoB is a good marker of the number of atherogenic particles and some, but not all, studies show that it predicts risk better than LDLC.12-17 Elevated lipoprotein(a) (> 0.5 g/L)
confers increased risk and may sway the decision towards treatment when risk is borderline.
C-reactive protein
C-reactive protein (CRP) is the best studied and validated biomarker of vascular risk.18 The CRP test for risk prediction
is known as high-sensitivity CRP (hsCRP). The ‘high sensitivity’ simply indicates that the assay can measure CRP in its normal physiological range. Initial CRP assays were designed to measure high levels of CRP, which may increase more than a thousand-fold above its baseline with acute inflammation. As inflammation is central to the pathogenesis of atherosclerosis, CRP as a marker of inflammatory activity has attracted considerable research interest. There is substantial evidence that elevated CRP correlates with increased cardiovascular risk.18
hsCRP measurement in risk assessment. There are firmly entrenched ‘enthusiast’ and ‘sceptic’ camps in this regard. One of the controversial issues is whether CRP is a risk marker or a risk factor. Assuming elevated CRP is a risk factor causally contributing to atherosclerosis, then agents that specifically lower CRP may be useful anti-atherosclerotic drugs. In Mendelian randomisation studies, genetically elevated CRP (due to polymorphisms in the CRP gene) is not associated with an increased atherosclerosis risk19 and in an analysis of the PROVE-IT/TIMI22 study, on
treatment, CRP correlated positively with the number of uncontrolled risk factors.16 Mice with high levels of human
CRP, either following injection or expressed transgenically, also do not develop accelerated atherosclerosis.20 The
balance of evidence therefore suggests that CRP marks rather than causes risk.
The utility of adding CRP measurement to routine risk assessment is also not yet entirely clear. The Reynolds Risk Score is probably the best-known risk score that incorporates CRP. Adding CRP measurement to conventional risk assessment reclassified 20% of men with intermediate (10–20%) 10-year risk to another risk category, but adding family history was at least as predictive as CRP measurement.21 The utility of CRP in identifying patients
that will benefit from statins for primary prevention has also never been rigorously tested. The often quoted Jupiter study22 enrolled patients with high CRP and relatively low
LDLC. It showed that rosuvastatin 20 mg/day compared to placebo prevented cardiovascular events. The Jupiter study did, however, not enrol patients with low CRP and therefore did not test whether aggressively lowering lipids in patients with low CRP would be futile. Until further evidence becomes available, it is best to measure CRP only in selected patients with intermediate (10–20%) 10-year risk rather than requesting the test routinely. In intermediate-risk patients, a CRP of more than 2 mg/L would be a reasonable cut-off point for considering statin therapy for primary prevention.18
Other biomarkers
Other potential non-traditional risk markers include fasting glucose, leukocyte count, homocysteine and lipoprotein-associated phospholipase A2 (LP-PLA2), to name just a select few.23 A recent meta-analysis of studies of glucose
and vascular risk showed that diabetes is associated with two-fold vascular risk. In fasting, non-diabetic patients, blood glucose concentrations higher than 5.6 mmol/L were modestly associated with vascular risk, but in the study statistical model addition of glucose information to conventional risk factors did not improve risk prediction.24
This of course does not imply that one should not measure
the fasting glucose (to diagnose diabetes and assess the risk of future diabetes) – simply that the measurement does not add powerfully to cardiovascular risk prediction if it is in the non-diabetic range. There is contradictory data on the utility of the leukocyte count and no information on whether it improves conventional risk prediction.23
Homocysteine measurement is still requested fairly often, yet no study has assessed the value (risk reclassification) of adding homocysteine measurement to conventional Framingham assessment. As is the case for CRP, the majority of studies do show an epidemiological link between hyperhomocysteinaemia and vascular disease – there is just no evidence that this relationship can meaningfully improve risk prediction.23 Homocysteine intervention studies with
B-group vitamin supplementation did lower homocysteine successfully, but did not improve cardiovascular outcomes.25 Correct specimen handling is also crucial in
obtaining correct homocysteine measurements and delays between specimen collection and laboratory processing often cause spurious elevations. LP-PLA2 is a marker of vascular inflammation and is also being investigated as a novel therapeutic target. LP-PLA2 measurement has been proposed as an additional risk measure in intermediate-risk patients, but as yet no outcome studies support its use.26-28
Genetic testing
Single nucleotide polymorphisms in multiple genes associate with cardiovascular risk. Risk alleles were initially identified using the candidate gene approach (testing genes known to affect lipid metabolism or inflammation) and, more recently, by genome-wide association studies. Currently, further work is required to understand the impact of risk alleles singly and in combination and what they can add beyond conventional risk factors. Genetic testing may well become available in the future, but will require assessment of multiple single nucleotide polymorphisms (40 or more) using gene chip technology.29 None of the currently
marketed genetic screening tests have been sufficiently validated to be used routinely.
Vascular evaluation
Direct evaluation of the vasculature, usually by imaging, aims to detect subclinical atherosclerosis. Patients with evidence of vascular ‘damage’ are at higher cardiovascular risk. It is, however, important to note that one cannot extrapolate directly from vascular image to clinical event. Events can occur in those with little evident atherosclerosis (e.g. rupture of a small non-calcified plaque and vascular occlusion by thrombosis), while other patients with extensive plaques and vascular calcification may remain event-free.
Vascular evaluation assesses risk from another angle; it does not replace conventional risk evaluation, but can complement it in certain situations. Currently, it is most useful in those patients that were not adequately represented in the risk-derivation c ohorts, for instance those with ‘unusual’ risk factors such as very high HDLC, which may be proatherogenic in some and anti-atherogenic in others. Vascular imaging techniques are also frequently used in initial studies of novel anti-atherosclerotic agents. Only drugs that show positive effects in imaging studies proceed to large clinical outcome studies.
Ankle-brachial index
Ankle-brachial index (ABI) is non-invasive, relatively easy to measure and the equipment required is not very expensive. An ABI of less than 0.90 approximately doubles the 10-year total cardiovascular event rate, but once again, limited data are available on the clinical utility of routinely adding ABI measurement to cardiovascular risk assessment.30
Carotid intima media thickness
Carotid intima media thickness (IMT) can be measured non-invasively using ultrasound. The average distance between the lumen-intima and the media-adventitia interfaces is measured over a segment of arterial wall. Carotid IMT increases in everyone with age, but excessive thickening is a marker of subclinical atherosclerosis and increased vascular risk.31 The value of carotid IMT in risk
assessment has been shown in research settings, using highly standardised scanning and reading protocols. It has not been shown as yet that this precision can be replicated in non-research settings. Currently, many different protocols are used and reporting standards are also not uniform, and IMT may for instance be reported as either mean of mean or mean-maximum. Reference and cut-off values can therefore not simply be taken from published data without local protocol validation. Ideally, each unit should establish its own reference ranges.
Currently, carotid IMT should not be performed routinely outside of research settings, but is a useful tool in individual patients with difficult-to-determine cardiovascular risk.23
Coronary artery calcium scoring
Coronary calcium can be measured rapidly and reliably with electron beam CT (EBCT). Coronary calcium is a marker of coronary atherosclerosis, though its presence does not necessarily imply luminal obstruction and its absence does not prove the arteries are disease-free. Multiple studies have shown that a coronary artery calcium (CAC) score of zero is associated with a very low risk of events in the
medium term, while increasing scores are associated with a stepwise increase in the risk of events. Some studies have also shown that CAC scoring can provide additional risk information beyond that derived from conventional risk factors.31 There is as yet no evidence that a screening
strategy based on CAC scoring is associated with improved clinical outcomes.23 EBCT is associated with a small but
significant radiation exposure. If CAC is determined with conventional multidetector CT scanning, the radiation exposure is often higher. There is concern that routine use of CAC screening will lead to excessive further downstream investigations such as stress testing and angiography in asymptomatic patients. There is, however, very little evidence that interventions beyond optimal risk factor control improve the outcome of asymptomatic patients. Guidelines on CAC screening vary somewhat, but generally do not recommend routine CAC screening.32 CAC screening
should only be considered in intermediate risk patients and when the patient and physician both understand the implications of the test.33 CT coronary angiography has not
been evaluated in detail as a screening test and should thus not be used for the screening of asymptomatic patients. It is a diagnostic test for the evaluation of patients with clinical problems such as chest pain of unclear aetiology.32;34
Conclusion
Cardiovascular risk assessment is a science in rapid evolution. Exciting new biomarkers, genetic tests and imaging procedures enter the medical marketplace regularly and are often promoted enthusiastically for routine use. All of these tests correlate significantly with cardiovascular risk. What has been much more difficult to show is that adding the results of these tests to a conventionally derived risk estimate significantly improves predictive ability. Proving that the ‘expanded test package’ is better than the ‘standard package’ is difficult and often requires large and expensive studies. These studies do, however, need to be done, as routine implementation of certain strategies, for example routine vascular imaging of all adults over a certain age (as has been suggested)35 is associated with significant health
care cost implications. Not all tests, for example carotid IMT scanning, have been sufficiently standardised to move from the research setting to routine clinical use, and many tests have not yet been validated in non-white populations. Routine clinical risk assessment is therefore still best done with conventional risk algorithms, despite the imperfections associated with this approach. Additional tests may be helpful when risk is borderline or when ‘unusual’ risk factors are present.
Framingham tables
Men
Age (years) Points
20–34 -9 35–39 -4 40–44 0 45–49 3 50–54 6 55–59 8 60–64 10 65–69 11 70–74 12 75–79 13 Women
Age (years) Points
20–34 -7 35–39 -3 40–44 0 45–49 3 50–54 6 55–59 8 60–64 10 65–69 12 70–74 14 75–79 16 Age (years) Total cholesterol (mmol/L) 20–39 40–49 50–59 60–69 70–79 < 4 0 0 0 0 0 4.1–5 4 3 2 1 0 5.1–6.2 7 5 3 1 0 6.21–7.2 9 6 4 2 1 ≥ 7.2 11 8 5 3 1 Age (years) Total cholesterol (mmol/L) 20–39 40–49 50–59 60–69 70–79 < 4 0 0 0 0 0 4.1–5 4 3 2 1 1 5.1–6.2 8 6 4 2 1 6.21–7.2 11 8 5 3 2 ≥ 7.2 13 10 7 4 2 Age (years) 20–39 40–49 50–59 60–69 70–79 Non-smoker 0 0 0 0 0 Smoker 8 5 3 1 1 20–39 40–49 50–59 60–69 70–79 Non-smoker 0 0 0 0 0 Smoker 9 7 4 2 1
Systolic BP (mmHg) If untreated If treated
< 120 0 0
120–129 0 1
130–139 1 2
140–159 1 2
≥ 160 2 3
Systolic BP (mmHg) If untreated If treated
< 120 0 0
120–129 1 3
130–139 2 4
140–159 3 5
≥ 160 4 6
Points total 10-year risk %
< 0 < 1 0 1 1 1 2 1 3 1 4 1 5 2 6 2 7 3 8 4 9 5 10 6 11 8 12 10 13 12 14 16 15 20 16 25 ≥ 17 ≥ 30
Points total 10-year risk %
< 9 < 1 9 1 10 1 11 1 12 1 13 2 14 2 15 3 16 4 17 5 18 6 19 8 20 11 21 14 22 17 23 22 24 27 > 25 ≥ 30
The 10-year risk for coronary disease is calculated by adding the points for age, total cholesterol, smoking status, HDLC and blood pressure. The risk can then be read from the points table. The Framingham calculation should not be used in patients with severe monogenic hyperlipidaemia (e.g. familial hypercholesterolaemia), diabetic patients and patients with clinically overt atherosclerotic cardiovascular disease (secondary prevention).
HDL (mmol/L) Points ≥ 1.6 -1 1.30–1.59 0 1.00–1.29 1 < 1 2 HDL (mmol/L) Points ≥ 1.6 -1 1.30–1.59 0 1.00–1.29 1 < 1 2
References
1. WHO Statistical Report 2006. www.who.int. 2010.
2. Spence D. Losing the moment. British Medical Journal 2010;340:c3366–c3367.
3. Yusuf S, Hawken S, Ounpuu S, et al. Effect of potentially modifiable risk factors associated with myocardial infarction in 52 countries (the INTERHEART study): case-control study. Lancet 2004;364(9438):937–952.
4. Executive Summary of The Third Report of The National Cholesterol Education Program (NCEP) Expert Panel on Detection, Evaluation, And Treatment of High Blood Cholesterol In Adults (Adult Treatment Panel III). JAMA 2001;285(19):2486–2497.
5. Graham I, Atar D, Borch-Johnsen K et al. European guidelines on cardiovascular disease prevention in clinical practice: executive summary. Eur Heart J 2007;28(19):2375–2414.
6. Assmann G, Cullen P, Schulte H. Simple scoring scheme for calculating the risk of acute coronary events based on the 10-year follow-up of the prospective cardiovascular Munster (PROCAM) study. Circulation 2002;105(3):310–315.
7. Hippisley-Cox J, Coupland C, Vinogradova Y, Robson J, May M, Brindle P. Derivation and validation of QRISK, a new cardiovascular disease risk score for the United Kingdom: prospective open cohort study. BMJ 2007;335(7611):136.
8. Hippisley-Cox J, Coupland C, Vinogradova Y, et al. Predicting cardiovascular risk in England and Wales: prospective derivation and validation of QRISK2. BMJ 2008;336(7659):1475–1482.
9. Lloyd-Jones DM, Leip EP, Larson MG, et al. Prediction of lifetime risk for cardiovascular disease by risk factor burden at 50 years of age. Circulation 2006;113(6):791–798.
10. www.assmann-stiftung.de. 2010.
11. Wald NJ, Law MR. A strategy to reduce cardiovascular disease by more than 80%. BMJ 2003;326(7404):1419.
12. Lima LM, Carvalho MG, Sousa MO. Apo B/apo A-I ratio and cardiovascular risk prediction. Arq Bras Cardiol 2007;88(6):e187–e190. 13. Carnevale Schianca GP, Pedrazzoli R, Onolfo S, et al. ApoB/apoA-I
ratio is better than LDL-C in detecting cardiovascular risk. Nutr Metab Cardiovasc Dis 2010.
14. Agoston-Coldea L, Zdrenghea D, Pop D, Craciun A, Rusu ML, Mocan T. Apolipoproteins A-I and B-markers in coronary risk evaluation. Rom J Intern Med 2007;45(3):251–258.
15. Walldius G, Jungner I. Is there a better marker of cardiovascular risk than LDL cholesterol? Apolipoproteins B and A-I--new risk factors and targets for therapy. Nutr Metab Cardiovasc Dis 2007;17(8):565–571.
16. Ray KK, Cannon CP, Cairns R, Morrow DA, Ridker PM, Braunwald E. Prognostic utility of apoB/AI, total cholesterol/HDL, non-HDL cholesterol, or hs-CRP as predictors of clinical risk in patients receiving statin therapy after acute coronary syndromes: results from PROVE IT-TIMI 22. Arterioscler Thromb Vasc Biol 2009;29(3):424–430. 17. van der Steeg WA, Boekholdt SM, Stein EA, et al. Role of the
apolipoprotein B-apolipoprotein A-I ratio in cardiovascular risk assessment: a case-control analysis in EPIC-Norfolk. Ann Intern Med 2007;146(9):640–648.
18. Buckley DI, Fu R, Freeman M, Rogers K, Helfand M. C-reactive protein as a risk factor for coronary heart disease: a systematic review and meta-analyses for the U.S. Preventive Services Task Force. Ann Intern Med 2009;151(7):483–495.
19. Zacho J, Tybjaerg-Hansen A, Jensen JS, Grande P, Sillesen H, Nordestgaard BG. Genetically elevated C-reactive protein and ischemic vascular disease. N Engl J Med 2008;359(18):1897–1908. 20. Tennent GA, Hutchinson WL, Kahan MC, et al. Transgenic human CRP
is not pro-atherogenic, pro-atherothrombotic or pro-inflammatory in apoE-/- mice. Atherosclerosis 2008;196(1):248–255.
21. Ridker PM, Paynter NP, Rifai N, Gaziano JM, Cook NR. C-reactive protein and parental history improve global cardiovascular risk prediction: the Reynolds Risk Score for men. Circulation 2008;118(22):2243–51, 4p.
22. Ridker PM, Danielson E, Fonseca FA, et al. Rosuvastatin to prevent vascular events in men and women with elevated C-reactive protein. N Engl J Med 2008;359(21):2195–2207.
23. Using nontraditional risk factors in coronary heart disease risk assessment: U.S. Preventive Services Task Force recommendation statement. Ann Intern Med 2009;151(7):474–482.
24. Sarwar N, Gao P, Seshasai SR, et al. Diabetes mellitus, fasting blood glucose concentration, and risk of vascular disease: a collaborative meta-analysis of 102 prospective studies. Lancet 2010;375(9733):2215–2222.
25. Ciaccio M, Bellia C. Hyperhomocysteinemia and cardiovascular risk: effect of vitamin supplementation in risk reduction. Curr Clin Pharmacol 2010;5(1):30–36.
26. Packard CJ. Lipoprotein-associated phospholipase A2 as a biomarker of coronary heart disease and a therapeutic target. Curr Opin Cardiol 2009;24(4):358–363.
27. Ali M, Madjid M. Lipoprotein-associated phospholipase A2: a cardiovascular risk predictor and a potential therapeutic target. Future Cardiol 2009;5(2):159–173.
28. Davidson MH, Corson MA, Alberts MJ, et al. Consensus panel
recommendation for incorporating lipoprotein-associated
phospholipase A2 testing into cardiovascular disease risk assessment guidelines. Am J Cardiol 2008;101(12A):51F–57F. 29. Humphries SE, Drenos F, Ken-Dror G, Talmud PJ. Coronary heart
disease risk prediction in the era of genome-wide association studies: current status and what the future holds. Circulation 2010;121(20):2235–2248.
30. Fowkes FG, Murray GD, Butcher I, et al. Ankle brachial index combined with Framingham Risk Score to predict cardiovascular events and mortality: a meta-analysis. JAMA 2008;300(2):197–208. 31. Chambless LE, Folsom AR, Sharrett AR, et al. Coronary heart
disease risk prediction in the Atherosclerosis Risk in Communities (ARIC) study. J Clin Epidemiol 2003;56(9):880–890.
32. Perrone-Filardi P, Achenbach S, Mohlenkamp S, et al. Cardiac computed tomography and myocardial perfusion scintigraphy for risk stratification in asymptomatic individuals without known cardiovascular disease: a position statement of the Working Group on Nuclear Cardiology and Cardiac CT of the European Society of Cardiology. Eur Heart J 2010.
33. Bonow RO. Clinical practice. Should coronary calcium screening be used in cardiovascular prevention strategies? N Engl J Med 2009;361(10):990–997.
34. Winchester DE, Wymer DC, Shifrin RY, Kraft SM, Hill JA. Responsible use of computed tomography in the evaluation of coronary artery disease and chest pain. Mayo Clin Proc 2010;85(4):358–364. 35. Naghavi M, Falk E, Hecht HS, et al. From vulnerable plaque to
vulnerable patient--Part III: Executive summary of the Screening for Heart Attack Prevention and Education (SHAPE) Task Force report. Am J Cardiol 2006;98(2A):2H–15H.