Title
On the Bank-led Rescues Financially Distressed
Firms in Japan
Author(s)
Iwatsubo, Kentaro
Citation
Issue Date
2005-03
Type
Technical Report
Text Version
publisher
URL
http://hdl.handle.net/10086/13877
Center for Economic Institutions
Working Paper Series
CEI Working Paper Series, No. 2004-25
On the Bank-led Rescues Financially
Distressed Firms in Japan
Kentaro Iwatsubo
Center for Economic Institutions
Working Paper Series
Institute of Economic Research Hitotsubashi University
2-1 Naka, Kunitachi, Tokyo, 186-8603 JAPAN Tel: +81-42-580-8405
On the Bank-led Rescues of Financially
Distressed Firms in Japan
Kentaro Iwatsuboy Hitotsubashi University First version: March 2003
This version: Sep. 2004
Abstract
In this paper, we argue that the bank-led rescues of …nancially dis-tressed …rms in the heyday of the main bank system was ine¢ cient since banks’ implicit guarantee against bankruptcy resulted in moral hazard. The empirical results show that during the period before the …nancial deregulation of the 1980s main bank client …rms retrenched operational expenses and improved corporate performance signi…cantly less than the …rms without close bank ties after the onset of …nancial distress. This evidence suggests that managers of bank-a¢ liated …rms tended to do away with sharp downsizing by relying on …nancial sup-port from their main bank.
Hitotsubashi University, Institute of Economic Research. Email: iwatsubo@ier.hit-u.ac.jp
yI am grateful to helpful comments by Kaku Furuya, Akiyoshi Horiuchi, Masaharu
Hanazaki, Hideshi Itoh, Matthias Kahl, Masaaki Kato, Makoto Nirei, Seki Obata, Makoto Saito, Juro Teranishi, Aaron Tornell and seminar participants at Hitotsubashi, Daito-Bunka, and the Japan Economic Association Fall 2003 Meeting. All errors are my own.
1
Introduction
While corporate governance in the U.S. is market-oriented, that in Japan is generally characterized as a stable, relationship-based system. Many be-lieve that Japanese banks have played an important role in monitoring and disciplining managers of their client …rms through a long-term link, the so-called "main bank relationship". The prolonged stagnation for more than a decade, however, questions the e¤ectiveness of the main bank system since its role of monitoring client …rms seems incompatible with today’s serious non-performing loan problems. In response to this challenge, some profes-sionals have argued that the recent poor corporate governance by Japanese banks was a consequence of the …nancial deregulation since the 1980s, which lowered rent opportunities of banks and thereby discouraged them from monitoring their client …rms prudently (Aoki (1994), Hoshi and Kashyap (2001)).1
The conventional view with regard to corporate governance in Japan is the "state-contingent governance" theory (Aoki (1988)). In normal or favorable …nancial states, the governance structure of top management is entirely controlled by the body of permanent employees even though its main bank monitors the …rm management. Once the …rm is involved in …nancial distress, the main bank intervenes in the corporate management and provides special …nancial assistance to improve operating performance. Hoshi, Kashyap and Scharfstein (1990b) argue that the bank interventions rescue …rms from costly …nancial distress. They show evidence that main bank client …rms invest and sell more after the onset of …nancial distress than the …rms without close bank ties.
However, are bank-led rescues of distress …rms always e¢ cient? When main banks bail out and monitor client …rms, can they recover from …nancial distress more quickly than the …rms without close bank ties? In other words, do strong bank ties lead …rm managers to work less vigorously than if they had to deal with arm’s length creditors? To our knowledge, no systematic studies exist that investigate whether the bankled rescues of …rms are e¢ -cient or not. This paper …lls the gap by focusing on corporate restructuring of the …rms in …nancial distress.
To the extent that corporate restructuring leads to improvement in
op-1It should be noted that some scholars have already cast doubt on the monitoring
role of main banks. Hanazaki and Horiuchi (2000) argue that …nancial deregulation was gradually and cautiously proceeded so as not to a¤ect the pro…tability of banks. They also document that the decline in bank dependency by large …rms started in the late 1970s, before the onset of …nancial deregulation.
erating performance, one might expect the e¤ective corporate governance implies that main banks urge …nancially distressed …rms to engage in re-structuring for more e¢ cient management. Contrary to this, we discover that main bank client …rms in …nancial distress retrenched signi…cantly less than the …rms without close bank ties during the period before the …nancial deregulation of the 1980s. We also …nd that the corporate performance of the main bank client …rms improved markedly less after the onset of distress than the downsizing independent …rms. Based on the above evidence, we argue that managers of main bank client …rms tended to do away with down-sizing by relying on …nancial support from their main bank. The bank-led rescues of distressed …rms in the heyday of the main bank system might be ine¢ cient due to the implicit guarantee against bankruptcy.
Furthermore, we document that such di¤erences in retrenchment and performance recovery after the onset of …nancial distress between main bank clients and independent …rms disappeared in the 1990s. We interpret this …nding as evidence that main bank client …rms no longer believed in the implicit bail-out guarantee, partly because main banks could not a¤ord to commit themselves to prop up client …rms.
We then examine whether the decisions of corporate restructuring are in‡uenced by capital and ownership structure. We …nd that the bank loan ratio and the bank ownership share are negatively correlated with cost re-ductions and subsequent improvement in performance, which is consistent with our moral hazard hypothesis. In contrast, corporate restructuring and quick recovery of performance are more likely when the foreign ownership share is high. In spite of being small shareholders, foreign investors appear to play a more signi…cant role in the management of …nancially distressed …rms than the silent majority of large investors that have long-term relation-ships with the …rms, such as …nancial institutions and domestic corporate shareholders, in the 1990s.
Section 2 of this paper reviews previous studies on corporate governance in Japan. Section 3 and 4 describe the data and empirical results, respec-tively. Section 5 concludes.
2
Prior Research on Corporate Governance in Japan
2.1 The Main Bank System
One of the distinctive institutional features of corporate governance in Japan is the main bank system. Traditionally, a number of …rms have maintained a close relationship with a particular bank, known as "main bank", which
holds the largest block of equity (at least among banks) and is a major lender.2 The alleged role of main banks is to monitor …rm management, to extend various types of …nancial assistance in …nancial distress, to dispatch a management team if necessary, to restructure …rm organizations in bad situations, and to allow the …rm to go bankrupt in the worst situations.
The cornerstone of the main bank system is the information-sharing rela-tionship between the bank and its client …rm. The close association between the main bank and the …rm allows the bank to obtain information about the internal decision making of the …rm which is not readily available, or available only at high cost, to the external capital market (Sheard (1989)). In this context, a long-term main bank relationship is regarded as an institu-tion that mitigates the problem of asymmetric informainstitu-tion between lenders and borrowers.
Diamond (1984) shows that delegating the task of monitoring to a …nan-cial intermediary minimizes monitoring costs, while issuing securities like public debt and equity may be ine¢ cient either because monitoring costs are needlessly duplicated among individual security holders or because mon-itoring is a public good that no one has an incentive to provide (free-rider problems).3 Hoshi, Kashyap and Scharfstein (1990a, 1991) present evidence that …rms with closer ties with main banks are less liquidity constrained in their investment decision than independent …rms.4 They conclude that since main banks acquire inside knowledge of …rm’s investment opportuni-ties, they facilitate smoother investment by freeing client …rms from reliance on internal funds.
2
The Japanese Anti-Monopoly Law allows banks to hold up to 5% of a …rm’s stock (10% prior to 1987), but banks can exert more control over the …rm by mobilizing the shareholding of the group’s trust bank, insurance company, trading company and other member …rms. It is argued that these shareholdings deter potential hostile takeover bids.
3As Sheard (1989) argues, the sense in which the main bank represents a delegated
monitor is slightly di¤erent from the sense in which Diamond (1984) uses the term. In Diamond’s model, monitoring is delegated from depositors to an intermediary, whereas the main bank system can be characterized in terms of banks themselves delegating the monitoring of a particular …rm to one particular bank (the main bank). Thus, in Japan the main bank may be the only bank that monitors the …rm, but it is not the only bank which lends to the …rm.
4Following Fazzari, Hubbard and Peterson (1988) and others, Hoshi, Kashyap and
Scharfstein (1990a, 1991) use investment-cash ‡ow sensitivity as an indicator of liquidity constraint. Several recent papers, however, question the validity of this approach. Kaplan and Zingales (1997) reexamine the "constrained" …rm group used in the study of Fazzari, Hubbard and Peterson (1988) and show that sensitivity is the highest for those …rms that are deemed unconstrained. Gomes (2001) theoretically shows signi…cant cash ‡ow e¤ects even in the absence of …nancial frictions.
However, some scholars were reluctant to fully embrace the bene…cial monitoring view of main banks even before the …nancial deregulation of the 1980s.5 Caves and Uekusa (1976), Nakatani (1984) and Weinstein and Yafeh (1998) all show that bank-a¢ liated …rms performed worse than independent …rms on a variety of measures of pro…tability, suggesting that the bene…ts of bank relationship is not internalized by the …rm. Weinstein and Yafeh (1998) …nd that main banks charge their client …rms higher interest rates than …rms with weak bank ties. They argue that these high debt costs re‡ect that banks are able to extract rents from their client …rms in return for providing capital and other services. On the other hand, Aoki (1988) attributes the costs to an "agency fee" paid by individual shareholders for bank monitoring. Another possibility may be that it is a "bankruptcy insurance premium". Hoshi, Kashyap, and Scharfstein (1990b) stress the role of main banks to provide special assistance for their client …rms in …nancial distress.6 These assistance packages typically involve the provision of emergency …nance in the …rst instance and then reductions or exemptions of interest payments (Kawai, Hashimoto and Izumida (1996)).7
Another vital way of main banks to bail out client …rms is to dispatch managers to the client …rms in …nancial distress. Kaplan and Minton (1994) report that bank director appointments are more likely when …rms perform poorly and that such bank appointments are associated with a higher like-lihood of CEO turnover and improved subsequent …rm performance. Kang and Shivdasani (1995) …nd that poorly performing CEOs are more likely to be replaced when …rms have strong main bank ties. Morck and Naka-mura (1999) document that bank director appointments play di¤erent roles for group …rms and outside group …rms. For non-group …rms, banks act as creditors to rescue their client …rms from poor current liquidity. On the other hand, for group …rms, banks act in the broader interests of stakehold-ers, including shareholders.
The above arguments indicate that the costs and bene…ts of main bank governance hinge, in large part, upon the e¢ ciency of bank-led rescues of …nancially distressed …rms. In this paper, we examine how main bank client
5Sharpe (1990) and Rajan (1992) argue that close bank ties may be costly for client
…rms, as information monopolies or market power allow banks to extract rents.
6However, Hall and Weinstein (2000) …nd that …rms without main bank ties receive as
much loan assistance (from the top lending bank and from all bank lenders) as …rms with ties to main banks.
7Fukao (1999) reports that the survey conducted in 1992 by Fuji Research Institute
reveals that a number of …rms expect emergency assistance from their main banks when they become …nancially distressed, in return for the long-term close ties with their main bank.
…rms respond to …nancial distress in comparison with the …rms without close bank ties.
2.2 Corporate Restructuring and Governance
When …rms are involved in …nancial distress, they try to avoid bankruptcy by restructuring their assets and liabilities. Asset sales, mergers, capital expen-diture reductions, and layo¤s (on asset side), and restructuring of bank debt and public debt (on liability side) are common responses to distress (Asquith, Gertner and Scharfstein (1994)). Moreover, some evidence shows that cor-porate performance signi…cantly improves following downsizing (John and Ofek (1995), Espahbodi, John and Vasudevan (2000)).
It is sometimes argued in Japan, however, that the traditional Japanese management system (e.g., seniority ranking and lifetime employment) is incompatible with the U.S.-style corporate restructuring. As opposed to this, Kang and Shivdasani (1997) …nd that the responses of Japanese …rms to a substantial decline in their operating performance are surprisingly similar to the U.S. …rms in many respects, such as selling assets, closing plants, reducing capital expenditures and production, and through employee layo¤s, although the frequency is lower than that of the U.S. counterparts.
Kang and Shivdasani (1997) report that the likelihood of asset down-sizing and layo¤s in Japanese …rms increases with the ownership by the …rms’ main bank and other blockholders. They also …nd that the owner-ship by blockholders increases the probability of management turnover and outsider director additions, but reduces the likelihood of acquisitions. Our paper is di¤erent from Kang and Shivdasani (1997) in that they measure the frequency of corporate restructuring, while we examine its magnitude and speed. We also focus on the di¤erence in response to performance declines between the …rms with and without close bank ties, to which they do not pay attention.
Morck and Nakamura (1999) document that bank group …rms’entertain-ment spending rises at uniformly higher rates following bank appoint…rms’entertain-ments than nongroup …rms’, although the di¤erence is not statistically signi…cant. The present paper looks at various measures of corporate restructuring fol-lowing …nancial distress. It also identi…es …nancial and ownership factors that could a¤ect corporate restructuring and subsequent improvement in performance.
3
Data
We use …nancial data on all manufacturing …rms listed on the Tokyo Stock Exchange that are obtained from the Japan Development Bank data base. We …rst identify a set of …rms that su¤ered …nancial distress. Among the many possible de…nitions of …nancial distress, following John, Lang and Net-ter (1992), we choose one that selects …rms experiencing negative ordinary income (operating income net of non-operating pro…ts) for two consecutive years followed by three years of positive ordinary income.8 As a convention, we denote the …rst year in which the ordinary income is negative as period t. Thus, for example, period t-1 refers to the year of healthy performance preceding two years of …nancial distress and period t+3 is the second year of positive pro…ts following the spell of …nancial distress.
We adopt this de…nition for the following reasons. First, selecting …rms with two years of poor performance ensures identi…cation of responses to short-term …nancial distress, making it possible to evaluate the speed and the magnitude with which a …rm reacts to a decline in value. As Kawai, Hashimoto and Izumida (1996) describe in detail, the consecutive years of negative pro…ts usually arouse concerns with the …rm’s management and may invite some form of bank intervention since banks tend to view them as a re‡ection of something fundamentally wrong with the …rm’s management and operation rather than a temporary adverse shock to the …rm.
Second, using a short period of poor performance avoids bringing into our sample …rms continuing poor performance to which they did not react. The data reveal that …rms do not always return to consecutive years of positive pro…ts following consecutive years of negative pro…ts; they often sink into consecutive negative pro…ts for a year or even several years after having brie‡y returned to positive pro…ts. We assume that these long distressed …rms can continue their business due to the continuous …nancial support from their main banks. Hence, excluding these …rms from our sample does not necessarily bias our conclusion.
We examine two distinct sample periods to see whether the role of main banks changed following the …nancial deregulation. The …rst sample period
8Hoshi, Kashyap and Scharfstein (1990b) use an alternative de…nition of …nancial
dis-tress, which is the two consecutive years of less than one coverage ratio (the ratio of operating income to interest payments). A close investigation of the …nancial data reveals that when Japanese large …rms have less than one coverage ratio, they usually try to sell …xed property (e.g. real estate and …nancial assets) to make their ordinary pro…t positive. These large …rms do not respond promptly to their poor performance. Hence, we do not follow their de…nition in this paper.
in which …rms could enter our sample begins in April 1978 and ends in March 1985, while the second period begins in April 1990 and ends in March 1997. For most …rms, the …scal year runs from April 1 to the following March 31. We correspond our …rst sample period to that of Hoshi, Kashyap, and Scharfstein (1990b) and de…ne it as the pre-deregulation period. This is because Hoshi, Kashyap, and Scharfstein (1990a) identify 1983 as the year in which the …nancial deregulation virtually started in Japan. We name our second sample period the post-deregulation period. The second sample period is chosen so that we can include the most recent and available data. We identify 72 …rms in the pre-deregulation period and 112 …rms in the post-deregulation period matching our criteria.
The next step in forming the data is to identify which …rms had close ties to main banks. As Aoki, Patrick and Sheard (1994), and Hall and Weinstein (2000) argue, any de…nition of main bank contains noise which decreases the power of econometric tests. For example, de…nitions based on a¢ liation with an industrial group seem to be excessively strict, because some una¢ liated …rms have long-term ties with banks. De…nitions based on bank lending behavior are sometimes inappropriate because many …rms go through periods without any borrowing from banks. In this paper, we choose the latter de…nition since almost all …nancially distressed …rms bor-row from banks. Here, the main bank client …rms are de…ned if their largest commercial bank lender does not change for …ve years prior to the beginning of …nancial distress and during the period of …nancial distress. On the other hand, if the largest bank lender changes at least once over the same period, we regard the …rm as an independent. Ultimately, we have 42 main bank client …rms out of 72 …rms in the pre-deregulation period and 47 main bank clients out of 112 …rms in the post-deregulation period.
Table 1 lists the descriptive statistics for …nancially distressed …rms in our sample. In this paper, we assume that the following factors could a¤ect corporate restructuring and subsequent performance recovery: a main bank dummy, bank loan ratios, leverage ratios, bank ownership, the ownership by large shareholders, and foreign ownership. Out of the 72 …rms for the pre-deregulation period, 58.3% are …rms with close ties to their main bank, while 41.9% are main bank clients out of the 112 …rms for the post-deregulation period. This partially re‡ects the decline in dependency for …nancing on banks by large …rms in Japan.
Declines in bank loan ratios (the bank loans as a share of debt) and lever-age ratios (the debt as a share of total asset) also indicate the trend of the decline in bank dependency. On the other hand, foreign ownership slightly increased in our sample. In fact, the foreign ownership as a percentage of
market value has increased substantially during the 1990s.
Looking at the correlations among capital structure measures and equity ownership shares for the two sample periods (Table 2), we …nd positive and high correlations between bank loan ratios and bank ownership shares in the pre-deregulation period, but they turn out to be negative in the post-deregulation period. This suggests that even after large …rms lowered their bank dependency, banks may have kept a signi…cant in‡uence on their client …rms as shareholders.
Bank ownership and large shareholder are negatively correlated. We interpret this as evidence that large shareholders are dominated by non-…nancial corporate shareholders.
Lastly, as opposed to our intuition, the correlations between main bank dummy and bank loan ratio are low. This suggests that main bank client …rms do not necessarily have high bank loan ratios relative to the …rms without close bank ties.
4
Empirical Results
The primary objective of this paper is to empirically investigate whether main banks urge client …rms in …nancial distress to engage in corporate restructuring to recover their operating performance. We also examine whether capital and ownership structure a¤ect corporate restructuring and subsequent performance recovery. Before examining whether there is any di¤erence in corporate restructuring between main bank client …rms and independent …rms, we test whether corporate restructuring contributes to improvement in performance.
4.1 E¤ect of Restructuring on Performance Recovery
Here, we test to identify factors that can improve the operating performance of …nancially distressed …rms. We do this by regressing the changes in operating performance on several measures of corporate restructuring. The dependent variable is the changes in ordinary income as a percentage of the lagged assets. We measure the changes in the dependent and independent variables relative to the …rst year of negative pro…t.
The …rst independent variable is the percentage change in assets. John and Ofek (1995) argue that the sale of assets leads to improvement in per-formance through an increase in a …rm’s focus. On the contrary, as Jensen (1986) suggested, expansion of assets that represents diversi…cation strate-gies or results in a loss of focus can be detrimental to …rm value.
Nev-ertheless, a substantial investment in the core business, especially when accompanied by reducing the number of segments, could also result in im-provement in performance due to economies of scale. Hence, we do not make any predictions regarding the coe¢ cient of this variable.
The second and third variables are the percentage change in the number of employees and the change in labor cost as a percentage of sales, respec-tively. Layo¤s of employees, reductions in compensations or bonuses, and other actions are likely to occur so that …rms would downsize, or adopt more e¢ cient or capital intensive production techniques. These should lead to improvement in performance. However, large cuts in employees can de-moralize the survivors and lead to losses in productivity (Brockner (1988)). This could hamper or even reverse the e¤ect of cost savings. These variables also could have ambiguous e¤ects on performance recovery.
The last variable we use is the change in operating expenses as a per-centage of sales.9 This is a typical measure for the e¢ ciency of the cost structure of …rms. In general, …rms with low cost structure generate more pro…ts than those with high cost structure. Hence, we expect a positive coe¢ cient for this variable.
We conduct this analysis using a median regression estimator due to the skewness of accounting data and the existence of extreme observations (Kaplan (1989), Jain and Kini (1994)). Some distressed …rms are involved in major restructuring through asset sales, spin-o¤s, and mergers. Hoshi, Kashyap, and Scharfstein (1990b) exclude these …rms from their sample since they are unable to measure the …rms’investment. However, this introduces the possibility of selection bias in their sample. We do not omit them; instead, we use the median regression and avoid the possibility of estimation bias due to the extreme observations.
Table 3 reports the results of our analysis. We conduct the same regres-sions for both pre- and post-deregulation periods to see the di¤erence in the e¤ect of corporate restructuring on improvement in performance between the two periods. In the equation 1, we regress the change in ordinary income as a percentage of the lagged assets over the period from t to t+2 against the changes in measures of corporate restructuring from t to t+1. The coe¢ -cient of the change in assets is positive and signi…cant at the 1% level, which is consistent with related work by Espahbodi, John and Vasudevan (2000). This suggests that …rms that increased their asset base had improvement in performance. The coe¢ cients of the changes in the number of employees
9
"Operating expenses" refer to the selling and general administrative expenses in the Japanese accounting terms.
and labor cost are both negative, although the coe¢ cient of employees is not signi…cant. Firms that were able to reduce costs by reducing the number of employees and/or compensations improved performance. The coe¢ cient of the change in operating expenses is also negative and signi…cant at the 5% level. Firms that succeed in cutting down on operating expenses have larger improvement in performance.
In the equation 2, we conduct the regression when the dependent variable is taken over the period from t to t+3 and the independent variables from t to t+2. The results are similar to those of the equation 1 except that the coe¢ cient of the change in assets is not signi…cant. The coe¢ cients of the changes in labor cost and operating expenses are both negative and signi…cant.
The equations 3 and 4 have the same speci…cations as the equations 1 and 2, but use observations for the post-deregulation period. Interestingly, the results are quite similar to those for the pre-deregulation period. The coe¢ cients of the change in assets are positive and the coe¢ cients of the other three variables are negative for the two equations. Overall, our results suggest that corporate restructuring tends to be more successful for the …rms that cut down on labor cost and operating expenses.
4.2 Main Bank Client Firms versus Independent Firms
In this section, we compare the operating performance, corporate size, and the certain elements of costs between main bank client …rms and independent …rms.
Table 4-1 through 4-5 shows our analysis. We present results and signif-icance levels for both medians and means, but we base our analysis on me-dians. This is common practice for the same reasons described above. For medians, we base signi…cance levels on non-parametric Wilcoxon signed-rank test. For means, we report parametric t tests. Barber and Lyon (1996) demonstrate that because extreme observations exist, non-parametric Wilcoxon signed-rank test are uniformly more powerful than parametric
t tests. We report both test statistics for completeness, but emphasize the nonparametric tests. Furthermore, we conduct Wilcoxon rank-sum tests to examine whether the di¤erence in median of our measures between main bank client …rms and independent …rms is signi…cantly di¤erent from zero. We conduct the same analysis using industry-adjusted data and obtain the similar results. Since we are interested in the absolute changes in these variables, we do not report the industry-adjusted results.
main bank client …rms and independent …rms over the periods before and after the …nancial deregulation. All variables are measured relative to the …rst year of negative pro…t (period t). Panel A shows that following the …nancial distress the median of operating performance for all …rms steadily increases in the pre-deregulation period. The performance changes from t to t+2 and from t to t+4 are 3.9% and 6.0%, respectively. While both main bank client …rms and independent …rms had improvement in performance following …nancial distress, the median changes in operating performance are signi…cantly higher for independent …rms than for main bank …rms. On the other hand, the standard deviation of the changes in operating performance for independent …rms is more than that for main bank client …rms. Panel B reports the changes in operating performance in the post-deregulation pe-riod. From t to t+2, the changes in operating performance are higher for main bank clients than those for independents although they are not signi…-cantly di¤erent. Independent …rms had larger improvement in performance from t to t+3 and from t to t+4 than main bank client …rms.
In sum, independent …rms generally outperformed main bank client …rms after the onset of …nancial distress. This result seems contradictory to the …ndings of Hoshi, Kashyap, and Scharfstein (1990b) that main bank client …rms invest and sell more than independent …rms during the same period. We show below that the main reason for this discrepancy is that independent …rms curtail their operational costs more than main bank client …rms.
We then examine the median changes in …rm size and certain elements of costs that could a¤ect improvement in performance. Table 4-2 reports the percentage changes in assets for all …rms, main bank client …rms, and independent …rms. The period covers from the …rst year of negative pro…ts (period t) to three years from that year. Panel A shows that for all …rms, there is a slight decline in assets from t to t+1 (median -1.0%) followed by a slight recovery from t+1 to t+2 (median 1.8%) and a signi…cant increase from t+2 to t+3 (median 3.0%). Over the period from t to t+3 the median assets increase by 4.8%, but this increase is insigni…cant according to the signed-rank test. Although the di¤erence is not signi…cant, independent …rms grow at higher rates than main bank client …rms after the onset of …nancial distress. On the other hand, the standard deviation of the growth rate of assets for independent …rms is always higher than that for main bank …rms, which is similar to the above results with respect to the operating performance.
Panel B reports the results from the same analysis for the post-deregulation period. Assets decrease substantially from t to t+1 (median -3.6%) and from t+1 to t+2 (median -2.0%), thereafter increase slightly from t+2 to t+3
(me-dian 0.4%). It follows from this that …rms downsize their assets in response to poor performance in the post-deregulation period more than in the pre-deregulation period. In contrast to the result for the pre-pre-deregulation period, independent …rms downsize their assets more than main bank client …rms in the post-deregulation period, although the di¤erence is not signi…cant.
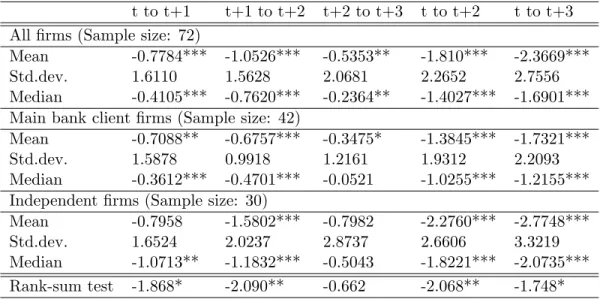
Table 4-3 and 4-4 report the percentage changes in employees and the changes in labor cost as a percentage of sales, respectively. Panels A of Ta-ble 4-3 and 4-4 show that …nancially distressed …rms experience substantial layo¤s and labor cost reductions in the pre-deregulation period. Employ-ment falls signi…cantly from t to t+1 (median -4.5%) and from t+1 to t+2 (median -4.2%), and thereafter increases slightly from t+2 to t+3 (median 0.7%). The labor cost over sales also declines over the entire period: from t to t+1 (median -0.4%), from t+1 to t+2 (median -0.7%) and from t+2 to t+3 (median -0.2%). Our striking result is that independent …rms curtail labor cost by reducing employees and/or compensations more than main bank client …rms in the pre-deregulation period. The Wilcoxon rank-sum test indicates that the di¤erence in median labor cost between main bank client …rms and independent …rms is signi…cant over the period from t to t+3.
On the contrary, Panels B of Table 4-3 and 4-4 show that there is no such substantial di¤erence in layo¤s and retrenchment between main bank clients and independents for the post-deregulation period. Just after the onset of …nancial distress (from t to t+1), independent …rms cut down on labor cost and lay o¤ employees more than main bank …rms; while during the period from t+1 to t+2, main banks reduce employees and labor cost more than independent …rms. The evidence that independent …rms retrench more than main bank client …rms is no longer seen in the post-deregulation period.
Table 4-5 reports the changes in operating expenses as a percentage of sales. Similar to the results obtained above, Panel A shows that indepen-dent …rms retrench operating expenses signi…cantly more than main bank …rms for two and three years after the onset of …nancial distress in the pre-deregulation period. Moreover, Panel B of Table 4-5 indicates that this di¤erence in median operating expenses between main bank client …rms and independent …rms is still signi…cant in the post-deregulation period as well.
4.3 E¤ect of Capital and Ownership Structure
In the previous section, we …nd that independent …rms had larger improve-ment in performance and larger reductions in labor cost and operating
ex-penses than main bank client …rms during and after …nancial distress, es-pecially for the pre-deregulation period. However, close bank ties are not the only di¤erence in the …nancial structure that could a¤ect their ability to work out of distress. To address this issue, we conduct regression analyses to control for other factors that could a¤ect corporate restructuring and sub-sequent operating performance. Speci…cally, we include several measures of the capital and ownership structure in the dependent variables of our regres-sions to examine corporate governance mechanisms for …nancially distressed …rms.10
The …rst independent variable is the main bank dummy that equals to one if a particular …rm is a main bank client …rm and zero otherwise. The second variable is the bank loan ratio (bank loans over debt). As discussed earlier, the conventional view stresses that the close bank ties enable main banks to engage in stringent monitoring for client …rms and promote e¢ cient management of the …rms. Here, however, we argue that the close bank ties, when accompanied by the bail-out guarantee, generate the moral hazard problem which discourages …rm managers from reducing operational expenses and disturbs quick recovery of corporate performance. We expect negative e¤ects of these variables on corporate restructuring and performance.
The third variable is the leverage ratio (the ratio of debt to assets). Debt can have both positive and negative e¤ects on corporate restructuring and …rm value. Myers (1977) demonstrates that ‘too much’ debt induces …rm managers acting in the interests of shareholders to forego positive net present value projections (the underinvestment problem).11 On the other hand, the overinvestment problem, maintained by Jensen (1986), can be curtailed if managers are forced to put our excess funds to serve debt. With regard to the e¤ect of debt on corporate restructuring, Jensen (1989) argues that highly-leveraged …rms respond quickly to the performance declines in order to prevent default. On the contrary, if most of debt comprises bank loans, the positive e¤ect of debt on restructuring may be o¤set by the moral hazard e¤ect due to the ever-lasting support by banks. Hence, we do not make any predictions on the coe¢ cient of this variable.
The fourth through sixth independent variables are measures of own-ership structure: the equity ownown-ership shares by banks, large shareholders
1 0We do not examine the e¤ect of managerial ownership since there are no …rms with
managerial stock ownership in the pre-deregulation period and very few …rms in the post-deregulation period in our sample.
1 1
The underinvestment problem can be mitigated, however, if main banks, as equity holders of their client …rms, re…nance the debt.
and foreign investors. Bank ownership is generally regarded as a measure of close bank ties. According to the conventional view, the simultaneous ownership of debt and equity claims by banks can be bene…cial for client …rms if it alleviates potential con‡icts of interests between creditors and equity holders, thereby improving …rm value (Jensen and Meckling (1976), Myers (1977), Stultz (1988)). However, we regard the close bank ties as a device to discourage …rm managers from having su¢ cient budget cuts and hamper improvement in performance. Hence, we expect a negative e¤ect of this variable on corporate performance and restructuring.
Shleifer and Vishny (1997) argue that since large shareholders are able to govern by exercising their voting rights, generally they have incentives to monitor management to enhance …rm value. It is argued, however, that the cross-shareholdings among companies, banks and other …nancial institutions in Japan may not have functioned to induce large shareholders to play such a disciplinary role. Nakatani (1984) describes the corporate group and related cross-shareholdings as a shock-absorbing, "mutual insurance" arrangement in which …rms can maintain more stable corporate performance over time rather than higher pro…tability. Most CEOs have placed shareholders in importance after employees, customers and banks for a long time. Hence, we expect a negative e¤ect of this variable on corporate restructuring and performance.
The literature on corporate governance has not so far explored the e¤ect of foreign ownership on corporate restructuring and performance. In spite of being small shareholders, foreign investors may have a considerable in‡u-ence on the decisions of corporate restructuring since they demand to have a return on their investment more than the silent majority of large share-holders that have long-term relationships with the …rms. Hence, we expect a positive e¤ect of this variable on corporate restructuring and performance. Table 5-1 reports a series of regressions where the dependent variable is the changes in operating performance. In the equations 5 and 6, we regress changes in operating performance over the periods from t to t+2 and t to t+3 against the measures of the capital and ownership structure at t-1 for the pre-deregulation period. We use the variables at the time before the onset of distress (period t-1) as independent variables to avoid the simultaneity problem. The only variable that enters the regressions signi…cantly is the main bank dummy. This suggests that main bank client …rms improve their operating performance signi…cantly less than independent …rms in the pre-deregulation period. In contrast, the equations 7 and 8 show that the main bank dummy is not signi…cant for the post-deregulation period and the signs of the coe¢ cients are not stable.
The regression results for the post-deregulation period (equations 7 and 8) also reveal the positive and signi…cant relation between the foreign owner-ship share and the change in operating performance. The main bank dummy is no longer signi…cant for the post-deregulaion period. The coe¢ cients of the bank ownership share and the ownership by large shareholders are neg-ative and signi…cant in the equation 8. These results apparently contradict the conventional view that close bank ties and large shareholders contribute to e¢ cient management. Rather, they seem consistent with our hypothesis that …rm managers shirk to downsize …rm organizations and reduce oper-ational costs by relying on the …nancial support from banks and on the infeasibility of takeovers and public protests for control due to the mutual shareholding among corporations.
We then test whether close bank ties and large shareholder ownership interfere with corporate restructuring. We restrict our regressions to those in which dependent variables are the changes in labor cost and the changes in operating expenses because, as in Table 3, these cost reductions signi…cantly contribute to improvement in performance. Table 5-2 reports the regression results where the dependent variable is the changes in labor cost. The equations 9 and 10 show that the main bank dummy and the bank loan ratio is positively related to the changes in labor cost in the pre-deregulation period. In contrast, in the equation 11 for the post-deregulation period, the coe¢ cient of the main bank dummy is not signi…cant, while that of foreign ownership is negative and signi…cant at 10% level. The coe¢ cients of the bank ownership share and the ownership share by large shareholders are positive and signi…cant in the equation 12. These results suggest that close bank ties, represented by bank-related variables, and the corporate shareholdings, measured by large shareholder ownership, discourage …rms from cutting down on labor cost.
Table 5-3 reports the result from the regressions where the dependent variable is the changes in operating expenses. Similar to the results in Table 5-2, the equation 13 shows the changes in operating expenses are positively related to the main bank dummy and the bank loan ratio for the pre-deregulation period. Moreover, the coe¢ cients of the main bank dummy and the leverage ratio are positive and signi…cant for the post-deregulation period, as the equation 15 shows. The foreign ownership share is negatively correlated with the changes in operating expenses for the post-deregulation period in both equations 15 and 16.
So far we have seen that main bank client …rms cut down on operational cost and improved corporate performance signi…cantly less than the …rms without close bank ties in the pre-deregulation period, while the di¤erence
between the two groups almost disappeared in the post-deregulation period. The former …nding is consistent with our moral hazard hypothesis. With regard to the latter …nding, the main reason may be that main bank client …rms no longer believed in the implicit bail-out guarantee, partly because their main banks could not a¤ord to commit themselves to prop up client …rms.
Overall, the bank-related variables, such as the bank loan ratios and the bank ownership share, have negative e¤ects on cost reductions and subse-quent improvement of performance. In contrast, the high foreign ownership share led …rm managers to curtail operational costs and achieve quick re-covery of performance in the 1990s.
Another striking result from these regressions is a sharp contrast in the e¤ect of equity ownership on corporate restructuring and performance be-tween the pre- and the post-deregulation periods. Since the 1990s, the distri-bution of equity claims has played a signi…cant role on corporate governance for the …rms in …nancial distress.
5
Conclusion
In this paper, we argue that the bank-led rescues of distressed …rms in the heyday of the main bank system was ine¢ cient due to the moral hazard problem. To support this view, we show evidence that main bank client …rms in …nancial distress retrenched signi…cantly less than the …rms with-out close bank ties during the period before the …nancial deregulation of the 1980s. We also …nd that the corporate performance of the main bank client …rms improved markedly less after the onset of distress than the downsiz-ing independent …rms. Furthermore, we discover that such di¤erences in retrenchment and improvement in corporate performance after the onset of …nancial distress between main bank client …rms and independent …rms disappeared in the 1990s.
We then examine whether the decisions of corporate restructuring are in‡uenced by capital and ownership structure. We document that ownership structure, especially the equity ownership by foreign investors, gained im-portance in corporate restructuring and subsequent operating performance in the 1990s. We should not overlook that, in spite of being small sharehold-ers, foreign investors play more signi…cant roles in corporate governance for …nancially distressed …rms than the silent majority of large investors such as …nancial institutions and domestic corporate shareholders.
References
[1] Aoki, M., 1988. Information, Incentives, and Bargaining in the Japanese Economy (Cambridge University Press, New York).
[2] Aoki, M., 1994. Monitoring characteristics of the main bank system: an analytical and developmental view. in Aoki, M., Patrick, H., (eds.)
The Japanese main bank system (Oxford University Press).
[3] Asquith, P., Gertner, R., Scharfstein, D., 1994. Anatomy of …nancial distress: an examination of junk-bond issuers. Quarterly Journal of Economics 625-658.
[4] Barber, B.M., Lyon, J.D., 1996. Detecting abnormal operating perfor-mance: the empirical power and speci…cation of test statistics.Journal of Financial Economics 359-400.
[5] Brockner, J., 1988. The e¤ect of work layo¤s on survivors: research, theory and practice. in Shaw, B.M., Cummings, L.L., (eds.) Research in organizational behavior. Vol. 10, Greenwich, CT.
[6] Caves, R., Uekusa, M., 1976. Industrial organization of Japan (Brook-ings Institution, Washington D.C.)
[7] Demsetz, H., Lehn, K., 1985. The structure of corporate ownership: causes and consequences. Journal of Political Economy 93, 1155-1177. [8] Diamond, D.W., 1984. Financial intermediation and delegated
moni-toring. Review of Financial Studies 393-414.
[9] Espahbodi, R., John, T.A., Vasudevan, G., 2000. The e¤ect of down-sizing on operating performance. Review of Quantitative Finance and Accounting 15, 107-126.
[10] Fazzari, S., Hubbard, R.G., Petersen, B., 1988. Financing constraints and corporate investment. Brookings Papers on Economic Activity
19,141-195.
[11] Fukao, M., 1999.Introduction to Corporate Governance. Chikuma Shin-sho (in Japanese).
[12] Gomes, J.F., 2001. Financial investment. American Economic Review
[13] Hall, B.J., Weinstein, D.E., 2000. Main banks, creditor concentration, and the resolution of …nancial distress in Japan. in Aoki, M. and Saxon-house, G., eds.,Finance, governance, and competitive in Japan(Oxford university press) 64-79.
[14] Hanazaki, M., Horiuchi, A., 2000. Is Japan’s …nancial system e¢ cient?
Oxford review of economic policy 16, 2, 61-73.
[15] Hoshi, T., Kashyap, A., 2001. Corporate …nancing and governance in Japan (The MIT press).
[16] Hoshi, T., Kashyap, A., Scharfstein, D., 1990a. Bank monitoring and investment: evidence from changing structure of Japanese corpo-rate banking relationship. in Hubbard, R., (ed.) Asymmetric informa-tion, corporate …nance and investment (University of Chicago Press, Chicago).
[17] Hoshi, T., Kashyap, A., Scharfstein, D., 1990b. The role of banks in reducing the cost of …nancial distress in Japan. Journal of Financial Economics 27, 67-88.
[18] Hoshi, T., Kashyap, A., Scharfstein, D., 1991. Corporate structure, liquidity, and investment. Quarterly Journal of Economics 106, 33-60. [19] Jain, B., Kini, O., 1994. The post-issue operating performance of IPO
…rms. Journal of Finance 1699-1726.
[20] Jensen, M., 1986. Agency costs of free cash ‡ow, corporate …nance and takeovers.American Economic Review 76, 323-329.
[21] Jensen, M., 1989. Eclipse of the public corporation. Harvard Business Review 5,61-74.
[22] John, K., Lang, L.H.P., Netter, J., 1992. The voluntary restructuring of large …rms in response to performance decline. Journal of Finance
47, 891-917.
[23] Jensen, M. and Meckling, W., 1976. Theory of the …rm: managerial behavior, agency costs and ownership structure. Journal of Financial Economics 3, 305-360.
[24] John, K., Ofek, E., 1995. Asset sales and increase in focus. Journal of Financial Economics 37, 105-126.
[25] Kang, J.K., Shivdasani, A., 1995. Firm performance, corporate gov-ernance, and top executive turnover in Japan. Journal of Financial Economics 38, 29-58.
[26] Kang, J.K., Shivdasani, A., 1997. Corporate restructuring during per-formance declines in Japan.Journal of Financial Economics 46, 29-65. [27] Kang, J.K., Shivdasani, A., 1999. Alternative mechanisms for corporate governance in Japan: an analysis of independent and bank-a¢ liated …rms. Paci…c-Basin Fiance Journal 7, 1-22.
[28] Kaplan, S.N., 1989. The e¤ect of management buyouts on operating performance and value. Journal of Financial Economics 217-254. [29] Kaplan, S.N., Minton, B.A., 1994. Appointments of outsiders to
Japanese boards determinations and implications for managers.Journal of Financial Economics 36, 225-258.
[30] Kaplan, S.N., Zingales, L., 1997. Do investment-cash ‡ow sensitivities provide useful measures of …nancing constraints? Quarterly Journal of Economics 169-215.
[31] Kawai, M., Hashimoto, J., Izumida, S., 1996. Japanese …rms in …nancial distress and main banks: analyses of interest-rate premia. Japan and the World Economy 8, 175-194.
[32] McGuire, P.M., 2001. Bank ties and bond market access: evidence on investment-cash ‡ow sensitivity in Japan. University of Michigan, mimeo.
[33] Morck, R., Nakamura, M., 1999. Banks and corporate control in Japan.
Journal of Finance 54, 319-339.
[34] Morck, R., Nakamura, M., Shivdasani, A., 2000. Banks, ownership structure, and …rm value in Japan.Journal of Business 73, 4, 539-567. [35] Myers, S., 1977. Determinants of corporate borrowing. Journal of
Fi-nancial Economics 5, 147-175.
[36] Nakatani, I., 1984. The role of …nancial corporate grouping. in Aoki, M. (ed.) Economic analysis of the Japanese …rm (North-Holland, New York).
[37] Ofek, E., 1993. Capital structure and …rm response to poor perfor-mance: an empirical analysis.Journal of Financial Economics 34, 3-30.
[38] Rajan, R., 1992. Insiders and outsiders: the choice between informed and arm’s length debt. Journal of Finance 47, 1367-1400.
[39] Reeb, D.M. and Kwok, C.C.Y., 2000. Mainbanks and investment e¢ -ciency in …nancial distress. The Journal of Financial Research 13, 4, 395-411.
[40] Sharpe, S., 1990. Asymmetric information, bank lending and implicit contracts: a stylized model of customer relationships. Journal of Fi-nance 45, 1069-1087.
[41] Sheard, P., 1989. The main bank system and corporate monitoring and control in Japan. Journal of Economic Behavior and Organization 11, 399-422.
[42] Shleifer, A., Vishny, R.W., 1986. Large shareholders and corporate con-trol. Journal of Political Economy 95, 461-488.
[43] Shleifer, A., Vishny, R.W., 1997. A survey of corporate governance.
Journal of Finance 52, 737-783.
[44] Stultz, R., 1988. Managerial control of voting rights: …nancing policies and the market for corporate control. Journal of Financial Economics
20, 25-54.
[45] Weinstein, D., Yafeh, Y., 1998. On the cost of a bank-centered …nancial system: evidence from changing main bank relations in Japan.Journal of Finance 53, 635-672.
Table 1. Descriptive statistics
Panel A: The pre-deregulation period
72 …rms Mean Std.dev. Median Min Max
Main bank dummy 0.583 - 1 0 1
Bank loan ratio 43.284 16.246 43.285 0 79.667
Leverage ratio 83.794 9.3758 85.703 42.051 99.162
Bank ownership 24.785 15.245 23.895 1.19 59.55
Large shareholders 51.158 14.986 50.055 22.71 83.78
Foreign ownership 1.844 6.0957 0.155 0 34.67
Panel B: The post-deregulation period
112 …rms Mean Std.dev. Median Min Max
Main bank dummy 0.419 - 0 0 1
Bank loan ratio 33.172 22.173 31.908 0 97.816
Leverage ratio 63.628 19.170 66.624 11.230 129.081
Bank ownership 33.278 16.840 31.535 1.44 77.98
Large shareholders 47.722 13.754 44.905 24.37 86.62
Foreign ownership 3.422 5.748 1.955 0.01 39.33
1) "Main bank dummy" equals to one if a particular …rm is a main bank client …rm and zero otherwise. "Bank loan ratio" is bank loans as a % of debt. "Leverage ratio" is debt as a % of assets. "Bank ownership" is the % ratio of bank ownership. "Large shareholders" is the % ratio of ownership by the 12 largest shareholders. "Foreign ownership" is the % ratio of ownership by foreign investors.
2) The pre-deregulation covers the period in which the …rms become …nancially distressed in any year from 1978 to 1984, while the post-deregulation covers the period in which their …nancial distress starts from 1990 to 1996.
Table 2. Correlation coe¢ cients
Panel A: The pre-deregulation period
72 …rms Main Bank loan Leverage Bank own Large Foreign
Main bank dummy 1
Bank loan ratio 0.092 1
Leverage ratio 0.194 0.212 1
Bank ownership 0.200 0.500 0.043 1
Large shareholders -0.068 -0.269 0.291 -0.549 1
Foreign ownership -0.058 -0.041 0.018 -0.048 0.245 1
Panel B: The post-deregulation period
112 …rms Main Bank loan Leverage Bank own Large Foreign
Main bank dummy 1
Bank loan ratio 0.234 1
Leverage ratio 0.381 0.668 1
Bank ownership 0.033 -0.205 -0.054 1
Large shareholders 0.057 0.123 -0.036 -0.667 1
Foreign ownership -0.006 -0.184 -0.128 0.169 0.046 1
1) "Main bank dummy" equals to one if a particular …rm is a main bank client …rm and zero otherwise. "Bank loan ratio" is bank loans as a % of debt. "Leverage ratio" is debt as a % of assets. "Bank ownership" is the % ratio of bank ownership. "Large shareholders" is the % ratio of ownership by the 12 largest shareholders."Foreign ownership" is the % ratio of ownership by foreign investors.
2) The pre-deregulation covers the period in which the …rms become …nancially distressed in any year from 1978 to 1984, while the post-deregulation covers the period in which their …nancial distress starts from 1990 to 1996.
Table 3. Changes in operating performance
Panel A: The pre-deregulation period (t is any year from 1978 to 1984)
Equation 1 t to t+2 Equation 2 t to t+3 Const. 2.3759 Const. 4.0234 (5.92)*** (3.37)*** Chanasset 0.0335 Chanasset 0.0221 (t to t+1) (6.45)*** (t to t+2) (1.18) Chanemploy -0.0216 Chanemploy -0.0485 (t to t+1) (-0.97) (t to t+2) (-0.94) Chanlaborcost -1.2660 Chanlaborcost -0.2671 (t to t+1) (-5.16)*** (t to t+2) (3.37)*** Chanoperating -0.1481 Chanoperating -0.1257 (t to t+1) (-2.20)** (t to t+2) (-2.39)** P seudo R2 0.1513 P seudo R2 0.0956
No. of obs. 72 No. of obs. 72
Panel B: The post-deregulation period (t is any year from 1990 to 1996)
Equation 3 t to t+2 Equation 4 t to t+3 Const. 1.7317 Const. 3.1974 (5.14)*** (7.11)*** Chanasset 0.0440 Chanasset 0.0184 (t to t+1) (1.90)* (t to t+2) (0.85) Chanemploy -0.0373 Chanemploy -0.0640 (t to t+1) (-1.36) (t to t+2) (-1.24) Chanlaborcost -0.7054 Chanlaborcost -0.2137 (t to t+1) (-4.54)*** (t to t+2) (-1.63)* Chanoperating -0.4148 Chanoperating -0.3420 (t to t+1) (-3.05)*** (t to t+2) (-3.80)*** P seudo R2 0.2003 P seudo R2 0.1557
No. of obs. 111 No. of obs. 111
1) The dependent variable is the change in ordinary income as a % of the lagged assets. "Chanasset" is the % change in assets. "Chanemploy" is the % change in the number of employees. "Chanlaborcost" is the change in labor cost as a % of assets.
"Chanoperating" is the change in operating expenses as a % of sales. 2) Numbers in parentheses denote t-statistics. Asterisks *, ** and *** denote signi…cance at the 10%, 5% and 1% level, respectively.
Table 4-1. Changes in operating performance
Panel A: The pre-deregulation period (t is any year from 1978 to 1984)
t to t+2 t to t+3 t to t+4
All …rms (Sample size: 72)
Mean 4.1613*** 6.6859*** 7.0483***
Std.dev. 6.7050 5.8880 6.3731
Median 3.9426*** 5.3805*** 6.0443***
Main bank …rms (Sample size: 42)
Mean 3.1014*** 5.7850*** 5.8780***
Std.dev. 3.6736 4.5047 4.2977
Median 2.0215*** 4.9475*** 4.8116***
Independent …rms (Sample size: 30)
Mean 5.6452*** 7.9470*** 8.6868***
Std.dev. 9.3328 7.3053 8.2805
Median 5.6290*** 7.8723*** 8.6933***
Rank-sum test 1.171* 2.074** 2.311***
Panel B: The post-deregulation period (t is any year from 1990 to 1996)
t to t+2 t to t+3 t to t+4
All …rms (Sample size: 112)
Mean 2.3731*** 4.5170*** 4.9780***
Std.dev. 3.4273 3.5669 3.9155
Median 2.0465*** 3.5129*** 3.9788***
Main bank client …rms (Sample size: 47)
Mean 2.1937*** 3.6853*** 3.9411***
Std.dev. 2.5514 2.5793 2.5753
Median 2.3422*** 2.8904*** 3.3939***
Independent …rms (Sample size: 65)
Mean 2.5028*** 5.1184*** 5.717***
Std.dev. 3.9564 4.0505 4.5253
Median 1.7915*** 3.8646*** 4.7811***
Rank-sum test -0.097 1.624* 2.497***
1) Signi…cance levels for di¤erence in median between main bank client …rms and independent …rms are based on Wilcoxon rank-sum tests (Z-statistics are displayed); those for di¤erence from zero are based on t-tests for mean and on Wilcoxon signed-rank t-tests for median.
2) *, ** and *** denote signi…cance at the 10%, 5% and 1% level, respectively. No asterisks mean that the null hypothesis is not rejected.
Table 4-2. Percentage changes in assets
Panel A: The pre-deregulation period (t is any year from 1978 to 1984) t to t+1 t+1 to t+2 t+2 to t+3 t to t+2 t to t+3 All …rms (Sample size: 72)
Mean 4.4996 2.4796 5.6465*** 7.4331 14.8401**
Std.dev. 36.4713 14.0661 15.9679 41.7885 56.1768
Median -1.0293 1.7517 3.0796*** 1.7226 4.8768
Main bank client …rms (Sample size: 42)
Mean -0.6312 1.8198 3.0313 1.0995 3.9841
Std.dev. 10.6688 11.8377 12.1260 14.7874 19.1480
Median -1.0293 1.4546 2.5815 1.3386 1.3742
Independent …rms (Sample size: 30)
Mean 11.6826 3.4032 9.3078** 16.3002 30.0385*
Std.dev. 54.8103 16.8752 19.8139 61.8610 82.4522
Median -0.5879 3.1706 4.2796*** 4.6753 9.4665**
Rank-sum test 0.137 0.777 1.291 0.560 1.382
Panel B: The post-deregulation period (t is any year from 1990 to 1996) t to t+1 t+1 to t+2 t+2 to t+3 t to t+2 t to t+3 All …rms (Sample size: 112)
Mean -3.2480*** -1.4509* 1.4855** -4.4391*** -2.8279
Std.dev. 10.3956 9.0780 7.8312 15.3157 19.1535
Median -3.6291*** -1.9831*** 0.3894 -5.6014*** -6.1878**
Main bank client …rms (Sample size: 47)
Mean -4.2708*** -0.6394 0.6656 -4.8296*** -4.1880**
Std.dev. 5.4908 8.1473 5.1415 10.004 11.3370
Median -4.0460*** -1.6318* 0.5292 -5.0983*** -4.540***
Independent …rms (Sample size: 65)
Mean -2.5084 -2.0376* 2.0783* -4.1567* -1.8443
Std.dev. 12.8234 9.7154 9.3014 18.2948 23.2710
Median -3.5805*** -2.5498** 0.1421 -6.2026*** -6.4722**
Rank-sum test 0.610 -0.404 0.168 -0.198 -0.150
1) Signi…cance levels for di¤erence in median between main bank client …rms and independent …rms are based on Wilcoxon rank-sum tests (Z-statistics are displayed); those for di¤erence from zero are based on t-tests for mean and on Wilcoxon signed-rank t-tests for median.
2) *, ** and *** denote signi…cance at the 10%, 5% and 1% level, respectively. No asterisks mean that the null hypothesis is not rejected.
Table 4-3. Percentage changes in employees
Panel A: The pre-deregulation period (t is any year from 1978 to 1984)
t to t+1 t+1 to t+2 t+2 to t+3 t to t+2 t to t+3
All …rms (Sample size: 72)
Mean -7.1029*** -7.9684*** -0.9268 -14.5687*** -14.9990***
Std.dev. 16.6654 13.9039 13.9062 21.7830 22.4134
Median -4.5207*** -4.2489*** -0.7418* -10.8817*** -12.8443***
Main bank client …rms (Sample size: 42)
Mean -9.4472*** -6.8589*** 0.5505 -14.8466*** -14.7487***
Std.dev. 10.6396 12.3828 17.0987 14.8148 19.9754
Median -5.0956*** -4.2423*** 0.2415 -11.2432*** -12.8443***
Independent …rms (Sample size: 30)
Mean -5.8209** -9.5217*** -2.9951** -14.2598*** -15.3493***
Std.dev. 22.3793 15.8820 7.2470 29.1095 25.7987
Median -5.6455*** -5.0880*** -2.2718** -12.8130*** -14.1301***
Rank-sum test -0.565 -0.971 -2.364** -0.263 -0.445
Panel B: The post-deregulation period (t is any year from 1990 to 1996)
t to t+1 t+1 to t+2 t+2 to t+3 t to t+2 t to t+3
All …rms (Sample size: 112)
Mean -6.1449*** -7.2690*** -4.5697*** -12.9318*** -16.7090***
Std.dev. 9.5365 9.0301 6.4352 12.3598 14.2849
Median -4.5811*** -5.0430*** -3.9031*** -11.6358*** -15.8059***
Main bank client …rms (Sample size: 47)
Mean -5.2850*** -6.0822*** -5.2875*** -10.9844*** -15.5083***
Std.dev. 5.4677 9.5065 6.3415 11.0705 13.2823
Median -4.2910*** -5.7039*** -4.5297*** -11.0582*** -15.6983***
Independent …rms (Sample size: 65)
Mean -6.7666*** -8.1273*** -4.0507*** -14.3399*** -17.5771***
Std.dev. 11.6323 8.6422 6.5013 13.1173 15.0097
Median -5.0131*** -4.8929*** -3.1818*** -12.0395*** -16.2347***
Rank-sum test -1.200 0.003 2.208** -1.094 -0.569
1) Signi…cance levels for di¤erence in median between main bank client …rms and independent …rms are based on Wilcoxon rank-sum tests (Z-statistics are displayed); those for di¤erence from zero are based on t-tests for mean and on Wilcoxon signed-rank t-tests for median.
2) *, ** and *** denote signi…cance at the 10%, 5% and 1% level, respectively. No asterisks mean that the null hypothesis is not rejected.
Table 4-4. Changes in labor cost as a percentage of sales
Panel A: The pre-deregulation period (t is any year from 1978 to 1984)
t to t+1 t+1 to t+2 t+2 to t+3 t to t+2 t to t+3 All …rms (Sample size: 72)
Mean -0.7784*** -1.0526*** -0.5353** -1.810*** -2.3669***
Std.dev. 1.6110 1.5628 2.0681 2.2652 2.7556
Median -0.4105*** -0.7620*** -0.2364** -1.4027*** -1.6901***
Main bank client …rms (Sample size: 42)
Mean -0.7088** -0.6757*** -0.3475* -1.3845*** -1.7321***
Std.dev. 1.5878 0.9918 1.2161 1.9312 2.2093
Median -0.3612*** -0.4701*** -0.0521 -1.0255*** -1.2155***
Independent …rms (Sample size: 30)
Mean -0.7958 -1.5802*** -0.7982 -2.2760*** -2.7748***
Std.dev. 1.6524 2.0237 2.8737 2.6606 3.3219
Median -1.0713** -1.1832*** -0.5043 -1.8221*** -2.0735***
Rank-sum test -1.868* -2.090** -0.662 -2.068** -1.748*
Panel B: The post-deregulation period (t is any year from 1990 to 1996) t to t+1 t+1 to t+2 t+2 to t+3 t to t+2 t to t+3 All …rms (Sample size: 111)
Mean -0.2490 -1.2244*** -0.9372*** -1.4735*** -2.4108***
Std.dev. 2.0489 2.4502 2.0492 2.9081 3.4339
Median -0.0584 -0.7849*** -0.6778*** -0.7900*** -1.6007***
Main bank client …rms (Sample size: 47)
Mean -0.2933 -1.0398*** -0.5770*** -1.3325*** -1.9096***
Std.dev. 1.5626 1.7091 1.3612 2.4883 3.0174
Median -0.0084 -0.9999*** -0.5449*** -0.8502*** -1.1863***
Independent …rms (Sample size: 64)
Mean 0.2166 -1.3604*** -1.2017*** -1.5770*** -2.7788***
Std.dev. 2.3547 2.8819 2.4107 3.1889 3.6900
Median -0.0946 -0.5440*** -0.9190*** -0.7389*** -1.6473***
Rank-sum test -0.101 0.477 -1.194 0.161 -1.074
1) Signi…cance levels for di¤erence in median between main bank client …rms and independent …rms are based on Wilcoxon rank-sum tests (Z-statistics are displayed); those for di¤erence from zero are based on t-tests for mean and on Wilcoxon signed-rank t-tests for median.
2) *, ** and *** denote signi…cance at the 10%, 5% and 1% level, respectively. No asterisks mean that the null hypothesis is not rejected.
Table 4-5. Changes in operating expenses as a percentage of sales Panel A: The pre-deregulation period (t is any year from 1978 to 1984)
t to t+1 t+1 to t+2 t+2 to t+3 t to t+2 t to t+3 All …rms (Sample size: 72)
Mean -0.1718 -0.4226* 0.1464 -0.5945** -0.4480
Std.dev. 1.5654 1.9589 1.9703 2.4750 3.2279
Median -1.8748 -0.0752 0.3438 -0.2595* -0.1495
Main bank client …rms (Sample size: 42)
Mean 0.0956 -0.25517 0.4869 -0.1594 0.3275
Std.dev. 1.1053 1.4516 1.9640 1.6857 2.7566
Median 0.1448 -0.0628 0.5130** -0.1133 0.0975
Independent …rms (Sample size: 30)
Mean -0.5463* -0.6572 -0.3301 -1.2035** -1.5337**
Std.dev. 1.7200 2.5137 1.9099 3.2129 3.5603
Median -0.4705** -0.0980 -0.1101 -0.7910*** -0.5656**
Rank-sum test -2.376** -0.366 -1.542* -2.125*** -2.501**
Panel B: The post-deregulation period (t is any year from 1990 to 1996) t to t+1 t+1 to t+2 t+2 to t+3 t to t+2 t to t+3 All …rms (Sample size: 112)
Mean -0.1875 -1.1521*** -0.8650*** -1.3397*** -2.2047***
Std.dev. 2.4765 2.4112 1.9682 4.0286 4.5220
Median 0.0990*** -0.6961*** -0.6547*** -0.6500*** -1.1737
Main bank client …rms (Sample size: 47)
Mean 0.0900 -0.6130*** -0.4573*** -0.5230 -0.9803**
Std.dev. 1.4903 1.3893 1.0514 2.3069 2.5145
Median 0.2706 -0.4719 -0.2579 -0.1887 -0.4078
Independent …rms (Sample size: 65)
Mean -0.3882 -1.5420*** -1.1598*** -1.9302*** -3.0900***
Std.dev. 2.9905 2.8858 2.3904 4.8455 5.3873
Median -0.4261 -0.7784 -0.8090 -0.9421 -1.9915
Rank-sum test -1.618* -1.442 -1.406 -1.949* -2.974***
1) Signi…cance levels for di¤erence in median between main bank client …rms and independent …rms are based on Wilcoxon rank-sum tests (Z-statistics are displayed); those for di¤erence from zero are based on t-tests for mean and on Wilcoxon signed-rank t-tests for median.
2) *, ** and *** denote signi…cance at the 10%, 5% and 1% level, respectively. No asterisks mean that the null hypothesis is not rejected.
Table 5-1. Changes in operating performance
Pre-deregulation Post-deregulation Equation 5 Equation 6 Equation 7 Equation 8
t to t+2 t to t+3 t to t+2 t to t+3 Const. 8.0300 17.8172 2.9122 8.3696 (1.50) (2.83)*** (1.53) (5.16)*** Mainbank -0.4119 -0.7603 0.6626 -0.1132 (at t-1) (-1.61)* (-1.87)* (1.29) (-0.25) Bankloan -0.0345 -0.0483 -0.0146 -0.0027 (at t-1) (-0.80) (-0.89) (-1.00) (-0.22) Leverage -0.0498 -0.0938 -0.0072 -0.0122 (at t-1) (-0.71) (-1.09) (-0.42) (-0.83) Bankowner -0.0058 -0.0854 -0.0066 -0.0645 (at t-1) (-0.11) (-1.34) (-0.34) (-3.80)*** Large 0.0007 0.0049 -0.0039 -0.0451 (at t-1) (0.01) (0.08) (-0.17) (-2.21)** Foreignowner 0.0812 -0.0888 0.0799 0.0843 (at t-1) (0.97) (-0.85) (2.31)** (2.52)** P seudo R2 0.0447 0.1215 0.055 0.076 No. of obs. 72 72 112 112
1) The dependent variable is the change in ordinary income as a % of the lagged assets.
2) "Mainbank" is the main bank dummy (1=main bank client …rms, 0=independent …rms). "Bankloan" is the ratio of bank loans to debt. "Leverage" is the ratio of debt to assets. "Bankowner" is the
ownership share by banks. "Large" is the ownership share by the 12 largest shareholders. "Foreignowner" is the ownership share by foreign investors.
3) Numbers in parentheses denote t-statistics. Asterisks *, ** and *** denote signi…cance at the 10%, 5% and 1% level, respectively.
4) The pre-deregulation covers the period in which t is any year from 1978 to 1984, while the post-deregulation covers the period in which t is any year from 1990 to 1996.
5) Median regressions are conducted to take into account the skewness of accounting data and the existence of extreme observations.
Table 5-2. Changes in labor cost as a percentage of sales
Pre-deregulation Post-deregulation
Equation 9 Equation 10 Equation 11 Equation 12
t to t+1 t to t+2 t to t+1 t to t+2 Const. -1.2433 -5.0914 -0.4325 -4.4532 (-1.22) (-2.13)** (-0.33) (-3.29)*** Mainbank 0.2401 0.5235 -0.1244 -0.4200 (at t-1) (1.78)* (1.93)* (-0.35) (-1.16) Bankloan 0.0190 0.0247 -0.0011 0.0016 (at t-1) (2.58)** (1.10) (-0.12) (0.16) Leverage 0.0002 0.0062 0.0097 0.0094 (at t-1) (0.02) (0.19) (0.84) (0.78) Bankowner -0.0213 0.0096 -0.0008 0.0240 (at t-1) (-2.20) (0.37) (-0.06) (1.74)* Large 0.0103 0.0280 -0.0017 0.0488 (at t-1) (1.09) (0.90) (-0.10) (2.88)** Foreignowner -0.0024 -0.0340 -0.0609 -0.0810 (at t-1) (-0.16) (-0.79) (-1.84)* (-1.19) P seudo R2 0.0568 0.0972 0.0125 0.026 No. of obs. 72 72 111 111
1) The dependent variable is the change in labor cost as a % of sales. 2) "Mainbank" is the main bank dummy (1=main bank client …rms, 0=independent …rms). "Bankloan" is the ratio of bank loans to debt. "Leverage" is the ratio of debt to assets. "Bankowner" is the
ownership share by banks. "Large" is the ownership share by the 12 largest shareholders. "Foreignowner" is the ownership share by foreign investors.
3) Numbers in parentheses denote t-statistics. Asterisks *, ** and *** denote signi…cance at the 10%, 5% and 1% level, respectively.
4) The pre-deregulation covers the period in which t is any year from 1978 to 1984, while the post-deregulation covers the period in which t is any year from 1990 to 1996.
5) Median regressions are conducted to take into account the skewness of accounting data and the existence of extreme observations.
Table 5-3. Changes in operating expenses as a percentage of sales
Pre-deregulation Post-deregulation
Equation 13 Equation 14 Equation 15 Equation 16
t to t+1 t to t+2 t to t+1 t to t+2 Const. -0.8343 -2.3318 -2.2950 -3.8043 (-0.61) (-1.14) (-2.28)** (1.77)* Mainbank 0.8302 0.5582 0.52013 0.3882 (at t-1) (2.34)** (1.27) (1.88)* (0.64) Bankloan 0.0205 0.0085 0.0031 0.0007 (at t-1) (1.68)* (0.56) (0.41) (0.05) Leverage -0.0011 0.0238 0.0176 0.0301 (at t-1) (-0.06) (0.93) (1.97)* (1.49) Bankowner -0.0208 -0.0161 -0.0062 0.0055 (at t-1) (-1.37) (-0.86) (-0.61) (0.25) Large -0.0007 -0.0036 0.0196 0.0239 (at t-1) (-0.05) (-0.19) (1.58) (0.89) Foreignowner 0.0067 -0.0420 -0.0504 -0.0594 (at t-1) (0.28) (-1.39) (-2.75)*** (-1.86)* P seudo R2 0.0771 0.0513 0.0934 0.0720 No. of obs. 72 72 112 112
1) The dependent variable is the change in operating expenses as a % of sales.
2) "Mainbank" is the main bank dummy (1=main bank client …rms, 0=independent …rms). "Bankloan" is the ratio of bank loans to debt. "Leverage" is the ratio of debt to assets. "Bankowner" is the
ownership share by banks. "Large" is the ownership share by the 12 largest shareholders. "Foreignowner" is the ownership share by foreign investors.
3) Numbers in parentheses denote t-statistics. Asterisks *, ** and *** denote signi…cance at the 10%, 5% and 1% level, respectively.
4) The pre-deregulation covers the period in which t is any year from 1978 to 1984, while the post-deregulation covers the period in which t is any year from 1990 to 1996.
5) Median regressions are conducted to take into account the skewness of accounting data and the existence of extreme observations.