A Hybrid Malicious Code Detection Method based on Deep
Learning
Yuancheng Li, Rong Ma and Runhai Jiao
School of Control and Computer Engineering,
North China Electric Power University, Beijing, China
[email protected], [email protected], [email protected]
Abstract
In this paper, we propose a hybrid malicious code detection scheme based on AutoEncoder and DBN (Deep Belief Networks). Firstly, we use the AutoEncoder deep learning method to reduce the dimensionality of data. This could convert complicated high-dimensional data into low dimensional codes with the nonlinear mapping, thereby reducing the dimensionality of data, extracting the main features of the data; then using DBN learning method to detect malicious code. DBN is composed of multilayer Restricted Boltzmann Machines (RBM, Restricted Boltzmann Machine) and a layer of BP neural network. Based on unsupervised training of every layer of RBM, we make the output vector of the last layer of RBM as the input vectors of BP neural network, then conduct supervised training to the BP neural network, finally achieve the optimal hybrid model by fine-tuning the entire network. After inputting testing samples into the hybrid model, the experimental results show that the detection accuracy getting by the hybrid detection method proposed in this paper is higher than that of single DBN. The proposed method reduces the time complexity and has better detection performance.
Keywords: Malicious code Detection, AutoEncoder, DBN, RBM, deep learning
1. Introduction
Malicious code is the software which intentionally damage or destroy the function of system through adding, changing, deleting some code by unauthorized users in normal circumstances. In recent years, malicious code causing far-reaching influence mainly includes: viruses, Worm, Trojan horse, etc. According to the statistical results in [1], in 2010, Symantec recorded more than 3,000,000,000 malicious code attacks, and monitoring more than 280,000,000 independent variant malicious code samples. Compared to 2009, there is growth of 93% for the attack based on the Web. With the increase in the number of malicious code, this shows that the harm and loss is growing. As an important technology of network security, intrusion detection discovers and recognizes intrusion behaviors or attempts in the system through the collection and analysis of key data in the network and computer system. Efficient, accurate identification of malicious code can improve the efficiency of intrusion detection, therefore, malicious code analysis and detection is a key problem in intrusion detection technology.
For detection of malicious code, according to the detected position it is currently divided into two approaches host-based and network-based [2]: Network-based detection methods, including Honeypot-based approach [3-4], and based on Deep packet Inspection [5]; Host-based detection methods, including check sum-based approach [6], signature-based approach [7-9], heuristic data mining approach [10]. The data mining method adopted many machine learning methods, which had an effective detection of unknown malicious code through learning the characteristics of malicious code and the normal code [11] reviewed a variety of feature-extraction methods and machine learning
methods in a variety of malicious code detection applications, including naive Bayes, decision trees, artificial neural networks, Support Vector Machine, etc., [12] proposed a static system call sequences based on N-gram and two automatic feature-selection methods, and adopted K-nearest neighbor algorithm, SVM, decision tree as the classifier. The literature [13] presented a malicious code behavior feature extraction and detection method based on semantics to obtain the behavior of malicious code which has great anti-jamming capabilities.
Although the above methods have achieved certain results in the aspect of malicious code detection, there are still some problems. Such as, feature-extraction is not appropriate, the detection rate and the detection accuracy are not high, and the complexity of the algorithm is high. This paper selects KDDCUP’99 data set as experimental data, and proposes a hybrid malicious code detection model based on deep learning; Based on the AutoEncoder for data dimensionality reduction, this paper proposes to set DBN as a classifier. For the malicious code behavior, using multiple deep learning achieved better effects than surface learning model. Finally, this method improves the malicious code detection rate and detection accuracy, and reduces the time complexity of the hybrid model.
2. Hybrid Malicious Code Detection Model based on Deep Learning
Network data usually contains the normal data and the malicious data. Malicious code detection is to differentiate between the normal data and malicious code data separately, so essentially it belongs to binary classification problems. To get a good performance of the malicious code detection model, there are two aspects of work need to be done: Firstly, finding the essential characteristics of malicious code data; secondly, constructing a good performance of classifier model to accurately differentiate the malicious data from the normal data. In this paper, we make use of the advantages of deep learning, the organic integration of two deep learning methods, AutoEncoder and DBN. This hybrid model extracts the essence of malicious code data, reduces the complexity of the model, and improves the detection accuracy of malicious code.
2. 1 AutoEncoder Dimensionality Reduction
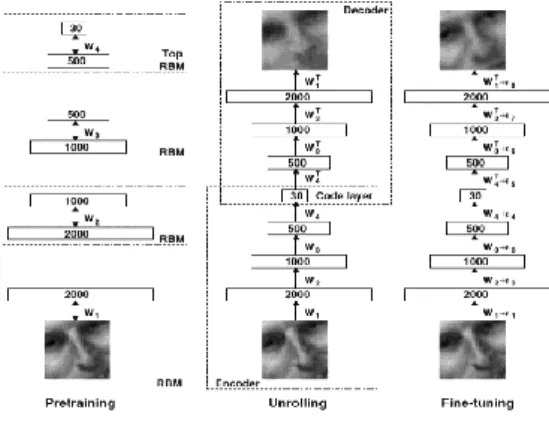
AutoEncoder [14] is a kind of deep learning method for learning efficient code which is proposed by G. E. Hinton in 2006. Through the study of the compression coding of specified set of data, it can achieve the purpose of data dimensionality reduction. AutoEncoder structure is divided into part of encoder and decoder, including input layer, hidden layer, output layer. The cross section between encoder and decoder named code layer is the core of AutoEncoder that can reflect the essential characteristics of high dimensional data set with nested structure, and to set the intrinsic dimensions of high-dimensional data sets. When the number of hidden layer neurons are less than the number of input layer and output layer neurons, we can get the compressed vector of input layer called the data dimensionality reduction.
AutoEncoder consists of three steps, which are pretraining, Unrolling and fine-tuning process [14], as shown in Figure 1.
Figure 1. AutoEncoder Structure
In the pretraining process, we set the output of each RBM hidden layer neuron as the input of the next RBM. RBM consists of the visible units and hidden units. We use the vectorV andHrepresent the visible units and the hidden unit state respectively. The structure is shown in Figure 2.
hi vj Hidden layer unit h Hidden layer unit v weights w
Figure 2. The Network Structure of RBM
Where vi denotes the state of the i visible unit,hj denotes the state of the j
hidden unit, visible and hidden units meet the energy formula (1):
, , i i j j i j ij i V j H i j E v h b v b h v h w
(1)In the process of adjustment of weight training, firstly we update the state of the hidden layer neuron, and then update the state of the visible layer, thus get the adjusting weights. The weight updating rule as shown in formula (2):
1
ij ij ij ij i j i j
w t w t w w t v h v h
(2) Where wij denotes the weight adjustment, w tij( ) denotes the connection
weights(when in step t between the i, j neuron), denotes the learning rate, v hi j
denotes the average
forward correlation (Equal to the output of product of neurons in the hidden and visible neurons), v hi j
denotes the average reverse correlation.
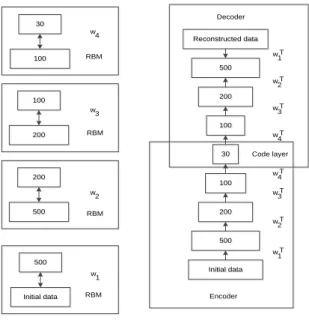
After the pre-training is completed, combining the current RBM output unit with the next RBM input unit as the independent layer. Unrolling process is to connect these independent RBM into a multi-layered AutoEncoder, the Unrolling process as shown in Figure 3.
30 30 100 100 w 4 RBM 500 500 Initial data Initial data w 1 RBM Pretraining 100 100 200 200 w 3 RBM 200 200 500 500 2 w RBM Encoder Reconstructed data Reconstructed data Decoder 500 500 200 200 100 100 30 30 Unrolling 100 100 200 200 500 500 Initial data Initial data Code layer 1 w T 2 w T 4 w T 3 w T 1 w T 2 w T 4 w T 3 w T
Figure 3. The Unrolling Process of AutoEncoder
Fine-tuning process is the process that does the further adjustments to the initial weights after pretraining process to get optimal weights. We mainly use the multiclass cross-entropy error function [15] for evaluation.
The multiclass cross-entropy error function is the difference between the measurement of target probability distribution and the actual probability distribution, that the smaller, the two distributions are similar, and the better. AutoEncoder uses BP algorithm to adjust the weights of the multiclass cross-entropy error function, as shown in formula (3):
ˆ ˆ
[ i ilog i i(1 i) log(1 i)]
H
y y
y y(3) Where yi denotes the characteristics of the data sample values, ˆyi denotes the Characteristics of the data sample after reconstruction.
AutoEncoder adjusts the weights in the fine-tuning process, out layer weight adjustment rules shown as formula (4):
m ij i i j ij H w t y O w (4) Hidden layer weights adjustment rules shown as formula (5):j(1 O ) Oj j m m i m ij j ij i ij i m i m j i i i H H net H w O w net w net H O H O O O net O (5) Where denotes the adjustment step, Oj denotes the upper output neurons.
2. 2 DBN Deep Learning Structure
DBN is a deep learning machine which consists of an unsupervised multi-layer RBM network and a supervised BP network. Each layer unit captures highly relevant implicit correlations from the hidden units of the front layer. The adjacent layers of the DBN can be decomposed into a single limited RBM, shown as Figure 4. In Figure 4, deep belief networks shown as Figure (1), and Figure (2) indicated that the use of each low layer RBM as input data for the training of the next RBM, get a set of RBM by the greedy learning.
RBM
RBM RBM
Figure 4. The RBM Structure and the Corresponding DBN Network
DBN training process is divided into two steps: The first step, train each layer of RBM separately by the unsupervised way; The second step, BP neural network in the last layer of DBN, we set the output vector of the last RBM as the input vector of BP neural network, then do the supervised training to entity relation classifier.
The paper [15] believes that, in the typical DBN which has one hidden layer the relationship between visual layer
v
and hidden layer h can be expressed as formula (6):
2
1 2 2 1 , , , | , l l k k l l k P v h h P h h P h h
(6)As Figure 2 shown, RBM are mutually connected by the visible and the hidden layers. The connection matrix and the biases between the layers are get by unsupervised greedy algorithm. In specific training process, firstly, mapping the visual unit vi to the hidden layer unit hj; then, reversely reconstructing the vi using hj; Repeating this process, and
updating the values of the connection matrix and the biases unless the reconstruction error is acceptable. Associated difference between hidden layer units and visual layer units will form the basis for each weight update. Mapping probability of hidden layer units and visual layer units shown as formula (7) and (8):
1 1| ; I j ij i j i p h v w v a
(7)
1 1| ; I i ij i j j p v h w h b
(8)Where wij denotes the connection weights between the visual layer units and hidden layer units, bi and aj denotes biases respectively, sigmoid function denotes the
incentive function. By using the gradient of the log likelihood probability logp v h
, ;
, we derive the RBM weight update rule, as shown in formula (9):
- mod
ij data i j el i j
w E v h E v h
(9) Where denotes the expectation value, Edata
v hi j denotes the expectation valuedefined in the model. Because Emodel
v hi j is difficult to calculate, we always use theGibbs sampling replace Emodel
v hi j by using the contrast gradient divergencealgorithm which is similar to the gradient. Through a combination of bottom-up RBMs which have carried out massive learnings layer by layer can construct an initial DBN.
Then fine tune the whole DBN from the back to the front by the supervised learning method which is similar to the traditional BP neural network. Finally, we can establish the trained DBN model.
2. 3 Hybrid Malicious Code Detection based on DBN and AutoEncoder
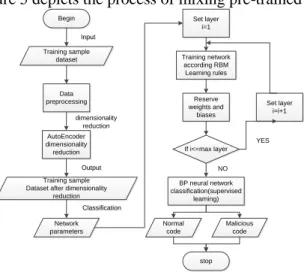
Deep learning has nonlinear mapping of the deep structure with the multilayer which has the benefits complex function can be expressed with fewer parameters. Compared with surface learning, it can realize complex function approximation, and has strong ability for the massed learning of the essential characteristics of data set from a few samples. Based on the above considerations, this paper proposes a hybrid malicious code detection model based on deep learning; Reducing dimensionality of the data by using the AutoEncoder’s space mapping ability of different dimensionality, then abstracting the main characteristics. Based on this, setting DBN as the classifier for several times deep learnings. Then improving the detection accuracy, and reducing the time complexity of the hybrid model. Figure 5 depicts the process of mixing pre-trained detection algorithm.
Begin Data preprocessing AutoEncoder dimensionality reduction stop dimensionality reduction Training sample Dataset after dimensionality
reduction Normal code Malicious code Set layer i=1 Training network according RBM Learning rules Reserve weights and biases If i<=max layer BP neural network classification(supervised learning) Set layer i=i+1 YES NO Output Output Classification Classification Training sample dataset Input Input Network parameters
Figure 5. A DBN Malicious Code Detection Method based on AutoEncoder Dimensionality Reduction
The hybrid detection algorithm is described as follows:
(1) Initialization, input training samples; then digitizing and normalizing the input data; (2) Reducing the dimension, AutoEncoder was used to realize the feature mapping; (3) Input eigenvector with dimensionality reduction, network parameter to initialize DBN classifier;
(4) Set the layer i=1;
(5) Train the network layer by layer according to RBM learning rules, then save the result including the weights and biases;
(6) If i<=max layer, set i=i+1; when i>max layer, do the supervised learning for BP network;
(7) Input the test samples into the trained classifier to detect malicious code and the normal code.
3. Experimental Results and Analysis
3.1 Analysis and Pretreatment of Experimental Data
In this paper, KDDCUP'99 dataset [16] was used to detect malicious code data. They include five categories: probe, UZR (User to Root), RZL (Remote to Local), DoS (Denial-of-Service) as well as Normal data. This paper adopted 10% of the samples of KDDCUP'99 as a dataset, containing a total of 494,021 training data and 311,029 testing
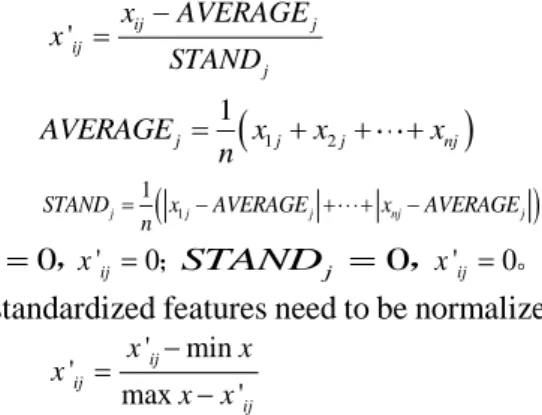
data. In the dataset of KDDCUP'99, each data contains 41 properties. There are two types of data: numerical and character type. For numerical data, we can treat it directly as number; for the character of character data, we can achieve numeric in the standard method of keywords. To eliminate the effects caused by differences of the magnitude, and to reduce the excessive reliance on individual characteristics in the process of classification, we need to normalize data.
Firstly, each feature was standardized according to the formula (10)
'ij ij j j x AVERAGE x STAND (10)
1 2
1 j j j nj AVERAGE x x x n (11)
1
1 j j j nj jSTAND x AVERAGE x AVERAGE
n (12) 0 j AVERAGE ,x'ij 0;STANDj 0,x'ij0。
Secondly, the standardized features need to be normalized, as shown in the formula (13):
' min ' max ' ij ij ij x x x x x (13) Where
x
denotes the value of the original training sample, max (or min) denotes the maximum value for the sample data in the condition of same indicator (or minimum).3.2 Evaluation Index Experimental Results
This paper uses the following indexes to evaluate experimental results, which are TPR (True Positive Rate), FPR (False Positive Rate), Accuracy, CPU time consumption. They are defined as follows:
TPR = the number of correct results of normal code samples/the actual number of normal code samples,
FPR = the number of malicious code samples which are predicted to be normal code/the actual number of malicious code samples.
3.3 Comparison of Experimental Tesults
Experimental test environment: the platform of Intel Core Duo CPU 2.10GHz and 2.00G RAM's, Matlab v7.11. This paper uses 2000 samples extracted from 10% samples in proportion which contain the 141 attacks recorded test data and additional 14 types of experiments. The experiment designed the AutoEncoder which consists of five layers. The numbers of neurons in the previous four-layer network are 41, 300, 150, 75, respectively. Furthermore, the number of neurons in the last layer is variable, which determine the dimension of data number after dimensionality reduction.
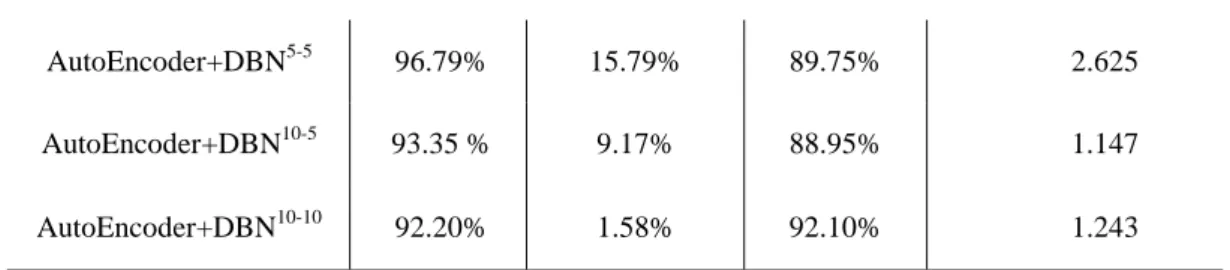
After the pretraining process of the training and testing data, we use AutoEncoder for data dimensionality reduction. Through changing the iterations of the pretraining and fine-tuning, we could get different models, including AutoEncoder + DBN5-5 (pretraining iterations 5 times, fine-tuning5 times); AutoEncoder + DBN10-10 (pre-training iterations 10 times, fine-tuning 10 times); AutoEncoder + DBN10-5 (pre-training iterations 10 times, fine-tuning five times). The detection results of malicious code as shown in Table 1.
Table 1. The Results of the Different Detection Methods
Model TPR FPR Accuracy CPU time(s)
AutoEncoder+DBN5-5 96.79% 15.79% 89.75% 2.625
AutoEncoder+DBN10-5 93.35 % 9.17% 88.95% 1.147
AutoEncoder+DBN10-10 92.20% 1.58% 92.10% 1.243
The experimental results show that with the increase in the number of iterations, in the respect of detection accuracy, the proposed method is superior to the method of single DBN, which was used in the first experiment. Apparently, using AutoEncoder to achieve data dimension reduction is effective, it can improve the detection accuracy, for using AutoEncoder can capture the essential characteristics of date efficiently. Meanwhile, the accuracy of detection (TP) is reduced. Overall, in the respect of prediction accuracy, the mentioned method described in the paper is superior to the single DBN method. It can adapt to the complex environment, achieve effective detection of malicious code, moreover, it consumes less time. Figures 6 and 7 show the error rate in the process of pretraining and fine-tuning. After two iterations, the error rate is maintained at a lower level stably.
1 1.5 2 2.5 3 3.5 4 4.5 5 0 1 2 3 4 5 6 7 8x 10 4 Iteration M e a n S q u a re d E rr o r
Reconstruction Error for RBM pre-training RBM 41-300 RBM 300-150 RBM 150-75 RBM 75-9
Figure 6. RBM Pretraining Reconstruction Error
1 1.5 2 2.5 3 3.5 4 4.5 5 3 3.5 4 4.5 5 5.5 6 6.5 7 Iteration M e a n S q u a re d E rr o r
Reconstruction Error for fine-tuning
Training Testing
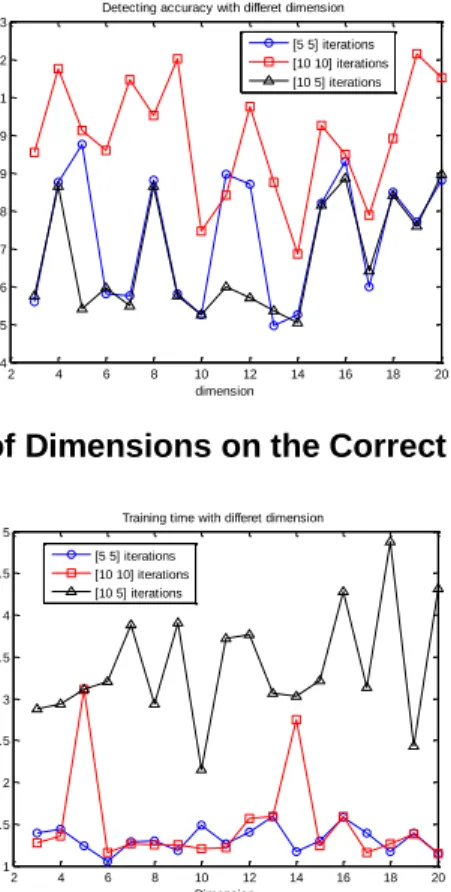
2 4 6 8 10 12 14 16 18 20 0.84 0.85 0.86 0.87 0.88 0.89 0.9 0.91 0.92 0.93 dimension A c c u ra c y
Detecting accuracy with differet dimension [5 5] iterations [10 10] iterations [10 5] iterations
Figure 8. Effect of Dimensions on the Correct Detecting Accuracy
2 4 6 8 10 12 14 16 18 20 1 1.5 2 2.5 3 3.5 4 4.5 5
Training time with differet dimension
Dimension T ra in in g t im e ( in s e c o n d s ) [5 5] iterations [10 10] iterations [10 5] iterations
Figure 9. Effect of Dimensions on the Time Consumption
There are many parameters in the AutoEncoder, such as network structure, output dimension of data after dimensionality reduction, the number of iterations for pretraining and fine-tuning, etc. The output dimension of data after dimensionality reduction is one of the major parameters among them. This paper explores the impact of these parameters on these mentioned methods. Figures 8 and 9 respectively show the effect on the detection accuracy and the time consumption of the method. In figure 8, detection accuracy increases with increasing number of iterations. In Figure 9, with the increase of the number of iterations, CPU time consumption varies, but the dimension and training time consumption have no direct correlation, because AutoEncoder can restore data based on less information loss and error.
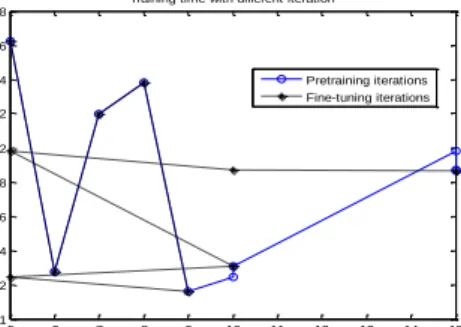
5 6 7 8 9 10 11 12 13 14 15 0.85 0.86 0.87 0.88 0.89 0.9 0.91 0.92 0.93
Detecting accuracy with different iteration
iteration D e te c ti n g a c c u ra c y Pretraining iterations Fine-tuning iterations
Figure 10. The Relations between the Correct Detecting Accuracy and Iterations
5 6 7 8 9 10 11 12 13 14 15 1 1.2 1.4 1.6 1.8 2 2.2 2.4 2.6 2.8
Training time with different iteration
iteration T ra in in g t im e ( in s e c o n d s ) Pretraining iterations Fine-tuning iterations
Figure 11. The Relations between the Time Consumption and Iterations
Figure 10 and Figure 11 show the effect on the detection accuracy of the number of iterations and the time consuming. Figure 10 show that when pretraining iterations increased to 10 times, the detection accuracy reached the highest point. Figure 11 shows that when pretraining iterations increased to 10 times, most of the time consumption is maintained at a low level. Fine-tuning process is to adjust the weights using back-propagation, for low-dimensional data, the network is over-learning. The iterations of fine-tuning do not affect two assessed value directly. AutoEncoder reduces the data dimensions and extracts the main features of data through the nonlinear mapping for complex multidimensional data; this makes the effectiveness of the experiment increased when applying DBN to classify. In short, for the detection of malicious code, the hybrid method mentioned in this paper is apparently superior to the single DBN method in the first experiment on the whole.
4. Conclusion
Against the problem of detecting malicious code, we propose a hybrid method of detecting malicious code based on deep learning, which combines the advantages of AutoEncoder and DBN respectively. Firstly, the method used AutoEncoder for data dimensionality reduction to extract the main feature of data. Then the method uses DBN to detect malicious code. Finally, the experiment was verified by KDDCUP'99 dataset. Experimental results show that compared with the detection method using single DBN, the proposed method improves detection accuracy, while reducing the time complexity of the model. However, in practical application, according to actual situation, the method proposed in this paper needs to have further improvements in order to improve its performance.
Acknowledgements
This work was supported in part by The Fundamental Research Funds for the Central Universities (No. 2014MS29).
References
[1] “Symantec Corporation”, Symantec Internet security threat report trends for 2010 [EB/OL] (2011-04) [2012-07-01], (2011), http://msisac.cisecurity.org/resources/reports/documents/Symantec, Internet Security Threat report 2010.pdf.
[2] N. Idika and A. P Mathur, “Survey of malware detection technical”, Technical Report, Department of Computer Science, Purdue University, (2007).
[3] C. L. Tsai, C. C. Tseng and C. C. Han, Editors, “Intrusive behavior analysis based on honey pot tracking and ant algorithm analysis”, 43rd Annual 2009 International Carnahan Conference, (2009) October 5-8, Zurich, Switzerland.
[4] W. Wang and I. Murynets, J. Security and Communication Networks, vol. 6, no. 1, (2013). [5] P. C. Lin, Y. D. Lin, Y. C. Laiand and T. H. Lee, J. Computer Practices, vol. 41, no. 4, (2008).
[6] Y. Sawaya, A. Kubota and Y. Miyake, Editors, “Detection of attackers in services using anomalous host behavior based on traffic flow statistics”, IEEE/IPSJ 11th International Symposium, (2011) July 18-21, Munich, Bavaria, Germany.
[7] M. Milenkovic, A. Milenkovic and E. Jovanov, J. ACM SIGARCH Computer Architecture News, vol. 33, no. 1, (2005).
[8] M. Christodorescu, S. Jha, S. A. Seshia, D. Song and R. E. Bryant, Editors, Proceedings of the 2005 IEEE Symposium Security and Privacy, (2005) May 8-11; Oakland, California.
[9] M. Christodorescu and S. Jha, “Static analysis of executables to detect malicious patterns”, Wisconsin: University of Wisconsin, (2006).
[10] D. G. Kong, X. B. Tan, H. S. Xi, T. Gong and J. M. Shuai, J. Journal of Software, vol. 22, no. 3, (2011). [11] A. Shabtai, R. Moskovitch, Y. Elovici and C. Glezer, J. Information Security Technical Report, vol. 14,
no. 1, (2009).
[12] Y. X. Ding, X. B. Yuan, D. Zhou, L. Dong and Z. C. An, J. Computers &Security, vol. 30, no. 6, (2011). [13] R. Wang, D. G. Feng, Y. Yang and P. R. Su, J. Journal of Software, vol. 23, no. 2, (2012).
[14] G. E. Hinton and R. R. Salakhutdinov, J. Science, vol. 313, no. 5786, (2006).
[15] G. E. Hinton, “Distributed representations”, Tech. Report, University of Toronto, (1984). [16] KDDCUP99, Available on, (2007), http://kdd.ics.uci.edu/databases/kddcup99/kddcup99.html.
Authors
Yuancheng Li, received the Ph.D. degree from University of Science and Technology of China, Hefei, China, in 2003. From 2004 to 2005, he was a postdoctoral research fellow in the Digital Media Lab, Beihang University, Beijing, China. Since 2005, he has been with the North China Electric Power University, where he is a professor and the Dean of the Institute of Smart Grid and Information Security. From 2009 to 2010, he was a postdoctoral research fellow in the Cyber Security Lab, Pennsylvania State University, Pennsylvania, USA. His current research interests include Smart Grid operation and control, information security in Smart Grid.