Quanitifying myocardial blood flow using
dynamic contrast enhanced cardiac
magnetic resonance imaging
John David Biglands
Submitted in accordance with the requirements for the degree of Doctor of Philosophy (PhD)
The University of Leeds School of Medicine School of Computing
The candidate confirms that the work submitted is his own, except where work which has formed part of jointly-authored publications has been included. The contribution of the candidate and the other authors to this work has been explicitly indicated below. The candidate confirms that appropriate credit has been given within the thesis where reference has been made to the work of others.
Chapter 7 is based on the jointly authored publication: “Biglands J, Magee D, Boyle R, Larghat A, Plein S, Radjenovic A, Evaluation of the effect of
myocardial segmentation errors on myocardial blood flow estimates from DCE-MRI. Physics in medicine and biology. 2011;56(8):2423–43.” J. Biglands carried out the perfusion analysis, computational modelling, statistical analysis and software development, generated all the results and wrote the final manuscript under the supervision of D. Magee, R. Boyle and A. Radjenovic. The MRI investigations on volunteers were conducted by A. Larghat under the supervision of S. Plein using an imaging sequence designed and tested by A. Radjenovic.
Chapter 2, Sections 2.7 to 2.9 are based on the jointly authored publication: “Biglands, John D, Radjenovic A, Ridgway JP. Cardiovascular magnetic resonance physics for clinicians: part II. Journal of Cardiovascular Magnetic Resonance. 2012;14(66).” J. Biglands wrote the sections in this publication entitled “Using exogenous contrast agents to modify contrast” and “Myocardial perfusion imaging”, which have been modified for inclusion in chapter 2. Other sections of the publication were written by J. Ridgway and A. Radjenovic and all authors proof read and approved the final manuscript.
In addition the algorithms and methods described in this thesis have been used in a number of publications. These are referenced below along with a
Full papers
Motwani M, Fairbairn TA, Larghat A, Mather AN, Biglands JD, Radjenovic A, Greenwood JP, Plein S. Systolic versus Diastolic acquisition in Myocardial Perfusion MRI Imaging. Radiology. 2012;262(3). MBF estimates were derived using software developed by the author. Signal values were converted to concentrations using software developed by the author. The author proof read, commented on and approved the final manuscript.
Larghat A, Biglands J, Maredia N, Greenwood JP, Ball SG, Jerosch-Herold M, Radjenovic A, Plein S. Endocardial and epicardial myocardial perfusion
determined by semi-quantitative and quantitative myocardial perfusion magnetic resonance. The international journal of cardiovascular imaging. 2011; 28(6): 1499-511. MBF estimates were derived using software developed by the author. Signal values were converted to contrast agent concentrations using software developed by the author. The author proof read, commented on and approved the final manuscript.
Johnstone RI, Greenwood JP, Biglands JD, Plein S, Ridgway JP, Radjenovic A. Assessment of tissue edema in patients with acute myocardial infarction by computer-assisted quantification of triple inversion recovery prepared MRI of the myocardium. Magnetic resonance in medicine. 2011;66(2):564–73. The author assisted in the development of software to process the images for this study. The author proof read, commented on and approved the final manuscript.
Radjenovic A, Biglands JD, Larghat A, Ridgway JP, Ball SG, Greenwood JP, Jerosch-Herold, M, Plein S. Estimates of systolic and diastolic myocardial blood flow by dynamic contrast-enhanced MRI. Magnetic resonance in medicine. 2010;64(6):1696–1703. The author assisted in the development of software to process the images for this study. The author proof read, commented on and approved the final manuscript.
Meeting abstracts
Society of cardiac magnetic resonance (SCMR) meeting
Biglands JD, Magee DR, Boyle R, Larghat AM, Jerosch-Herold M, Plein S, Radjenovic A. Evaluation of the effect of myocardial localisation errors on myocardial blood flow estimates from DCE-MRI. Journal of Cardiovascular Magnetic Resonance. 2010;12(Suppl 1):P235. The author carried out the
perfusion analysis, computational modelling, statistical analysis, software development, generated all the results and wrote the final abstract.
Broadbent DA, Biglands JD, Larghat AM, Sourbron S, Plein S, Buckley DL. Myocardial microvascular function at rest and stress measured with dynamic contrast-enhanced MRI. Journal of Cardiovascular Magnetic Resonance. 2012;14(Suppl 1):P283. Signal values were converted to concentrations using software developed by the author. The author proof read, commented on and approved the final abstract.
Motwani M, Fairbairn T, Larghat AM, Mather AN, Biglands JD, Radjenovic A, Greenwood JP, Plein S. Systolic versus diastolic myocardial blood flow in patients with suspected coronary artery disease - a cardiovascular magnetic resonance study. Journal of Cardiovascular Magnetic Resonance.
2012;14(Suppl 1):P17. MBF estimates were derived using software developed by the author. Signal values were converted to contrast agent concentrations using software developed by the author. The author proof read, commented on and approved the final abstract.
Asrress KN, Williams R, Lockie T, Biglands JD, Chiribiri A, Radjenovic A, Jogiya R, De Silva K, Kozerke S, Chowienczyk P, Nagel E, Marber M, Redwood S, Plein S. Increased endocardial to epicardial flow ratio present at rest disappears during exercise stress perfusion CMR in normal volunteers – a potential
mechanism for exercise induced subendocardial ischaemia. Journal of
were derived using software developed by the author. The author proof read, commented on and approved the final abstract.
Larghat AM, Biglands J, Greenwood JP, Fairbain TA, Maredia N, Radjenovic A, Ball S, Plein S. Myocardial blood flow in patients with Type 2 Diabetes Mellitus and normal coronary angiography. Journal of Cardiovascular Magnetic
Resonance. 2011;13(Suppl 1):P275. MBF estimates were derived using software developed by the author. The author proof read, commented on and approved the final abstract.
Maredia N, Plein S, Younger JF, Brown JM, Nixon J, Everett CC, Ridgway JP, Radjenovic A, Dickinson CJ, Biglands JD, Larghat AM, Ball SG, Greenwood JP. Detection of triple vessel coronary artery disease by visual and quantitative first pass CMR myocardial perfusion imaging in the CE-MARC study. Journal of Cardiovascular Magnetic Resonance. 2011;13(Suppl 1):O29. MBF estimates were derived using software developed by the author. The author proof read, commented on and approved the final abstract.
Larghat AM, Radjenovic A, Maredia N, Biglands J, Greenwood J, Plein S. Reproducibility of first pass perfusion CMR at rest and during hyperaemia for estimation of myocardial perfusion. Journal of Cardiovascular Magnetic
Resonance. 2010;12(Suppl 1):P228. MBF estimates were derived using software developed by the author. The author proof read, commented on and approved the final abstract.
Larghat AM, Radjenovic A, Maredia N, Biglands J, Greenwood JP, Jerosch-Herold M, Plein S. Subendocardial to subepicardial absolute myocardial blood flow at rest and hyperaemia determined by first pass CMR and Fermi
deconvolution modelling. Journal of Cardiovascular Magnetic Resonance. 2010;12(Suppl 1):P223. MBF estimates were derived using software developed by
the author. The author proof read, commented on and approved the final abstract.
Johnstone R, Ridgway J, Biglands J, Greenwood J, Radjenovic A. Assessment of cardiac oedema in patients with acute myocardial infarction by manual
planimetry and computerised segmentation of triple inversion recovery prepared turbo spin echo images. Journal of Cardiovascular Magnetic Resonance.
2009;11(Suppl 1):51. The author assisted in the development of software to process the images for this study. The author proof read, commented on and approved the final abstract.
International society of magnetic resonance imaging (ISMRM) meeting
Biglands JD, Larghat A, Plein S, Magee DR, Boyle R, Radjenovic A, Myocardial contour error distance metric evaluators do not correlate with myocardial blood flow estimates from DCE-MRI cardiac perfusion, In Proceedings of the
International Society of Magnetic Resonance Imaging, 2011 Montreal. The author carried out the perfusion analysis, computational modelling, statistical analysis, software development, generated all the results and wrote the final abstract.
Biglands JD, Larghat A, Plein S, Magee DR, Boyle R, Radjenovic A. The effect of myocardial contour errors on myocardial blood flow estimates in cardiac DCE-MRI perfusion, In Proceedings of the International Society of Magnetic Resonance Imaging, 2011 Montreal. The author carried out the perfusion analysis, computational modelling, statistical analysis, software development, generated all the results and wrote the final abstract.
Biglands JD, Larghat A, Plein S, Buckley DL, Jerosch-Herold M, Magee D, Boyle R, Radjenovic A. Saturation correction of dynamic contrast enhanced MRI uptake curves for quantitative myocardial blood flow measurements using an assumed T1 for blood. In Proceedings of the International Society of
analysis, computational modelling, statistical analysis, software development, generated all the results and wrote the final abstract.
Buckley DL, Biglands JD, Larghat A, Sourbron SP, Radjenovic A, Greenwood JP, Plein S. Myocardial microvascular function at rest and under adenosine stress measured with dynamic contrast-enhanced MRI. In Proceedings of the International Society of Magnetic Resonance Imaging, 2011 Montreal. Signal values were converted to contrast agent concentrations using software
developed by the author. The author proof read, commented on and approved the final abstract.
Radjenovic A, Biglabnds JD, Larghat A, Greenwood JP, Jerosch-Herold M, Plein S. Comparison of systolic and diastolic perfusion by dynamic contrast enhanced MRI. In Proceedings of the International Society of Magnetic
Resonance. 2010 Stockholm. The author assisted in the development of software to process the images for this study. The author proof read, commented on and approved the final abstract.
American heart association (AHA) meeting
Larghat A, Biglands J, Greenwood J, Fairbain TA, Maredia N, Radjenovic A, Ball SG, Plein S. Myocardial blood flow in angiographically normal patients with type 2 Diabetes mellitus, prediabetes and normal controls – A cardiovascular magnetic resonance perfusion study. Circulation. In AHA scientific Sessions, 124, 2011: A15128. MBF estimates were derived using software developed by the author. The author proof read, commented on and approved the final abstract.
Fairbairn A, Motwani M, Mather AN, Biglands JD, Larghat AM, Greenwood JP, Plein S. Myocardial blood flow changes during cold pressor testing for the assessment of endothelial function. A Cardiovascular Magnetic Resonance study. Circulation. In AHA scientific Sessions, 124(21), 2011: A1496. MBF
estimates were derived using software developed by the author. The author proof read, commented on and approved the final abstract.
This copy has been supplied on the understanding that it is copyright material and that no quotation from the thesis may be published without proper
acknowledgement.
Acknowledgements
Sincere thanks go to my supervisors Dr. Sasha Radjenovic, Dr. Derek Magee, and Prof. Roger Boyle (who retired during the period of this research). Beyond their considerable academic expertise they have displayed enthusiasm and a much needed sense of humour, which have made supervision meetings as enjoyable as they have been educational.
In addition I am immensely grateful to Dr. Steven Sourbron, Prof. David Buckley and Dr. John Ridgway who have been tremendously generous with their time in helping me to understand DCE-MRI physics and to Prof. Sven Plein and Dr. John Greenwood for clinical discussions.
I would like to thank Dr. Neil Maredia, Dr. Adam Mather, Dr. Tim Fairbairn, Dr. Abdulghani Larghat, Dr. Akhlaque Uddin, Dr. Manish Motwani and Dr. Ananth Kidambi for their interest in this research and for enabling it to be applied in so many clinical contexts. I am indebted to the Leeds cardiac MR radiographers Margaret Saysell, Gavin Bainbridge and Caroline Richmond for scanning the patients and volunteers. My heartfelt thanks go to my fellow PhD student sufferers Constantine Zakharov and Owen Richardson for much needed moral support and coffee!
I thank my mother and sister for supporting me in every way they knew how and Les Goldstraw for teaching me to love knowledge wherever it lies. I reserve my biggest thankyous for my wife Jenny and my two children Ellie and Josiah (who was born during this PhD). Jenny has believed in me more than I believed in myself and, in these last months, has made monumental sacrifices to enable me to spend the time I needed to complete this thesis. Ellie and Josiah are a constant source of joy to me. My family makes me richer than I ever expected to be and I thank God for them as I thank him for the gift of my own life and the dreams that I have been able to chase in the time that I have been given.
Abstract
The assessment of myocardial perfusion using dynamic contrast enhanced magnetic resonance imaging (DCE-MRI) is a powerful tool for diagnosing myocardial ischaemia due to coronary heart disease, which affects nearly 2.7 million people in the UK and for which there is an effective treatment. Although visual analysis of DCE-MRI data performs well diagnostically, a quantitative estimate of myocardial blood flow (MBF) makes the diagnosis objective and could increase diagnostic performance. Obtaining MBF estimates from DCE-MRI data is a multi-step process requiring:
- the localisation of the myocardium and arterial input function (AIF) to generate signal intensity vs. time curves;
- the conversion of signal intensity data to contrast agent concentration values;
- the application of a perfusion model to generate a quantitative MBF estimate;
- the interpretation of MBF estimates to make a diagnostic assessment of myocardial ischaemia.
There are a range of approaches for solving each of these problems. The aim of the work presented in this thesis has been to provide clinically relevant evidence for choosing between these approaches. Myocardial localisation contour error tolerance levels are suggested based on simulations using a volunteer dataset. A non-linear signal intensity to contrast agent concentration conversion method is presented and tested using simulations and phantom data. An investigation into the best way to interpret quantitative MBF estimates is then presented. Finally a comparison of four, widely applied, perfusion models is conducted.
Where possible, methods have been compared on a sizeable patient dataset in terms of diagnostic performance rather than MBF estimate accuracy. This provides evidence suitable for informing clinical decisions on the best
methodology for quantitative perfusion. Such evidence could contribute to a standard methodology for quantitative cardiac MR perfusion. This is necessary for large clinical trials, which are essential before quantitative MBF estimates can be accepted into routine clinical practice.
Table of Contents
Acknowledgements ... ix
Abstract ... x
Table of Contents ... xi
List of Tables ... xvi
List of Figures ... xviii
List of abbreviations ... xxvii
1. Introduction ... 1
1.1. Background ... 1
1.2. Aims 3 1.3. Overview ... 4
2. Background: perfusion MRI physics ... 7
2.1. Introduction ... 7
2.2. The origin of the MR signal ... 7
2.3. Longitudinal recovery ... 8
2.4. Transverse magnetization ... 10
2.5. Generating an image: localisation ... 11
2.6. Pulse sequences ... 15
2.6.1. Gradient recalled echo (GRE) ... 15
2.6.2. Fast sequences ... 16
2.6.3. The preparation pulse ... 18
2.7. MR contrast agents ... 19
2.8. Dynamic contrast enhanced magnetic resonance imaging (DCE-MRI) myocardial perfusion ... 21
2.8.1. The perfusion pulse sequence: read-out sequence ... 22
2.8.2. The perfusion pulse sequence: T1-weighting and TS .. 23
2.8.3. The perfusion pulse sequence: trigger delay (TD) ... 24
2.8.4. Coverage and resolution ... 25
2.8.5. Factors relevant to quantitation of myocardial blood flow 27 2.8.6. Non-linearity effects at high gadolinium concentrations28 2.9. The dark rim artifact (DRA) ... 29
2.10.Summary ... 30
3. Background: ischaemia and myocardial perfusion ... 32
3.1. Introduction ... 32
3.3. Coronary heart disease (CHD) ... 33
3.4. Diagnosing coronary heart disease ... 35
3.4.1. The cascade of ischaemia ... 35
3.4.2. Stress testing ... 36
3.4.3. Myocardial perfusion reserve (MPR) ... 37
3.4.4. Electrocardiogram (ECG)... 39
3.4.5. X-ray angiography ... 40
3.4.6. Single photon emission computed tomography (SPECT) ... 42
3.4.7. Positron emission tomography (PET) ... 45
3.4.8. Echocardiography ... 47
3.4.9. Computed tomography (CT) ... 48
3.4.10. Magnetic resonance imaging (MRI) ... 49
3.4.11. The AHA mapping ... 52
3.4.12. The role of CMR in diagnosing myocardial ischaemia . 53 3.5. Summary ... 54
4. Quantitative myocardial perfusion ... 55
4.1. Introduction ... 55
4.2. Semi-quantitative analysis ... 55
4.3. Quantitative analysis ... 57
4.3.1. The central volume principle ... 57
4.3.2. Deconvolution ... 60
4.3.3. Fermi-constrained deconvolution ... 61
4.3.4. Model independent analysis ... 62
4.3.5. Tracer-kinetic modelling ... 66
4.3.6. One compartment ( ) ... 68
4.3.7. The uptake model ... 70
4.4. Summary ... 70 5. General methods ... 72 5.1. Overview ... 72 5.2. Datasets ... 72 5.2.1. CE-MARC ... 72 5.2.2. Dual phase ... 76
5.3. Manual contouring of myocardial perfusion imaging ... 79
5.4. Automated analysis of perfusion curves ... 81
5.4.2. Identifying the end of the first pass ... 85
5.4.3. Calculating the delay time ... 87
5.5. Qualitative evaluation of automated curve pre-processing for quantitative myocardial perfusion. ... 88
5.5.1. Introduction ... 88 5.5.2. Method ... 88 5.5.3. Results ... 90 5.5.4. Discussion ... 90 5.5.5. Conclusion ... 92 5.5.6. Limitations ... 93 5.6. Summary ... 93
6. Signal intensity to concentration conversion in magnetic resonance imaging for quantitative myocardial perfusion ... 95
6.1. Overview ... 95
6.2. A method for converting signal intensities to concentrations in myocardial perfusion imaging ... 96
6.2.1. Derivation of the SR-TFE pulse sequence equation .. 100
6.2.2. SR-TFE with flip angle sweep ... 102
6.2.3. Derivation of the SR-TFE signal intensity equation incorporating flip angle sweep ... 104
6.2.4. Minimization ... 105
6.3. Simulation Studies ... 106
6.3.1. T2* effects ... 106
6.3.2. Comparing SR-TFE equations with and without flip angle sweep ... 109
6.3.3. Method ... 109
6.3.4. Results ... 110
6.3.5. Discussion ... 115
6.3.6. Conclusion ... 116
6.3.7. The effect of errors in the assumed blood T1 ... 117
6.4. Phantom experiments ... 120 6.4.1. Introduction ... 120 6.4.2. Method ... 121 6.4.3. Results ... 123 6.4.4. Discussion ... 127 6.4.5. Conclusion ... 129 6.5. In-vivo experiments ... 130
6.5.1. Introduction ... 130 6.5.2. Method ... 130 6.5.3. Results ... 133 6.5.4. Discussion ... 136 6.5.5. Conclusion ... 140 6.6. Summary ... 140
6.7. Limitations and future work ... 141
7. Evaluation of the effect of myocardial segmentation errors on myocardial blood flow estimates from DCE-MRI ... 143
7.1. Introduction ... 143
7.2. Method ... 144
7.2.1. Datasets... 144
7.2.2. Inter and Intra-observer variability to validate contour error simulations ... 144
7.2.3. Random contour errors ... 145
7.2.4. Systematic contour errors ... 146
7.2.5. Segmentation metrics ... 146
7.2.6. Quantitation of MBF ... 147
7.2.7. Units of contour error ... 147
7.3. Results ... 148
7.3.1. Segmentation metrics ... 148
7.3.2. Systematic contour errors ... 149
7.3.3. Random contour errors ... 152
7.3.4. Inter- and intra-observer variability to validate contour error simulations ... 157
7.4. Discussion ... 159
7.4.1. Segmentation metrics ... 160
7.4.2. Systematic contour errors ... 160
7.4.3. Random contour errors ... 164
7.4.4. Inter- and intra-observer variability to validate contour error simulations ... 166
7.4.5. Limitations ... 167
7.5. Conclusion ... 168
8. Comparisons of methods for diagnosing coronary artery disease using quantitative perfusion myocardial blood flow estimates ... 170
8.1. Introduction ... 170
8.3. The exclusion process for the CE-MARC sub-set ... 172
8.3.1. Method ... 172
8.3.2. Results ... 174
8.3.3. Discussion ... 175
8.4. Diagnostic evaluation of non-linearity correction ... 180
8.4.1. Introduction ... 180
8.4.2. Method ... 180
8.4.3. Results ... 182
8.4.4. Discussion ... 184
8.4.5. Conclusion ... 185
8.5. A comparison of approaches for using regional quantitative MPR to diagnose ischaemic heart disease ... 185
8.5.1. Introduction ... 185
8.5.2. Method ... 187
8.5.3. Results ... 191
8.5.4. Discussion ... 195
8.6. Conclusion ... 197
9. Comparisons of tracer kinetic models applied to cardiac magnetic resonance perfusion data ... 198
9.1. Introduction ... 198
9.2. Method ... 198
9.2.1. Patient imaging ... 198
9.2.2. Data analysis ... 199
9.2.3. Generation of diagnostic results ... 201
9.2.4. Statistical analysis of results ... 201
9.3. Results ... 201
9.3.1. Exclusions ... 201
9.3.2. Discussion ... 210
9.3.3. MBF Estimates ... 212
9.3.4. Comparison of perfusion models ... 214
9.3.5. Comparison of diagnostic power of the tests ... 215
9.4. Conclusion ... 216
10. Conclusions, limitations and future direction ... 218
10.1.Limitations and future work ... 218
10.2.Conclusion ... 220
List of Tables
TABLE 3-1 – TABLE SUMMARISING DIAGNOSTIC PERFORMANCE STUDIES FOR CMR AGAINST X-RAY ANGIOGRAPHY. AVERAGES, WEIGHTED FOR STUDY POPULATION, ARE SHOWN FOR STUDIES WITH VISUAL, SEMI-QUANTITATIVE AND QUANTITATIVE CMR DATA ANALYSIS. 50 TABLE 5-1 – SCAN PARAMETERS FOR THE CE-MARC PERFUSION IMAGING SEQUENCE 74 TABLE 5-2 – PULSE SEQUENCE PARAMETERS FOR THE DUAL-PHASE IMAGING PROTOCOL. 78 TABLE 5-3 – SUMMARY OF CASES WHERE MANUAL INTERVENTION WAS DEEMED NECESSARY
EXPRESSED AS THE NUMBER OF INDIVIDUAL REGIONS AND AS A PERCENTAGE IN BRACKETS. THE NUMBER OF INDIVIDUAL PATIENTS AFFECTED BY THESE ADJUSTMENTS IS ALSO SHOWN. 90 TABLE 6-1 – PERCENTAGE ERRORS BETWEEN THE T2* MODEL AND THE NON T2* MODEL AT 3MM AND
5MM. 108
TABLE 6-2 – ADMINISTERED AND FITTED FLIP ANGLES, WITH CORRESPONDING CALIBRATION FACTOR VALUES FOR THE PLOTS DISPLAYED IN FIGURE 6-12. 127 TABLE 6-3 – STRESS MBF, REST MBF AND MPR AVERAGED OVER ALL VOLUNTEERS AND ALL SLICES
(MEAN + STANDARD DEVIATION) ANALYSED USING I) PRE-BOLUS (AIF AND MYOCARDIAL UPTAKE CURVE TAKEN FROM THE PRE-BOLUS), II) BOLUS (AIF AND MYOCARDIUM TAKEN FROM MAIN BOLUS), III) DUAL-BOLUS (AIF TAKEN FROM PRE-BOLUS AND DOSE ADJUSTED, MYOCARDIUM
TAKEN FROM MAIN BOLUS). 133
TABLE 6-4 –RESULTS EXPRESSED AS RATIOS BETWEEN ANALYSIS REGIMENS (MEAN + STANDARD DEVIATION). I) THE RATIO OF PRE-BOLUS TO DUAL-BOLUS RESULTS, II) THE RATIO OF PRE-BOLUS TO BOLUS RESULTS AND III) THE RATIO OF BOLUS TO DUAL-BOLUS RESULTS. 134 TABLE 6-5 - STRESS MBF, REST MBF AND MPR AVERAGED OVER ALL PATIENTS (MEAN + STANDARD
DEVIATION) ANALYSED USING I) PRE-BOLUS(AIF AND MYOCARDIAL UPTAKE CURVE TAKEN FROM THE PRE-BOLUS), II) BOLUS (AIF AND MYOCARDIUM TAKEN FROM MAIN BOLUS), III) DUAL-BOLUS (AIF TAKEN FROM PRE-BOLUS AND DOSE ADJUSTED, MYOCARDIUM TAKEN FROM MAIN BOLUS).
135 TABLE 6-6 –RESULTS EXPRESSED AS RATIOS BETWEEN ANALYSIS REGIMENS (MEAN + STANDARD
DEVIATION). I) THE RATIO OF PRE-BOLUS TO DUAL-BOLUS RESULTS, II) THE RATIO OF PRE-BOLUS TO BOLUS RESULTS AND III) THE RATIO OF BOLUS TO DUAL-BOLUS RESULTS. 135 TABLE 6-7 - AVERAGE OF A SELECTION OF HEALTHY SUBJECT, SINGLE-BOLUS, MYOCARDIAL PERFUSION
QUANTITATION PAPERS FROM THE LITERATURE. ALL STUDIES WERE CARRIED OUT WITH A SINGLE
BOLUS DOSE OF <= 0.02 MMOL/KG. 136
TABLE 6-8 – AVERAGE OF A SELECTION OF HEALTHY SUBJECT, DUAL-BOLUS, MYOCARDIAL PERFUSION QUANTITATION PAPERS FROM THE LITERATURE. ALL QUANTITATIVE ANALYSES WERE CARRIED OUT USING FERMI-CONSTRAINED DECONVOLUTION EXCEPT ICIHARA 2009, WHICH USED PATLAK.
137 TABLE 7-1 - TABLE OF THE PEARSON’S CORRELATION R-VALUE BETWEEN MBF ERROR (ML/G/MIN) AND
EACH OF THE THREE SEGMENTATION ERROR METRICS: MAXIMUM DEVIATION (MD) EXPRESSED AS A FRACTION OF THE MEAN MYOCARDIAL WIDTH (MW), DICE’S SIMILARITY COEFFICIENT (DSC)
(NO UNITS) AND HAUSDORFF DISTANCE (HD) (MM). RESULTS ARE SHOWN CONSIDERING ERRORS IN REST/STRESS AND ENDOCONTOUR/EPICONTOUR SEPARATELY AND FINALLY OVER ALL DATA.
148 TABLE 7-2 - TABLE OF STATISTICALLY SIGNIFICANT MBF ERRORS GENERATED BY RANDOM CONTOUR
ERRORS CONSIDERING THE SIX MYOCARDIAL REGIONS. MD CORRESPONDS TO THE MAXIMUM DEVIATION AT WHICH MBF ERRORS BECAME SIGNIFICANT. CASES WHERE SIGNIFICANT (P <0.05)
DIFFERENCES WERE NOT OBSERVED ARE NOT SHOWN. 153
TABLE 7-3 - TABLE OF STATISTICALLY SIGNIFICANT MBF ERRORS GENERATED BY RANDOM CONTOUR ERRORS CONSIDERING THE ENDOCARDIUM AND EPICARDIUM SEPARATELY. MD CORRESPONDS TO THE MAXIMUM DEVIATION AT WHICH MBF ERRORS BECAME SIGNIFICANT. CASES WHERE SIGNIFICANT (P <0.05) DIFFERENCES WERE NOT OBSERVED ARE NOT SHOWN. 156 TABLE 8-1 – CLASSIFICATION CRITERIA FOR THE 50 PATIENT SUBSET 172 TABLE 8-2 – TABLE OF REASONS FOR EXCLUSION FROM THE CE-MARC SUBSET 175 TABLE 8-3 – TABLE OF EXCLUSION POSITIONS FROM THE CE-MARC SUBSET. 175 TABLE 8-4 – TABLE SHOWING THE MEAN + SD MBFS AT STRESS AND REST AND THE CORRESPONDING
MPRS USING LINEAR AND NON-LINEAR CORRECTION. 183
TABLE 8-5 – AREA UNDER THE CURVE (AND ASSOCIATED CONFIDENCE INTERVAL) FOR THE TWO CONCENTRATION CONVERSION METHODS, WITH OPTIMAL MPR CUT-OFF VALUES DERIVED FROM
THE ROC CURVE. 184
TABLE 8-6 – TABLE OF AREA UNDER ROC CURVE (AUC), MPR CUT-OFF VALUES AND NUMBER OF ISCHAEMIC CASES IN DATASET FOR ANALYSIS FROM EACH CORONARY ARTERY AND WHEN ALL
REGIONS ARE CONSIDERED IN THE ANALYSIS. 192
TABLE 9-1 – NUMBER OF EXCLUSIONS FOR STRESS, REST MBF AND MPR FOR EACH OF THE
QUANTITATION MODELS. THE EXCLUSION CRITERION WAS 0 < X < 8 FOR STRESS MBF AND MPR
AND 0 < X < 4 FOR REST MBF. 202
TABLE 9-2 – MEAN + STANDARD DEVIATION STRESS AND REST MBFS AND MPR VALUES FOR THE FOUR METHODS IN THE HEALTHY AND ISCHAEMIC PATIENT POPULATIONS AS DIAGNOSED BY X-RAY
ANGIOGRAPHY AND THE AHA MAPPING. 202
TABLE 9-3 – PEARSON’S CORRELATION R-VALUES FOR COMPARISONS BETWEEN THE FOUR MODELS. IN
ALL COMPARISONS P<0.0001. 202
TABLE 9-4 – BLAND-ALTMAN BIAS VALUES WITH CONFIDENCE INTERVALS WHEN DIFFERENT MODELS ARE COMPARED IN TERMS OF STRESS MBF [ML/G/MIN], REST MBF [ML/G/MIN] AND MPR. 203 TABLE 9-5 – STANDARD DEVIATION OF DIFFERENCES BETWEEN MODELS FOR ALL MODEL COMPARISONS
IN TERMS OF STRESS MBF [ML/G/MIN], REST MBF [ML/G/MIN] AND MPR. 204 TABLE 9-6 - ROC CURVE COMPARISON P-VALUES (CURVES SHOWN IN FIGURE 9-4) 208 TABLE 9-7 – ROC CURVE DESCRIPTIVE PARAMETERS FOR THE FOUR MODELS, AREA UNDER THE CURVE
(AUC), OPTIMAL MPR CUT-OFF VALUE, SENSITIVITY AND SPECIFICITY AT THE OPTIMAL CUT-OFF,
List of Figures
FIGURE 1-1 – FLOW DIAGRAM DEPICTING THE ANALYSIS PATHWAY FOR QUANTITATIVE DCE-MRI CARDIAC PERFUSION. AFTER THE DCE-MRI DATASET HAS BEEN ACQUIRED THE MYOCARDIUM AND BLOOD POOL ARTERIAL INPUT FUNCTION (AIF) MUST BE IDENTIFIED ON EVERY IMAGE FRAME (LOCALISATION). TYPICALLY THE MYOCARDIUM IS THEN SUBDIVIDED INTO REGIONS RELATED TO DIFFERENT CORONARY ARTERIES (MAPPING). SIGNAL INTENSITY (SI) VS. TIME
UPTAKE CURVES MUST THEN BE GENERATED FROM EACH FRAME AND THEN CONVERTED TO CONTRAST AGENT CONCENTRATIONS. A PERFUSION MODEL IS THEN APPLIED TO THE TWO UPTAKE CURVES IN ORDER TO GENERATE A QUANTITATIVE ESTIMATE OF MYOCARDIAL BLOOD FLOW (MBF). THIS MBF VALUE MUST THEN BE INTERPRETED IN ORDER TO MAKE A DIAGNOSIS AS TO WHETHER THE MYOCARDIAL REGION IS ISCHAEMIC OR NOT. ONLY QUANTITATIVE, OR SEMI-QUANTITATIVE, ANALYSIS REQUIRES THE STEPS WITHIN THE BOX. 2 FIGURE 2-1 - IN THE PRESENCE OF AN EXTERNAL MAGNETIC FIELD, BO, THE SPIN MAGNETIC MOMENT
PRECESSES AROUND BO AT AN ANGULAR FREQUENCY DESCRIBING A CONE SHAPE. 8
FIGURE 2-2 – A) THE NET MAGNETIZATION SIMULTANEOUSLY PRECESSES ABOUT BO AND A SECOND
MAGNETIC FIELD OSCILLATING AT EXACTLY CAUSING THE NET MAGNETIZATION TO SPIRAL INTO THE TRANSVERSE PLANE. B) VIEWED FROM A FRAME OF REFERENCE ROTATING AT THE OSCILLATIONS OF B1 ARE REMOVED AND THE NET MAGNETIZATION APPEARS TO SIMPLY FLIP
DIRECTLY INTO THE XY-PLANE. 10
FIGURE 2-3 – BY APPLYING AN ADDITIONAL GRADIENT, GZ, WHILST EXPOSING THE OBJECT ONLY TO A
LIMITED BANDWIDTH OF B1 FREQUENCIES ONLY SPINS IN A FINITE SLICE ARE EXCITED. 12
FIGURE 2-4 – PRECESSIONAL FREQUENCY INCREASES WITH X DUE TO THE MAGNETIC FIELD GRADIENT GX. THE MEASURED SIGNAL IS THE SUM OF ALL SPIN FREQUENCIES AND AMPLITUDES. THE
FOURIER TRANSFORM REPRESENTS THESE ON A FREQUENCY AXIS. AS FREQUENCY IS
SYNONYMOUS WITH SPATIAL POSITION, BY VIRTUE OF THE FREQUENCY ENCODING GRADIENT GX,
THE FREQUENCY AXIS CAN BE REINTERPRETED AS POSITION ALONG THE X DIRECTION. 13 FIGURE 2-5 – AFTER THE APPLICATION OF A PHASE ENCODING GRADIENT FOR A SHORT TIME IN THE Y
DIRECTION THE SPIN’S PHASE IS A FUNCTION OF DISTANCE ALONG Y. 14 FIGURE 2-6 – SIGNAL ACQUISITIONS ACQUIRED WITH INCREASING PHASE ENCODING GRADIENT
STRENGTH ARE ARRANGED SEQUENTIALLY IN A MATRIX CALLED K-SPACE. IN THE FREQUENCY ENCODING DIRECTION THE FT TRANSFORMS THE DATA ONTO A FREQUENCY AXIS . IN THE PHASE ENCODING DIRECTION THE FT TRANSFORMS THE DATA TO A RATE OF CHANGE OF PHASE
AXIS . 15
FIGURE 2-7 – GRADIENT RECALLED ECHO. THE ΑO RF PULSE IS APPLIED IN CONJUNCTION WITH THE SLICE SELECTION GRADIENT GS, FOLLOWED BY A REPHASING GRADIENT. THE PHASE ENCODING GRADIENT ,GP, IS APPLIED IN CONJUNCTION WITH THE A DEPHASING GRADIENT GF, AFTER WHICH THE SIGNAL IS ACQUIRED DURING THE FREQUENCY REPHASING GRADIENT. 16
FIGURE 2-8 - HYBRID ECHO PLANAR IMAGING (HYBRID-EPI). THE SLOPE OF THE FREQUENCY ENCODING GRADIENT IS RAPIDLY ALTERNATED, GENERATING A TRAIN OF GRADIENT ECHOES FOLLOWING A SINGLE RF EXCITATION PULSE. PHASE ENCODING GRADIENTS ARE APPLIED BETWEEN EACH FREQUENCY ENCODING GRADIENT TO ENSURE EACH GRADIENT ECHO FILLS A DIFFERENT LINE OF K-SPACE. IN HYBRID-EPI MULTIPLE RF PULSES ARE USED, EACH FOLLOWED BY AN ECHO TRAIN.
(ETL = 5 IN THIS CASE). 17
FIGURE 2-9 – A) SMALL FLIP ANGLES AND SHORT TRS IN SPOILED GRADIENT ECHO CREATES POOR T1
IMAGE CONTRAST. B) THE USE OF A 90O SATURATION PULSE AND A LONG SATURATION TIME (TS) ESTABLISHES STRONG T1 CONTRAST BEFORE APPLYING THE SPOILED GRADIENT ECHO READ-OUT.
18 FIGURE 2-10 - SIGNAL INTENSITY VALUES OVER A RANGE OF CONCENTRATIONS FOR A SPOILED
GRADIENT ECHO PULSE SEQUENCE. THE SOLID LINE SHOWS THE COMBINED EFFECT OF T1 AND
T2* ON SIGNAL INTENSITY. THE TWO DASHED CURVES SHOW THE SEPARATE DEPENDENCIES OF
THE SIGNAL BEHAVIOUR FOR T1 OR T2* ALONE. AT LOW CONCENTRATIONS THE EFFECT OF T1
SHORTENING IS DOMINANT, WHILE AT HIGHER CONCENTRATIONS THE T2* SHORTENING
DOMINATES. A SERIES OF SAMPLES IMAGED WITH INCREASING PERCENTAGE CONCENTRATIONS OF GADOLINIUM ARE SHOWN UNDERNEATH THE PLOT AS A VISUAL DEMONSTRATION OF THE
EFFECT. 20
FIGURE 2-11 - CONTRAST AGENT IS INJECTED INTRAVENOUSLY WHILST MULTIPLE IMAGES OF THE HEART ARE ACQUIRED TO CREATE A DYNAMIC SERIES SHOWING THE CONTRAST AGENT PASSING THROUGH THE HEART. CONTRAST AGENT CAN BE SEEN AS SIGNAL ENHANCEMENT IN THE RIGHT VENTRICLE (RV) FOLLOWED BY THE LEFT VENTRICLE (LV) AND MORE GRADUALLY IN THE
MYOCARDIUM, BEFORE FINALLY WASHING OUT. 22
FIGURE 2-12 - THE TRIGGER DELAY (TD) SETS THE POINT AT WHICH THE CENTRE OF K-SPACE, K0, IS
ACQUIRED WITHIN EACH RR-INTERVAL. THE SATURATION TIME (TS) DETERMINES THE TIME BETWEEN THE SATURATION PULSE AND THE CENTRE OF K-SPACE, THEREBY CONTROLLING THE T1
-WEIGHTED CONTRAST OF THE IMAGE FOR A PARTICULAR IMAGE SLICE. 24 FIGURE 2-13 - WITH A SINGLE SLICE ACQUISITION PER RR INTERVAL (TOP) THERE IS FLEXIBLE CHOICE
FOR THE OPTIMAL CARDIAC PHASE AND T1-WEIGHTED IMAGE CONTRAST, BUT POOR COVERAGE
OF THE LV. FOR MULTIPLE SLICE ACQUISITIONS, THE USE OF A SEPARATE PREPARATION PULSE FOR EACH SLICE (CENTRE) ALLOWS THE SAME IMAGE CONTRAST FOR EACH SLICE (FIXED TS) BUT THE TWO SLICES ARE ACQUIRED AT DIFFERENT CARDIAC PHASES DUE TO THEIR DIFFERENT TRIGGER DELAYS AND THE NUMBER OF SLICES IS LIMITED. USING A PRE-PULSE SHARED BY ALL THE SLICE ACQUISITIONS (BOTTOM) POTENTIALLY ALLOWS MORE SLICES TO BE ACQUIRED, BUT LEADS TO EACH SLICE HAVING BOTH A DIFFERENT T1-CONTRAST BEHAVIOUR, AND A DIFFERENT
CARDIAC PHASE. 25
FIGURE 2-14 - FOR EVERY IMAGE IN THE DYNAMIC SEQUENCE CONTOURS DESCRIBING THE MYOCARDIUM AND A REGION IN THE BLOOD POOL ARE DRAWN. THE AVERAGE SIGNAL
OF SIGNAL INTENSITY VERSUS TIME THAT SHOW THE INCREASE IN SIGNAL INTENSITY IN BOTH THE
MYOCARDIUM (GREEN) AND THE BLOOD POOL (RED). 26
FIGURE 2-15 - THE LEFT HAND GRAPH SHOWS THE DIFFERENCE BETWEEN THE ASSUMED LINEAR RELATIONSHIP BETWEEN SIGNAL INTENSITY AND GD CONCENTRATION (DOTTED LINE) AND THE TRUE RELATIONSHIP (SOLID LINE). THE RIGHT HAND GRAPH SHOWS HOW THE NON-LINEAR RELATIONSHIP AT HIGHER CONCENTRATIONS CAN PROPAGATE INTO A PEAK HEIGHT ERROR IN THE MEASURED BLOOD POOL CURVE (THE ARTERIAL INPUT FUNCTION OR AIF) CAUSING AN
OVERESTIMATE IN MBF. 27
FIGURE 3-1 – A) OXYGENATED BLOOD FROM THE PULMONARY VEINS ENTERS THE LEFT ATRIUM (LA) AND IS PUMPED INTO THE LEFT VENTRICLE (LV), WHICH PUMPS OXYGENATED BLOOD TO THE REST OF THE BODY. THE DEOXYGENATED BLOOD RETURNS VIA THE INFERIOR AND SUPERIOR VENA CAVAE INTO THE RIGHT ATRIUM WHERE IT PASSES INTO THE RIGHT VENTRICLE TO BE PUMPED TO THE LUNGS FOR REOXYGENATION VIA THE PULMONARY ARTERIES. B) THE RIGHT CORONARY ARTERY (RCA) AND LEFT MAIN STEM (LMS) BRANCH DIRECTLY FROM THE ASCENDING AORTA. THE LMS BIFURCATES INTO THE LEFT ANTERIOR DESCENDING ARTERY (LAD) AND THE
LEFT CIRCUMFLEX (LCX). 33
FIGURE 3-2 – PTCA. A) X-RAY WITH IODINATED CONTRAST AGENT OF RIGHT CORONARY ARTERY SHOWING A SIGNIFICANT STENOSIS. B) X-RAY WITHOUT CONTRAST AGENT SHOWING BALLOON ANGIOPLASTY AND THE RADIO-OPAQUE CATHETER GUIDEWIRE. C) X-RAY WITH CONTRAST AGENT SHOWING THE OPENED ARTERY POST ANGIOPLASTY AND STENT PLACEMENT 34 FIGURE 3-3 – CORONARY FLOW RESERVE. THE DOTTED LINE DESCRIBES THE CORONARY FLOW AT
MAXIMAL VASODILATION AND THE SOLID LINE THE FLOW AT REST. EACH SOLID CIRCLE CORRESPONDS TO A DIFFERENT PERCENTAGE DEGREE OF CORONARY STENOSIS. REPRODUCED
FROM (41) 38
FIGURE 3-4 – NORMAL ECG PLOT. THE P WAVE CORRESPONDS TO THE DEPOLARISATION OF THE AV NODE AND ATRIAL CONTRACTION. THE QRS COMPLEX CORRESPONDS TO THE SIMULTANEOUS REPOLARISATION OF THE ATRIA AND DEPOLARISATION AND CONTRACTION OF THE VENTRICLES (SYSTOLE). THE T WAVE CORRESPONDS TO REPOLARISATION OF THE VENTRICLES. 39 FIGURE 3-5 – SPECT – MULTIPLE PLANAR GAMMA CAMERA IMAGES ARE TAKEN AT A RANGE OF
VIEWING ANGLES WHICH CAN BE RECONSTRUCTED TO GENERATE A TRANSAXIAL VIEW OF THE DISTRIBUTION OF RADIOACTIVE TRACER IN THE MYOCARDIUM. 42 FIGURE 3-6 – TRANSAXIAL SPECT IMAGES ACQUIRED AT STRESS (ROWS 1 & 3) AND REST (ROWS 2 & 4)
IN 10 SLICES THROUGH THE HEART. A REVERSIBLE PERFUSION DEFECT IN THE ANTERIOR WALL MANIFESTS AS AN UNDER-PERFUSED AREA AT STRESS WITH NORMAL PERFUSION REST. 43 FIGURE 3-7 – CARDIAC SPECT ECG GATING. THE ECG RR INTERVAL IS BROKEN DOWN INTO N TEMPORAL
BINS. DATA ACQUIRED DURING EACH TEMPORAL BIN FROM MULTIPLE RR-INTERVALS IS
AVERAGED TO CREATE A SERIES OF IMAGES REPRESENTING ONE HEART BEAT. 44 FIGURE 3-8 – COINCIDENCE DETECTION IN PET. A POSITRON TRAVELS A SMALL DISTANCE BEFORE
DETECTED WITHIN A SMALL TEMPORAL WINDOW AT TWO POINTS IN THE PET DETECTOR RING. THE LINE CONNECTING THE TWO DETECTORS IS THE LINE ALONG WHICH THE ANNIHILATION
EVENT MUST HAVE OCCURRED. 46
FIGURE 3-9 – THE AHA SEGMENTATION MODEL. THREE TRANSAXIAL IMAGING SLICES AND A LONG-AXIS VIEW (A) ARE SUBDIVIDED INTO A 17 SEGMENT BULLS-EYE VIEW (B). THIS CAN BE USED TO EACH TERRITORY TO THE CORRESPONDING CORONARY ARTERY (C). 53 FIGURE 4-1 – SEMI-QUANTITATIVE ANALYSIS PARAMETERS. DIAGRAM SHOWING THE BASELINE (SIBL)
AND PEAK HEIGHT SI VALUES FOR THE AIF (SIPK_AIF) AND MYOCARDIUM (SIPK_MYO) AS WELL AS THE AIF (USAIF) AND MYOCARDIAL (USMYO) UP-SLOPES AND THE AREA UNDER THE MYOCARDIAL CURVE
UP TO THE AIF PEAK POSITION (AIFMYO). 56
FIGURE 4-2 - A SINGLE COMPARTMENT MODEL. IT IS A CLOSED SYSTEM IN THAT IT HAS A SINGLE INPUT CA(T) AND OUTPUT CV(T). THE SYSTEM IS STATIONARY IF THE DISTRIBUTION OF FLOWS F1:N REMAINS CONSTANT OVER THE DURATION OF THE MEASUREMENT. THE SYSTEM IS LINEAR IF THE RESPONSE OF THE MYOCARDIAL TISSUE TO AN INJECTED DOSE IS LINEARLY PROPORTIONAL TO
THAT INJECTED DOSE. 59
FIGURE 4-3 – L-CURVE ANALYSIS - THE Y-AXIS (LOG||LX||) SHOWS THE SMOOTHNESS CONSTRAINT ALONE, WHILST THE X-AXIS PLOTS ONLY THE UNCONSTRAINED SOLUTION LOG||AX-Y||. THE ‘X’ MARKS THE OPTIMAL Λ VALUE WHERE NEITHER COMPONENT IS DOMINANT. 65 FIGURE 4-4 – CONTRAST AGENT ENTERS THROUGH A SINGLE INPUT WITH CONCENTRATION CA(T) AND
LEAVES WITH CONCENTRATION CV(T). CONTRAST AGENT FLOWS ACROSS THE CAPILLARY
MEMBRANE FROM THE VASCULAR SPACE TO THE EXTRAVSACULAR, EXTRACELLULAR SPACE (EES). CONTRAST AGENT CANNOT PASS THROUGH CELL MEMBRANES INTO THE INTRACELLULAR SPACE.
66 FIGURE 4-5 – THE TWO COMPARTMENT EXCHANGE MODEL. CONTRAST AGENT FLOWS AT A RATE FP
INTO THE VASCULAR SPACE OF VOLUME FRACTION VP. INDICATOR LEAKS BETWEEN THE
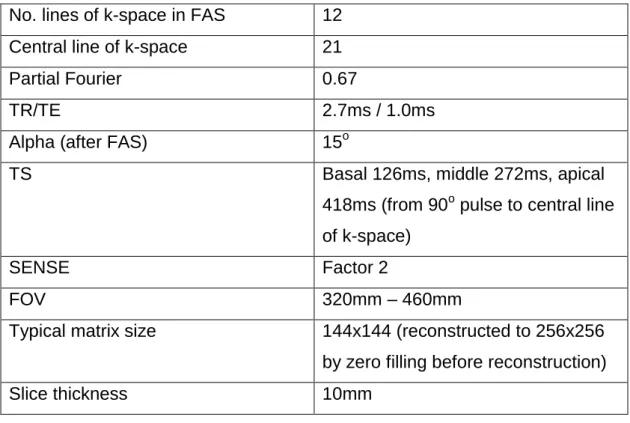
VASCULAR SPACE AND THE EES (VOLUME FRACTION VE) AT A RATE DICTATED BY THE PRODUCT OF THE CAPILLARY SURFACE AREA S AND PERMEABILITY P. 67 FIGURE 5-1 – CE-MARC PERFUSION PULSE SEQUENCE. A SINGLE, SHARED 90O SATURATION PULSE IS
USED GIVING SATURATION TIMES (TS) FOR THE BASAL, MIDDLE AND APICAL CARDIAC SLICES OF 126MS, 272MS AND 418MS RESPECTIVELY AND RESULTING IN DIFFERENT T1-WEIGHTING AND
CARDIAC PHASE FOR EACH OF THE THREE SLICES. 73
FIGURE 5-2 – THE DUAL-PHASE IMAGING SEQUENCE. IN A SINGLE RR-INTERVAL TWO SR-GRE IMAGES ARE ACQUIRED WITH EQUAL SATURATION TIMES (TS) FROM THE 90O PULSE TO THE CENTRAL LINE OF K-SPACE (KO) AND DIFFERENT TRIGGER DELAYS (TD) TO PLACE THE TWO IMAGES IN
MID-SYSTOLE AND MID-DIASTOLE. 77
FIGURE 5-3 – CONTOUR EXAMPLE FROM THE CE-MARC DATASET. MYOCARDIAL CONTOURS (GREEN), A CONTOUR WITHIN THE LEFT VENTRICULAR BLOOD POOL REPRESENTING THE AIF (RED) AND THE
REFERENCE POINT MARKER (BLUE). 80
MYOCARDIAL CONTOURING DIFFICULT. (TAKEN FROM THE SAME PATIENT AS FIGURE 5-3). 81 FIGURE 5-5 – DIAGRAM ILLUSTRATING TWO PROBLEMS WITH USING A SIMPLE BASELINE BASED ON
FIRST N=10 DATA POINTS. A) AN UNUSUALLY SHORT PRE-BOLUS TIME INCORPORATES SOME CONTRAST ENHANCED POINTS ERRONEOUSLY RAISING THE BASELINE. B) NOISE IN THE EARLY POINTS GENERATES ERRORS IN THE BASELINE THAT WOULD HAVE BEEN AVOIDED HAD N BEEN
LONGER. 83
FIGURE 5-6 – ILLUSTRATION OF THE METHOD FOR FINDING THE END OF THE BASELINE K. ALL DATA POINTS AFTER THE CURVE HAS RISEN TO HALF PEAK (X) ARE EXCLUDED. THE PIECEWISE LINEAR-LINEAR CONTINUOUS REGRESSION FITS A HORIZONTAL LINE OF AMPLITUDE ΒO TO DATA POINTS BEFORE K AND A STRAIGHT LINE OF GRADIENT M AND INTERCEPT ΒO TO POINTS FOLLOWING K. THE SOLID LINE IS THE FIT THROUGH THE INCLUDED POINT (O). 84 FIGURE 5-7 – THE AIF DATA POINTS (O) ARE SMOOTHED BY FITTING WITH A SPLINE FUNCTION (A). THE
DIFFERENTIAL OF THE SMOOTHED FUNCTION (DSI/DT) IS THEN CALCULATED (B). THE MINIMUM DSI/DT VALUE CORRESPONDS TO THE DOWNSLOPE OF THE FIRST-PASS (1). THE POINT WHERE DSI/DT NEXT CROSSES THE LINE DSI/DT=0 IS THE END OF THE FIRST-PASS (2). 86 FIGURE 5-8 - GUI ALLOWING SIMULTANEOUS VIEWING OF STRESS AND REST IMAGES, CONTRAST
UPTAKE CURVES AND ESTIMATED MBFS AS WELL AS MANUAL ADJUSTMENT OF PRE-PROCESSING PARAMETERS AND AN EXCLUSION BUTTON TO EXCLUDE THE REGION IF NECESSARY. THE BLACK CIRCLES DEPICT THE TIME ON THE CURVE THAT THE DYNAMIC IMAGE SHOWN CORRESPONDS TO
(SEE SECTION 8.3). 89
FIGURE 5-9 – MYOCARDIAL BASELINE CORRECTION WAS REQUIRED DUE TO PROBLEMS WITH THE MYOCARDIAL CONTOURS. PRE-CONTRAST CONTOURS INCORPORATED SIGNAL FROM
SURROUNDING STRUCTURES INCREASING THE BASELINE SIGNAL VALUE (PANEL A). AT CONTRAST ENHANCEMENT THE CONTOUR WAS SHIFTED SO AS NOT TO INCLUDE THESE STRUCTURES (PANEL
B). 91
FIGURE 5-10 – FAILURE IN END OF FIRST-PASS FINDING ALGORITHM DUE TO A VALLEY IN THE AIF PEAK. 92 FIGURE 6-1: SIGNAL INTENSITY VS. TIME PLOT SHOWING STRESS AND REST DATA. THE PRECONTRAST
(BASELINE) SIGNAL INTENSITY FOR THE REST SCAN IS HIGHER THAN THE NATIVE TISSUE SIGNAL INTENSITY DUE TO REMNANT CA IN THE TISSUE FROM THE STRESS SCAN. THE CALIBRATION FACTOR SHOULD BE DERIVED FROM THE STRESS PRE-CONTRAST DATA ONLY. 99 FIGURE 6-2 – ILLUSTRATION OF LONGITUDINAL MAGNETIZATION, MZ, RECOVERY IN THE SR-TFE PULSE
SEQUENCE. INITIALLY THE MAGNETIZATION RECOVERS FROM MZ(0) OVER TS TO POINT A. THE
INITIAL READ OUT FLIP ANGLE THEN REDUCES MZ TO POINT B FOLLOWED BY RECOVERY OVER TR
TO POINT C. THE MAGNETIZATION AFTER N TR READOUT PULSES IS D. 101 FIGURE 6-3 – RF PULSE AMPLITUDES DISPLAYED IN THE PHILIPS PPE ENVIRONMENT SHOWING FLIP
ANGLE EVOLUTION OVER THE INITIAL 12 LINES OF K-SPACE (RF-PULSE DURATIONS ARE CONSTANT HENCE AMPLITUDE IS PROPORTIONAL TO FLIP ANGLE). 103 FIGURE 6-4 – MEASURED RF AMPLITUDES (POINTS) AND CALCULATED VALUES USING EQUATION 6-15.
104 FIGURE 6-5 – SIGNAL INTENSITY (S) VS. CONCENTRATION (C) AS SIMULATED WITH T2* EFFECTS (SOLID
LINE) AND WITHOUT T2* EFFECTS (DOTTED LINE). 108
FIGURE 6-6 - EVOLUTION OF SIGNAL INTENSITY (MZ) SIMULATED WITH AND WITHOUT INCORPORATING
FAS. THE CENTRAL LINE OF K-SPACE IS DENOTED KO. [LEFT PANE] SIMULATION WITH NATIVE
T1=1393MS. [RIGHT PANE] SIMULATION WITH T1 ESTIMATE AT PEAK OF AIF (T1=50MS). 112
FIGURE 6-7 – SIGNAL INTENSITY VS. T1 CURVES FOR SR-TFE IGNORING (SOLID LINE) AND INCLUDING
(DOTTED LINE) FAS [TOP PANEL]. ABSOLUTE [CENTRAL PANEL] AND PERCENTAGE [BOTTOM
PANEL] DIFFERENCES BETWEEN THE MODELS. 113
FIGURE 6-8 – BLAND ALTMAN COMPARISON OF MPR VALUES GENERATED USING SIGNAL TO
CONCENTRATION CONVERSIONS INCORPORATING AND NOT INCORPORATING FAS. 115 FIGURE 6-9 – BOXPLOTS SHOWING THE DISTRIBUTION OF STRESS MBF VALUES FOR EACH ASSUMED T1
VALUE (A), THE CORRESPONDING DISTRIBUTIONS FOR REST MBF VALUES (B) AND MPRS (C). 119 FIGURE 6-10 – SIGNAL VS. T1 ALLOWING Ψ ONLY AS A FREE PARAMETER. PANELS A, B AND C
CORRESPOND TO PERFUSION SLICE 1 (APICAL), SLICE 2 (MIDDLE) AND SLICE 3 (BASAL) WITH TS 418MS, 272MS AND 126MS RESPECTIVELY AND WERE FITTED BY THE MODEL WITH AN R2 OF 0.99
IN EACH CASE. 124
FIGURE 6-11 - SIGNAL VS. R1 ALLOWING BOTH Ψ AND Α AS FREE PARAMETERS. PANELS A, B AND C
CORRESPOND TO PERFUSION SLICES 1 (APICAL) ,SLICE 2 (MIDDLE) AND SLICE 3 (BASAL)
RESPECTIVELY AND WERE FITTED BY THE MODEL WITH AN R2 OF 1.0 IN EACH CASE. 125 FIGURE 6-12 – MODEL FITS FOR THE MIDDLE SLICE FOR DATA ACQUIRED WITH AN ADMINISTERED FLIP
ANGLE OF A) 5O, B) 10O, C) 15O, D) 20O, E) 30O. 126 FIGURE 6-13 – ILLUSTRATION OF THE DUAL-BOLUS INJECTION METHOD AS DESCRIBED BY ISHIDA ET AL.
(131). THE PRE-BOLUS SYRINGE IS CONNECTED TO THE THREE-WAY CONNECTOR AND INJECTED INTO THE LINE BEFORE THE POWER INJECTOR FLUSHES SALINE INTO THE PATIENT. AFTER A DELAY THE PROCESS IS THEN REPEATED WITH THE FULL BOLUS SYRINGE. 131 FIGURE 6-14 – THE ANALYSIS METHOD FOR ANALYSING THE DUAL-BOLUS TECHNIQUE. THE PRE-BOLUS
MBF IS CALCULATED USING THE AIF AND MYOCARDIAL UPTAKE CURVE FROM THE PRE-BOLUS INJECTION. THE DUAL-BOLUS MBF IS CALCULATED USING THE PRE-BOLUS AIF (DOSE CORRECTED BY MULTIPLICATION BY 10) AND THE BOLUS MYOCARDIAL CURVE. AS NEITHER RESULT SHOULD EXHIBIT SIGNIFICANT NON-LINEARITY THE RESULTING MBF VALUES SHOULD NOT BE
SIGNIFICANTLY DIFFERENT. 132
FIGURE 6-15 – DIAGRAM ILLUSTRATING THE BOLUS EVALUATION EXPERIMENT. THE APPARATUS IS SET UP AS FOR A HUMAN STUDY EXCEPT THE LINE IS INJECTED INTO A PLASTIC BOTTLE. THE BOLUS SYRINGE IS DYED USING BLUE FOOD COLOURING ENABLING THE BOLUS TO BE QUALITATIVELY ASSESSED VISUALLY FOR DISPERSION AND CLEARANCE FROM THE LINE. 139 FIGURE 7-1 - A) EXAMPLE OF GENERATED CONTOUR ERRORS. THE THIN LINE SHOWS THE MANUAL
CONTOUR AND THE BOLD LINE SHOWS THE GENERATED ERRONEOUS CONTOUR GENERATED WITH A MAXIMUM DEVIATION (MD) OF 0.1MW. B) A SINGLE FRAME OF A CARDIAC PERFUSION
SEQUENCE SHOWING MANUAL CONTOURING. THE LEFT VENTRICULAR CAVITY IS FILLED WITH GD-DTPA AND APPEARS BRIGHT AGAINST THE SURROUNDING MYOCARDIUM. 145 FIGURE 7-2 - (A) A REPRESENTATION OF THE SYSTEMATIC CONTOUR ERRORS ILLUSTRATING THE
DIRECTIONS OF THE POSITIVE AND NEGATIVE ERRORS. (B) PARTITIONING OF THE MYOCARDIAL
ROI. 146
FIGURE 7-3 - GLOBAL MBF ERRORS VERSUS MD (EXPRESSED AS A FRACTION OF THE MEAN MYOCARDIAL WIDTH) FOR SYSTEMATIC CONTOUR ERRORS IN THE REST ENDOCARDIAL CONTOUR (TOP LEFT) REST EPICARDIAL CONTOUR (TOP RIGHT), STRESS ENDOCARDIAL CONTOUR (BOTTOM LEFT) AND STRESS EPICARDIAL CONTOUR (BOTTOM RIGHT). ERROR BARS SHOW THE STANDARD
DEVIATIONS. 149
FIGURE 7-4 - REGIONAL MBF ERROR VERSUS MD (EXPRESSED AS A FRACTION OF THE MEAN
MYOCARDIAL WIDTH) FOR SYSTEMATIC CONTOUR ERRORS IN THE REST ENDOCARDIAL CONTOUR (TOP LEFT) REST EPICARDIAL CONTOUR (TOP RIGHT), STRESS ENDOCARDIAL CONTOUR (BOTTOM LEFT) AND STRESS EPICARDIAL CONTOUR (BOTTOM RIGHT). 150 FIGURE 7-5 - REGIONAL MBF ERRORS DIVIDED INTO ENDOCARDIAL AND EPICARDIAL SEGMENTS VERSUS MD (EXPRESSED AS A FRACTION OF THE MEAN MYOCARDIAL WIDTH) FOR SYSTEMATIC CONTOUR ERRORS IN THE REST ENDOCARDIAL CONTOUR (TOP LEFT), REST EPICARDIAL CONTOUR (TOP RIGHT), STRESS ENDOCARDIAL CONTOUR (BOTTOM LEFT) AND STRESS EPICARDIAL CONTOUR
(BOTTOM RIGHT). 151
FIGURE 7-6 - BOX-PLOTS OF MBF ERRORS VERSUS MD (EXPRESSED AS A FRACTION OF THE MEAN MYOCARDIAL WIDTH) FOR RANDOM CONTOUR ERRORS IN THE REST ENDOCARDIAL CONTOUR (TOP LEFT), REST EPICARDIAL CONTOUR (TOP RIGHT), STRESS ENDOCARDIAL CONTOUR (BOTTOM LEFT) AND STRESS EPICARDIAL CONTOUR (BOTTOM RIGHT). LINES, BOX EDGES AND WHISKERS OF EACH BOX-PLOT CORRESPOND TO THE MEDIAN, INTER-QUARTILE RANGE AND 95% PERCENTILE RANGE OF MBF ERRORS RESPECTIVELY. THE DASHED BLACK LINES DEPICT ± ONE STANDARD DEVIATION OF THE MBF VALUES OBTAINED WITH THE MANUAL CONTOURS. 152 FIGURE 7-7 – INTERQUARTILE RANGE OF MBF ERROR FOR EACH MYOCARDIAL REGION PLOTTED
AGAINST MD (EXPRESSED AS A FRACTION OF THE MEAN MYOCARDIAL WIDTH) FOR RANDOM CONTOUR ERRORS IN THE REST ENDOCARDIAL CONTOUR (TOP LEFT), REST EPICARDIAL CONTOUR (TOP RIGHT), STRESS ENDOCARDIAL CONTOUR (BOTTOM LEFT) AND STRESS EPICARDIAL
CONTOUR (BOTTOM RIGHT). 154
FIGURE 7-8 - INTERQUARTILE RANGE OF MBF ERROR FOR EACH MYOCARDIAL REGION DIVIDED INTO ENDOCARDIAL AND EPICARDIAL SEGMENTS VERSUS MD (EXPRESSED AS A FRACTION OF THE MEAN MYOCARDIAL WIDTH) FOR RANDOM CONTOUR ERRORS IN THE REST ENDOCARDIAL CONTOUR (TOP LEFT), REST EPICARDIAL CONTOUR (TOP RIGHT), STRESS ENDOCARDIAL CONTOUR (BOTTOM LEFT) AND STRESS EPICARDIAL CONTOUR (BOTTOM RIGHT). 155 FIGURE 7-9 - DISTRIBUTION OF INTER-(A) AND INTRA-(B) OBSERVER CONTOUR ERRORS (THICK BLACK
LINES). THE CORRESPONDING DISTRIBUTIONS OF CONTOUR ERRORS BETWEEN MANUAL AND SIMULATED CONTOURS AT EACH MD SETTING ARE ALSO SHOWN (THIN COLOURED LINES). 157
FIGURE 7-10 - DISTRIBUTION OF INTER OBSERVER CONTOUR ERRORS (THICK LINES) FOR THE REST ENDOCARDIAL CONTOUR (TOP LEFT), REST EPICARDIAL CONTOUR (TOP RIGHT), STRESS
ENDOCARDIAL CONTOUR (BOTTOM LEFT) AND STRESS EPICARDIAL CONTOUR (BOTTOM RIGHT). THE CORRESPONDING DISTRIBUTIONS OF CONTOUR ERRORS BETWEEN MANUAL AND SIMULATED CONTOURS AT EACH MD SETTING ARE ALSO SHOWN (THIN LINES). 158 FIGURE 7-11 - DISTRIBUTION OF INTRA OBSERVER CONTOUR ERRORS (THICK LINES) FOR THE REST
ENDOCARDIAL CONTOUR (TOP LEFT), REST EPICARDIAL CONTOUR (TOP RIGHT), STRESS
ENDOCARDIAL CONTOUR (BOTTOM LEFT) AND STRESS EPICARDIAL CONTOUR (BOTTOM RIGHT). THE CORRESPONDING DISTRIBUTIONS OF CONTOUR ERRORS BETWEEN MANUAL AND SIMULATED CONTOURS AT EACH MD SETTING ARE ALSO SHOWN (THIN LINES). 159 FIGURE 8-1 – GUI ALLOWING SIMULTANEOUS VIEWING OF STRESS AND REST IMAGES, CONTRAST
UPTAKE CURVES AND ESTIMATED MBFS AS WELL AS MANUAL ADJUSTMENT OF PRE-PROCESSING PARAMETERS AND AN EXCLUSION BUTTON TO EXCLUDE THE REGION IF NECESSARY 173 FIGURE 8-2 – EXAMPLE OF AN EXCLUSION AS DISPLAYED IN THE PERFUSION GUI. SEGMENTS 5
(SELECTED IN THE GUI) AND 6 WERE EXCLUDED BECAUSE THE MYOCARDIUM WAS SO THIN THAT
THE UPTAKE CURVES WERE DEEMED NON-MYOCARDIAL. 176
FIGURE 8-3 – EXAMPLE OF SEVERE CHANGE IN APPARENT HEART SIZE. A SEQUENCE OF FOUR CONTIGUOUS DYNAMIC FRAMES SHOW THAT THESE FOUR IMAGES HAVE BEEN IMAGED AT DIFFERENT CARDIAC PHASES DUE TO AN ECG-GATING FAULT. NO CONTOUR CAN SATISFACTORILY BE APPLIED TO ALL THESE IMAGES VIA TRANSLATION ONLY. THE RESULTING AFFECT ON THE MYOCARDIAL UPTAKE CURVES AND PERFUSION MODEL FIT ARE ILLUSTRATED BELOW IN THE
PERFUSION GUI. 177
FIGURE 8-4 – EXAMPLE OF THE LV BLEED. THE HIGHLIGHTED REGION IN THE IMAGE SHOWS BLOOD POOL ENHANCEMENT BLEEDING INTO THE MYOCARDIAL REGION. THE SIMULTANEOUS ENHANCEMENT IN THE AIF AND MYOCARDIAL UPTAKE CURVES IS UNUSUAL (USUALLY AIF ENHANCES FIRST) AND IS PROBABLY DUE TO LV BLOOD IN THE MYOCARDIAL REGION. 178 FIGURE 8-5 – POOR CONTOURING OVER THE FIRST PASS PLACING SEGMENT 3 MORE IN THE EPICARDIAL FAT THAN THE MYOCARDIUM. THIS SEGMENT DID NOT REPRESENT THE MYOCARDIUM AND WAS
THEREFORE EXCLUDED 179
FIGURE 8-6 - ROC CURVES FOR MPRS GENERATED USING LINEAR AND NON-LINEAR CONCENTRATION
CONVERSION REGIMENS P=0.16. 183
FIGURE 8-7 – MAPPING BETWEEN CORONARY ARTERY STENOSES AND MRI SEGMENTS. CORONARY STENOSES WERE QUANTIFIED USING X-RAY ANGIOGRAPHY AT THE LABELLED SITES IN A). EACH ARTERY WAS CLASSED AS ISCHAEMIC IF ANY OF THE SITES LISTED IN B) WERE FOUND TO HAVE >70% NARROWING. THE MYOCARDIAL SLICES IMAGED AS ILLUSTRATED IN C) WERE SUBDIVIDED AND REARRANGED INTO THE BULLSEYE PLOT D) WHERE THEY WERE ASSIGNED TO A
CORRESPONDING CORONARY ARTERY ACCORDING TO THE AHA RECOMMENDATIONS. 189 FIGURE 8-8 – ROC CURVES FOR A) ALL REGIONS AND STENOSES INCLUDED IN THE ANALYSIS, B) ONLY
FIGURE 8-9 – ROC CURVES GENERATED USING THE MEAN AND THE MINIMUM OF ALL THE REGIONS AS
THE MPR FOR DIAGNOSIS. 193
FIGURE 8-10 – ROC CURVES GENERATED USING DATA FROM ALL THREE SLICES VERSUS DATA FROM THE
MIDDLE SLICE (SLICE 2) ONLY. 194
FIGURE 8-11 – ROC CURVES GENERATED USING AHA REGIONS VERSUS THOSE GENERATED USING ONLY
THE GLOBAL MYOCARDIAL MPR 195
FIGURE 9-1 – BLAND-ALTMAN COMPARISON PLOTS FOR REST MBF FOR ALL MODELS. SOLID LINE SHOWS MEAN BIAS, DASHED LINES SHOW CONFIDENCE INTERVALS. (AXES SCALES LOCKED FOR
COMPARISON). 205
FIGURE 9-2 – BLAND-ALTMAN COMPARISON PLOTS FOR STRESS MBF FOR ALL MODELS. SOLID LINE SHOWS MEAN BIAS, DASHED LINES SHOW CONFIDENCE INTERVALS (AXES SCALES LOCKED FOR
COMPARISON). 206
FIGURE 9-3 – BLAND-ALTMAN COMPARISON PLOTS FOR MPR FOR ALL MODELS. SOLID LINE SHOWS MEAN BIAS, DASHED LINES SHOW CONFIDENCE INTERVALS (AXES SCALES LOCKED FOR
COMPARISON). 207
FIGURE 9-4 - ROC CURVE COMPARISONS BETWEEN EACH OF THE MODELS (P-VALUES SHOWN IN 209 FIGURE 9-5 – EXAMPLE OF A FAILURE IN THE UPTAKE CURVE PROCESSING. THE RED DOTTED CURVES
ARE THE AIFS, THE GREEN ARE THE MYOCARDIAL UPTAKE CURVES, BLACK SOLID LINES ARE THE MODEL FIT LINES. THE BLUE DOTTED CURVE IS THE UPTAKE PLOT (TISSUE VS. SUM OF AIF). THE RED CROSS MARKS THE CUT-OFF POINT DICTATED BY THE PEAK OF THE AIF. A SHALLOW UPTAKE CURVE RESULTS IN A POOR CHOICE OF DELAY TIME SHIFT DT (A). WHEN THE UPTAKE CURVE (B) IS PLOTTED, NOISE IN THE AIF COUPLED WITH AN EARLY CUT-OFF POINT RESULTS IN A NEGATIVE FIT TO THE DATA (UP TO THE CUT-OFF POINT) GIVING A NEGATIVE MBF. FOR ILLUSTRATION
PURPOSES THE PROBLEM HAS BEEN CORRECTED BY MANUALLY CORRECTING THE DELAY TIME
SHIFT DT IN PANES (C) AND (D). 210
FIGURE 9-6 – EXAMPLE OF A MODEL INDEPENDENT DECONVOLUTION FAILURE. DUE TO THE HIGH FREQUENCY ‘SPIKES’ IN THE LATTER PORTION OF THE TISSUE CURVE (A) THE L-CURVE ANALYSIS HAS A DOUBLE CORNER (B). THUS A SMALL Λ VALUE HAS BEEN CHOSEN (RED CROSS) CAUSING INSUFFICIENT SMOOTHING IN THE RESPONSE FUNCTION (C) AND A SUBSEQUENT HIGH, AND INCORRECT, MBF. FOR ILLUSTRATION PURPOSES THE CORRESPONDING PLOTS WHEN THE Λ VALUE HAS BEEN MANUALLY CORRECTED TO THE SECOND L-CURVE POINT ARE ALSO SHOWN
(D-F). 212
FIGURE 9-7 – AGGREGATE FLOW-WEIGHTED IMPULSE RESPONSE FUNCTIONS FOR FERMI-CONSTRAINED DECONVOLUTION, ONE COMPARTMENT MODEL AND MODEL-INDEPENDENT DECONVOLUTION. THE SOLID LINE IS THE MEAN RF AT THE GIVEN TIME WITH STANDARD DEVIATIONS SHOWN AS
List of abbreviations
2CXM – Two Compartment eXchange Model AHA – American Heart Association.
AIF – Arterial Input Function ANOVA – Analysis Of Variance AUC – Area Under Curve BAT – Bolus Arrival Time
bSSFP – Balanced Steady State Free Precession CA – Contrast Agent
CABG - Coronary Artery Bypass Graft CAD – Coronary Artery Disease
CE-MARC – Clinical Evaluation of MAgnetic Resonance imaging in Coronary heart disease.
CER – Contrast Enhancement Ratio CFR – Coronary Flow Reserve CHD – Coronary Heart Disease CMR – Cardiac Magnetic Resonance CNR – Contrast to Noise Ratio
CT – Computed Tomography
DCE – Dynamic Contrast Enhanced DRA – Dark Rim Artifact
DTPA - Diethylene Triamine Pentaacetic Acid EBCT – Electron Beam CT
ECG – Electrocardiogram
EES – Extracellular, Extravascular Space ETL – Echo Train Length
ETM – Extended Tofts Model EPI – Echo Planar Imaging FAS – Flip Angle Sweep FFE – Fast Field Echo
FFR – Fractional Flow Reserve FT – Fourier Transform
Gd - Gadolinium
GRE – Gradient Recalled Echo GUI – Graphical User Interface Hct – Hematocrit
HD – Haussdorff Distance HU – Hounsfield Units
IHD – Ischaemic Heart Disease IR – Inversion Recovery
IRSE – Inversion Recovery Spin Echo LA – Left Atrium
LAD – Left Anterior Descending artery LCX – Left CircumfleX artery
LMS – Left Main Stem LV – Left Ventricle
MBF – Myocardial Blood Flow MD – Maximum Deviation MIBI - MethoxyIsoButylIsonitrile ModI – Model Independent
MOLLI – Modified Look-Locker Inversion Recovery MPI – Myocardial Perfusion Imaging
MPR – Myocardial Perfusion Reserve MRI - Magnetic Resonance Imaging MW – Myocardial Width
NSF - Nephrogenic Systemic Fibrosis OneCP – One ComPartment model
PCI – Percutaneous Coronary Intervention PET – Positron Emission Tomography
PTCA- Percutaneous Transluminal Coronary Angioplasty QCA – Quantitative Coronary Angiography
RA – Right Atrium
RCA – Right Coronary Artery ROC – Receiver Operator Curve ROI – Region of Interest
RF – RadioFrequency
rFOV - rectangular Field Of View RV – Right Ventricle
SA - SinoAtrial
SD – Standard Deviation SE – Spin Echo
SENSE – SENSitivity Encoding SI – Signal Intensity
SNR – Signal to Noise Ratio
SPECT – Single Photon Emission Computed Tomography SR – Saturation Recovery
SVD – Singular Value Decomposition
99m Tc – Technetium (A metastable isomer of Technetium-99)
T1 – longitudinal, spin-lattice, relaxation time
T2 – transverse, spin-spin, relaxation time
TD – Trigger Delay TFE – Turbo Field Echo TE – Echo Time
TI – Inversion Time TR – Repetition Time TS – Saturation Time
1. Introduction
1.1. Background
Coronary heart disease (CHD) is the formation of plaque in the coronary arteries that supply blood to the heart. The resulting arterial narrowing can reduce blood flow to the heart causing myocardial ischaemia leading to painful angina symptoms. Complete obstruction, most commonly through thrombus formation on a vulnerable plaque, may result in myocardial infarction (cardiac cell death), know as a heart attack. CHD affects 2.7 million people in the UK (1) but, if a patient is diagnosed, there is an effective treatment by coronary
angioplasty or coronary bypass grafting (see section 3.3).
The methods for diagnosing CHD and myocardial ischaemia are many and varied (see section 3.4). However, the role of magnetic resonance imaging (MRI) in the assessment of myocardial perfusion is becoming more and more recognised within the cardiology community. At the time of writing two of the largest clinical trials for cardiac MR perfusion have shown that the cardiac dynamic contrast enhanced (DCE)-MRI perfusion test is as specific and more sensitive than the current standard assessment, nuclear medicine, in
diagnosing CHD (2,3). Furthermore, there is reason to hope that these figures will improve in the future as subendocardial defects become more easily
detectable with ever increasing image resolution and signal to noise ratio (SNR) capabilities in MRI.
These assessments were performed using a visual analysis of the MR data. Corresponding large scale diagnostic performance studies using quantitative myocardial blood flow (MBF) estimates based on cardiac DCE-MRI data are lacking. Such studies would show whether quantitation can improve diagnosis of CHD. Of particular interest is the impact on diagnosing three vessel disease, where stenoses in all three coronary vessels can confound visual detection as there is no healthy myocardium to compare against. Apart from the extra
complexity and time-consuming nature of many aspects of quantitative image acquisition and analysis, a further obstacle to researchers seeking to undertake such trials is the lack of consensus on the analysis method.
Image Acquisition Localisation Uptake Curve (SI -> Conc.) Perfusion Model Diagnosis MBF Mapping Quantitative
Figure 1-1 – Flow diagram depicting the analysis pathway for quantitative DCE-MRI cardiac perfusion. After the DCE-DCE-MRI dataset has been acquired the myocardium and blood pool arterial input function (AIF) must be identified on every image frame (localisation). Typically the myocardium is then subdivided into regions related to different coronary arteries (mapping). Signal intensity (SI) vs. time uptake curves must then be generated from each frame and then
converted to contrast agent concentrations. A perfusion model is then applied to the two uptake curves in order to generate a quantitative estimate of
myocardial blood flow (MBF). This MBF value must then be interpreted in order to make a diagnosis as to whether the myocardial region is ischaemic or not. Only quantitative, or semi-quantitative, analysis requires the steps within the box.
The analysis pathway for quantitative perfusion is outlined in Figure 1-1. Each of the steps in Figure 1-1 has been the subject of substantial research effort and, as a result, there are a variety of techniques available to tackle each one and each solution has its own set of advantages and disadvantages. This leaves the research community with a vast array of options for performing quantitative analysis. The lack of a standardised consensus approach for quantifying MBF limits the generalisability of any trial using quantitative MBF
values, as any differences in methodology could feasibly affect the results. What evidence is there upon which to formulate a consensus methodology? Validation of each new innovation has been in terms of the measured MBF, either using animal studies, or an independent measurement in humans such as PET. One comparison of quantitative perfusion models on the same dataset has been performed showing good agreement of MBF values between
perfusion models (4). However, differences in MBF between different studies can be quite profound. For example compare the results of (5) and (6) rest MBF 0.52 + 0.11 ml/g/min to 0.88 + 0.28 ml/g/min and stress MBF 1.78 + 0.53 ml/g/min to 2.32 + 0.46 ml/g/min. Both of these studies were performed in healthy volunteers having previously reported good correlations with PET.
The ultimate purpose of the MBF measurement is to diagnose ischaemia. Therefore, the most powerful evidence base for a consensus opinion on quantitative analysis is a comparison of diagnostic performance between
methods on real-world clinical data. Differences observed in terms of diagnostic performance will have a more profound influence on clinical choices, and real-world clinical datasets differ from healthy volunteer studies. Clinical datasets are more prone to patient dependent problems, such as poor breath-holding and unreliable ECG data, and of course include perfusion defects and lower MBF values. Therefore, when attempting to distinguish methods for clinical use, it is important to use data that includes patients suffering from CHD. Furthermore, in the context of imperfect, real-world imaging it may be that the distinguishing factor between methods is not the accuracy of the measurement but the robustness to imperfections in the datasets enabling application to a wider cohort of patients.
1.2. Aims
The primary aim of this research was to compare quantitative perfusion models in terms of diagnostic performance. This involved providing a method for non-linear conversion of the MR signal to contrast agent concentration values and automated methods for processing large volumes of DCE-MRI data. A
comparison of methodologies for obtaining a diagnosis from MBF estimates has also been performed. The aims of this research are related to the
methodological steps outlined in Figure 1-1 as follows:
Aim 1 – To compare quantitative perfusion models in terms of diagnostic performance (perfusion model).
Aim 2 – To compare methodologies for interpreting regional quantitative MBF estimates in terms of diagnostic performance (mapping).
Aim 3 – To provide myocardial contour error tolerance levels for quantitative perfusion purposes (localisation).
Aim 4 – To provide a methodology for converting MR signal values to
concentrations, specific to the pulse sequence used in this research (uptake curve).
Aim 5 – To provide fully automated quantitative perfusion uptake curve processing algorithms.
1.3. Overview
Chapter 2 provides a description of the basic physics of MRI before describing the imaging pulse sequences applied to cardiac perfusion imaging. The choices and compromises that must be made when designing a perfusion imaging sequence are then described taking into account the extra
considerations pertinent to quantitative imaging.
Chapter 3 gives a brief description of cardiac anatomy and physiology before describing coronary heart disease and its treatment. A review of medical imaging modalities for diagnosing CHD and myocardial ischaemia is given before a more detailed discussion is made of the advantages and
disadvantages of cardiac perfusion MRI including a review of the diagnostic performance literature.
Chapter 4 provides an explanation of the models used to make estimates of MBF. Semi-quantitative methods are described briefly before a detailed mathematical description of the quantitative methods used in this thesis is given.
Most of the research presented in this thesis is based on two datasets. Chapter 5 describes in detail the acquisition protocol for the dual-phase study and the CE-MARC trial. The original purposes of the investigations are given along with the pulse sequence parameters. A description of the manual contouring
methodology applied in all cases is then provided. The automated methods used for uptake curve pre-processing (prior to quantitative analysis) are then described and tested qualitatively.
Chapter 6 explains the method used to convert signal intensity values into contrast agent concentrations. The pulse sequence for the acquisition of the perfusion DCE-MRI data is represented as a mathematical model. The assumptions of this model are then tested using computer simulations. The model is then further tested using images acquired of a T1-gel phantom using
the perfusion imaging sequence.
Chapter 7 describes a novel method used to derive tolerance limits for
myocardial contours. In order to assess the affect of myocardial contour errors on MBF estimates, contour errors are simulated on manual contours applied to a dataset of healthy volunteers. These simulations are used to describe the relationship between contour errors and MBF errors. This relationship is then used to provide a basis for setting an allowable error rate in the context of global and regional perfusion analysis.
Chapter 8 describes the subset of patients taken from the CE-MARC trial before describing the exclusion process for this dataset. The dataset is then used to investigate whether the non-linear concentration conversion described in
chapter 6 improves diagnostic power. Separate investigations are then performed to attempt to find the best way to use regional MBF estimates for diagnosing myocardial ischaemia. The use of separate MPR cut-offs for each of the coronary arteries is investigated. An investigation into whether the mean or minimum regional MPR value should be used is conducted. Finally the comparative power of using only the middle imaging slice, as opposed to all three slices, is carried out and the diagnostic performance when global analysis is used instead of regional analysis is evaluated.
In chapter 9 four quantitative perfusion methods are compared in terms of diagnostic performance. Model-independent deconvolution, Fermi-constrained deconvolution, the uptake model and the one-compartment model are
implemented on the entire CE-MARC subset. The diagnostic performance of these four models is then compared using the methods derived in chapter 8.
Chapter 10 draws general conclusions from the research described in this thesis, details the limitations of the research and provides recommendations for future work.
2. Background: perfusion MRI physics
2.1. Introduction
Although the basics of MRI have been described many times in the literature this thesis will have cause to analyse the evolution of longitudinal magnetization Mz in detail and so would not be complete without a description of this concept.
Numerous MRI texts have described the basics of magnetic resonance with reference to spin-up and spin-down energy eigenstates. However, other
authors argue that this has led to confusion and that the classical description is adequate for understanding magnetic resonance imaging (7,8). For this reason the description given in this thesis follows that of Levitt (8), and is an entirely classical description. After describing the origins of the MR signal, the basic gradient recalled echo sequence is described. A brief description of the extensions to this sequence that are most commonly applied in cardiac perfusion imaging is then presented. A discussion of the multiple factors that must be taken into account when designing a perfusion sequence and the inevitable compromises that must be struck between competing demands on the resulting image is then given. This latter part is based on sections of a review paper recently published in JCMR (9), written by the author of this thesis.
2.2. The origin of the MR signal
Nucleons possess a magnetic moment and an angular momentum by virtue of an intrinsic property called „spin‟. The spin angular momentum S and magnetic moment μ are proportional to each other and are oriented either parallel or anti-parallel to each other dependent on the sign of the gyromagnetic ratio :
Bo
μ
ωo
Figure 2-1 - In the presence of an external magnetic field, Bo, the spin magnetic moment precesses around Bo at an angular frequency describing a cone shape.
The spin angular momentum is a vector which can point in any direction in three-dimensional space, thus the magnetic moment can also point in any direction. In the presence of an external magnetic field, Bo, the combination of
the angular and magnetic moments of the spin causes it to precess around the external magnetic field describing a cone, keeping a constant angle between the spin magnetic moment and Bo (Figure 2-1). The frequency of precession is
known as the Larmor frequency, , and is given by the Larmor equation:
Equation 2-2
2.3. Longitudinal recovery
By virtue of the fact that the spins are initially randomly orientated the net magnetization over any macroscopic sample is zero. Once placed into an external magnetic field the spins all precess at the same angular frequency (assuming a completely homogeneous Bo) but this has no affect on the net