Image memorability across longer time intervals
Lore Goetschalckx, Pieter Moors, Johan Wagemans
Laboratory of Experimental Psychology, KU Leuven, Leuven, Belgium
Corresponding author: Lore Goetschalckx, Laboratory of Experimental Psychology, KU Leuven, Tiensestraat 102, Leuven 3000, Belgium. [email protected]
This work was supported by a personal fellowship awarded to Lore Goetschalckx by the Research Foundation - Flanders (FWO; Grant 1108116N) and by a Methusalem grant awarded to Johan Wagemans by the Flemish Government (METH/14/02).
Disclosure statement: The authors report no conflicts of interest. Word count: 4766
Image memorability across longer time intervals
You may find some images easier to remember than others. Recent studies of visual memory have found remarkable levels of consistency for this inter-item variability across observers, suggesting that memorability can be considered an intrinsic image property. The current study replicated and extended previous results (Isola et al., 2014), while adopting a more traditional visual long-term memory task with retention intervals of 20 min, one day, and one week, as opposed to the previously used repeat-detection task, which typically relied on short retention intervals (5 min). Our memorability rank scores show levels of consistency across observers in line with those reported in previous research. They correlate strongly with previous quantifications and appear stable over time. Furthermore, we show that the way consistency of memorability scores increases with the number of responses per image follows the Spearman-Brown formula. Interestingly, our results also seem to show an increase in consistency with an increase in retention interval. Supported by simulated data, this effect is attributed to a decrease of extraneous influences on recognition over time. Finally, we also provide evidence for a log-linear, rather than linear, decline of the raw memorability scores over time, with more memorable images declining less strongly.
Keywords: image memorability; time; scenes; visual memory; long-term memory Imagine scrolling down your Facebook newsfeed. In just a few minutes, you encounter tens of images. Not all these images have equal probability of being remembered and recognized later. Indeed, according to Isola, Xiao, Parikh, Torralba, and Oliva (2014), images differ in memorability. They were the first to show that these differences are highly consistent across observers, meaning that different people tend to forget and remember the same images. They designed a repeat-detection memory game to quantify the memorability of 2222 scene images from the SUN-database (Xiao, Hays, Ehinger, Oliva, & Torralba, 2010). The game involved participants watching a stream of images and having to press a button whenever they saw a repeat of a previously shown image. The initial presentation of a target image (i.e., an image the researchers wanted to
quantify) and its repeat were separated by about a hundred filler images, corresponding to a retention interval of roughly 5 min. Participants did not know which images were fillers and which were targets and thus had to memorize them all. An image’s
memorability score was calculated as the percentage of participants correctly
recognizing an image upon its repeat. The high levels of consistency found for the rank scores suggest that image memorability can be considered an intrinsic image property. The finding has since been replicated with different image sets, such as other scene images (Bylinskii, Isola, Bainbridge, Torralba, & Oliva, 2015), face images
(Bainbridge, Isola, & Oliva, 2013), visualizations (Borkin et al., 2013), and a huge image set consisting of images of different kinds (LaMem; Khosla, Raju, Torralba, & Oliva, 2015).
To the best of our knowledge, all previous studies on image memorability have used the repeat-detection memory game to collect behavioural memorability scores. Isola et al. (2014) believe their game taps into long-term memory because of the large number of images participants have to retain and because the retention interval exceeds the duration of short-term memory. Although the capacity of short-term memory is indeed generally said to be around seven items (Miller, 1956) or even less (Cowan, 2001), and its duration merely a few seconds, the repeat-detection memory game is still a rather atypical task in the literature on visual long-term memory. A typical visual long-term memory task consists of two separate phases, a study phase and a delayed test phase, with a retention interval a lot longer than a few minutes (e.g., Nickerson, 1968; Shepard, 1967; Standing, 1973, Experiments 1 till 3; Standing, Conezio, & Haber, 1970).
The current study adopted a more typical visual long-term memory task than the repeat-detection game. The task started out with a study phase in which participants
memorized a series of images on a single-trial basis. A first recognition test followed immediately after the study phase. In a second session on the next day, participants completed another recognition test for the images they studied the day before. The third and final session took place one week after the study phase and comprised yet another recognition test. Each test phase concerned a different subset of the set of images in the study phase. The order of the three subsets was counterbalanced in a Latin square design, which enabled us to quantify each image of the study list on memorability at three different retention intervals, without having to test participants for the same image twice.
One aim of the current study was to see if we could replicate the consistency results of Isola et al. (2014) using the task described above instead of the repeat-detection memory game. Using images sampled from their set, we were also able to compare the ranking of the images based on the memorability scores collected here and the ones they reported. Another aim was to evaluate the consistency of memorability rankings over time (i.e., across different retention intervals). Isola et al. already touched upon this question by varying the number of fillers between the initial presentation of a target and its repeat in the game. They found considerable consistency over time, with Spearman’s rank correlations (ρ) between .57 and .67. However, they only went up to retention intervals of 40 min, whereas the current study tested retention after as long as one week. Furthermore, we asked how the memorability scores themselves evolve with time. Khosla et al. (2015) stated that memorability declines log-linearly over time, thereby referring to Isola et al. We evaluated whether our data offer support for this claim. A final question addressed here is whether the memorability of an image is also associated with its time course. Perhaps the more memorable images are less prone to forgetting over time.
Method
Participants
A total of 82 participants took part in the first session of this study (66 women, 16 men,
Mage = 21 years, age range: 17–46 years). Eighty returned for the second session and of
those 80, 77 also returned for the third session. Due to technical failures, the data of two participants’ first recognition test had to be excluded. The study was approved by the Ethical Committee of the Division of Humanities and Social Sciences, KU Leuven, Belgium and was carried out in accordance with the Code of Ethics of the World Medical Association (Declaration of Helsinki). All participants gave informed consent at the start of each session. As compensation for their participation, they received either course credits or a monetary reward up to €12, depending on how many sessions they attended.
Stimuli
The study set comprised a selection of 342 images of those quantified on memorability by Isola et al. (2014). The images originally came from the SUN-database (Xiao et al., 2010). They are ordinary photographs of 256 by 256 pixels depicting scenes. With regard to the three test phases (see below), the study set was further divided into three subsets (A, B, and C) of equal size (114 images). The selection and the division were carried out quasi-randomly with the constraint that the full list as well as the individual subsets represented a wide range of memorability scores (comparable mean and
standard deviation). In addition, 49 images were randomly selected from Isola et al.’s filler set to function as filler images for the vigilance task in the study phase (see below). Finally, another 342 images were randomly selected from Isola et al.’s filler set for each participant separately to function as foils during the test phases.
Procedure
Participants were invited to the lab for three different sessions. In each session, they were seated individually in front of a computer. The first session consisted of a study phase, in which participants were presented with the full study set, immediately followed by a test phase, in which they performed a recognition test for one subset of the studied images. Two additional test phases followed in the second and third session, taking place one day and one week (plus or minus one day) after the first, respectively. We will refer to the three test phases as Test 1, Test 2 and Test 3. Participants were never tested for the same subset twice. Specifically, the assignment of the subsets to the different test phases followed a Latin square design (see Figure 1). This design enabled us to assess the memorability of the 342 images of the study set at three different retention intervals. Note that for Test 1, the retention interval corresponds to the duration of the study phase (i.e., roughly 20 min, see below).
[Figure 1 near here]
Study Phase
In the study phase, all 342 images of the study set were presented on screen one by one for a fixed duration of 1 s each. The order of the images was randomized and they were intermixed with 49 filler images (each shown twice). The interstimulus interval (ISI) was 1.4 s. During this interval, participants saw a neutral fixation circle. The
instructions were to try to memorize the images in preparation of a recognition test. In addition, participants simultaneously performed a vigilance task where they had to press the spacebar whenever the same image was presented twice in a row. This was only the case for filler images, which were of no further interest to the research questions. Participants were not informed that filler images would not be part of the recognition
tests. Feedback was presented for hits and misses only, in the form of a green “+” (hit) or a red “x” (miss) replacing the neutral fixation circle in the ISI. The vigilance task was intended to keep participants attentive and motivated. The study phase lasted for
roughly 20 min in total, including five short breaks of 20 s at regular intervals.
Test Phase
Each of the test phases comprised a recognition test for a different subset of the studied images. In such a recognition test, the images of the subset, further referred to as targets, were randomly intermixed with an equal number of foil images. The task for the
participants was to distinguish targets from foils. They were made aware of the fact that an image was either a target or an image that had not been shown before. Like targets, foils only appeared in one test phase and were never repeated in other test phases. A total of 228 images per test phase were presented on screen, one by one. Participants were instructed to press the spacebar whenever they recognized an image from the study phase and to do nothing otherwise. Responses were allowed from stimulus onset until the end of the ISI. The stimulus disappeared when a response was made or after a maximum presentation duration of 3 s. The ISI had a fixed duration of 1.4 s and
involved the presentation of a neutral fixation circle, unless it was replaced by feedback. Feedback was presented for hits and false alarms only, in the form of a green “+” (hit) or a red “x” (false alarm). A test phase lasted for roughly 20 min in total, including five short breaks of 20 s at regular intervals.
Results
We calculated three memorability scores for each target image, one per retention interval. Following Isola et al. (2014) this score was calculated as the proportion of participants correctly recognizing the image in the test phase. Table 1 shows descriptive
statistics for the memorability scores obtained in this way. In addition, Figure 2 shows six example images along with their memorability scores. Note that, as opposed to Isola et al., our design does not allow for false alarm rates to be calculated per image. In Isola et al.’s repeat-detection game a “target” presented for the first time was in fact a foil and participants responding to it were making a false alarm. In the current study, a target never adopted the role of foil. Moreover, as the actual foils in our study were randomly selected for each participant separately, a particular foil would only be presented to a small number of participants and calculating a false alarm rate per foil image would therefore be meaningless too. We do, however, provide the mean and standard deviation of false alarm rates per participant in Appendix A, along with other signal detection theory measures (hit rate, d’, and β; Macmillan & Creelman, 2005). Appendix A also contains information about the performance on the vigilance task.
[Table 1 near here] [Figure 2 near here]
Consistency across Observers
To evaluate the consistency of our memorability scores across observers, we adopted a similar approach to Isola et al. (2014). That is, for every retention interval we randomly split our participant pool into two halves and calculated Spearman’s rank correlation (ρ) between the memorability scores based on the responses of the first half and those based on the responses of the second half. Repeating that for 1000 random splits resulted in a mean ρ of .50, .55, and .58 for Test 1, Test 2, and Test 3, respectively. Isola et al. reported a split-half consistency estimate of .75 for the total image set. Because they shared their data, we were also able to retrieve the estimate for the selection of images used here: .68. However, they collected 78 responses per image on average. In the
current study, each image was presented only to an average of 26 participants per retention interval (see Figure 1). To allow for a fair comparison, we plotted split-half consistency estimates for the memorability scores of the current study and those provided by Isola et al. in function of the number of responses per image in Figure 3. This is comparable to the way Isola et al. visualized their data. When the number of responses per image is taken into account, it can be seen that the level of consistency across observers for memorability scores in the current study is as least as high as what was found by Isola et al. Furthermore, when collapsing over all three retention intervals, the resulting split-half consistency estimate equalled .76 with an average number of responses per image of 79. Finally, the fact that the images used here had already been quantified by Isola et al. made it possible to assess the consistency with an even higher number of responses. Combining responses from both studies yielded an average number of responses per image of 157 and a split-half consistency estimate as high as .85
[Figure 3 near here]
Figure 3 offers two additional valuable findings. One relates to the dashed lines, which represent predicted consistencies based on the Spearman-Brown formula (Brown, 1910; Spearman, 1910). More specifically, the Spearman-Brown formula was applied to the split-half consistency corresponding to the maximum number of responses available for each retention interval, to predict the split-half consistencies corresponding to any other number of responses from there. The predictions seem to fit the data remarkably well.
The other finding is that the level of consistency increases with increasing retention intervals. A possible explanation for this finding is that over time, the probability of recognizing an image might become increasingly dependent on the
intrinsic memorability of the image and less so on extraneous influences. Figure 4 shows simulation results in support of this explanation.
[Figure 4 near here]
We first simulated a condition in which the true memorability scores for each image were drawn from a uniform distribution (minimum 0, maximum 1). Those scores were then used to sample hits (or misses) from a binomial distribution, implying there were no extraneous influences. This procedure yielded a simulated data set similar in structure to the behavioural data obtained in our experiment. All data-analytic steps reported above were then applied to this simulated data set. In three other simulation conditions, memorability scores of each image were jittered by adding a sample of independent Gaussian zero-mean noise to the images for each observer separately. To maintain a range between 0 and 1, the scores were first transformed with a logit transform, then jittered, and finally transformed back with a logistic transform. The rationale behind this approach was that this simulates extraneous influences such as attentional effects, observer-specific strategies, etc., which could influence recognition performance. The three conditions differed in the SD of the Gaussian noise, with higher
SD representing a larger role for extraneous influences. The simulated results obtained in this way replicate, at least qualitatively, the behavioural results and suggest that the increase of the consistency of memorability scores over time might indeed be attributed to a decreasing role of extraneous influences.
Importantly, Figure 4 also contains a simulation condition in which the
memorability scores were drawn from a uniform distribution for each combination of an observer and an image separately. This final condition was intended to simulate a scenario in which there is no such thing as the intrinsic memorability of an image. The memorability scores are then fully random and not dependent on the image. The results
show that in such a scenario, there would be no consistency across observers, not even with many responses per image. This strengthens the conclusion that the high
consistency levels in the behavioural data can indeed be considered evidence for memorability being an intrinsic image property.
Consistency across Studies
Even though the participants in the current study seem to show at least as much mutual agreement when it comes to which images they remember or forget as the participants in Isola et al. (2014), this does not necessarily imply that the two groups also have to agree with each other. Therefore, we also correlated the memorability scores at each of the three retention intervals of the current study to those provided by Isola et al. Of the three retention intervals, the one of Test 1, roughly 20 min, comes closest to Isola et al.’s 5 min and also shows the strongest correlation: ρ = .67. This is remarkably high, considering the difference in paradigm, the difference in retention interval and the fact that the consistency within both datasets is high, though not perfect. Indeed, the upper bound of the observed correlation between two measures is not 1, but instead is limited to the square root of the product of their reliabilities (Spearman, 1904). Having shown the applicability of the Spearman-Brown formula (Brown, 1910; Spearman, 1910) in the previous paragraph, we applied it here to estimate the full reliability of both sets of memorability scores based on their split-half consistencies. Using the correction for attenuation formula based on the estimated reliabilities, the resulting upper bound for the correlation in question was .73. Where the correlation for Test 1 seemed remarkably strong, the correlation for the other retention intervals were somewhat weaker, though still substantial: ρ = .59 for Test 2 and ρ = .50 for Test 3, with estimated upper bounds of .76 and .77, respectively. These results further demonstrate the high level of
indication of the consistency over time (i.e., across different retention intervals). We evaluate the consistency over time more directly in the next paragraph.
Consistency over Time
Do the images coming out on top (or at the bottom) of the memorability ranking at a short retention interval also score well (or badly) at a longer retention interval? To evaluate the consistency of our memorability ranking across time, we compared the memorability scores for the three test phases. Figure 5 presents the scatter plots for the three pairwise comparisons. Memorability scores of participants tested one day after study (Test 2) correlated strongly with those of participants tested roughly 20 minutes after study (Test 1): ρ = .66. A similar result was found when comparing memorability scores at retention intervals of one week (Test 3) and one day (Test 2): ρ = .61. Finally, the rank correlation for Test 3 and Test 1, the two test phases with the largest difference in retention interval, was .48 (see Figure 5). Overall, these results show that
memorability rank scores show considerable consistency over time. [Figure 5 near here]
Time Course
In the previous paragraph, we showed that memorability rankings remain relatively stable across retention intervals up to one week. For the raw memorability scores, however, one would expect changes over time as memory performance generally declines with increasing retention intervals (e.g., Ebbinghaus, 1885). Indeed, that is what Table 1 already seems to show. Khosla et al. (2015) state that memorability declines log-linearly over time and refer to Isola et al. (2014), who collected memorability scores for three different retention intervals with the largest being 40
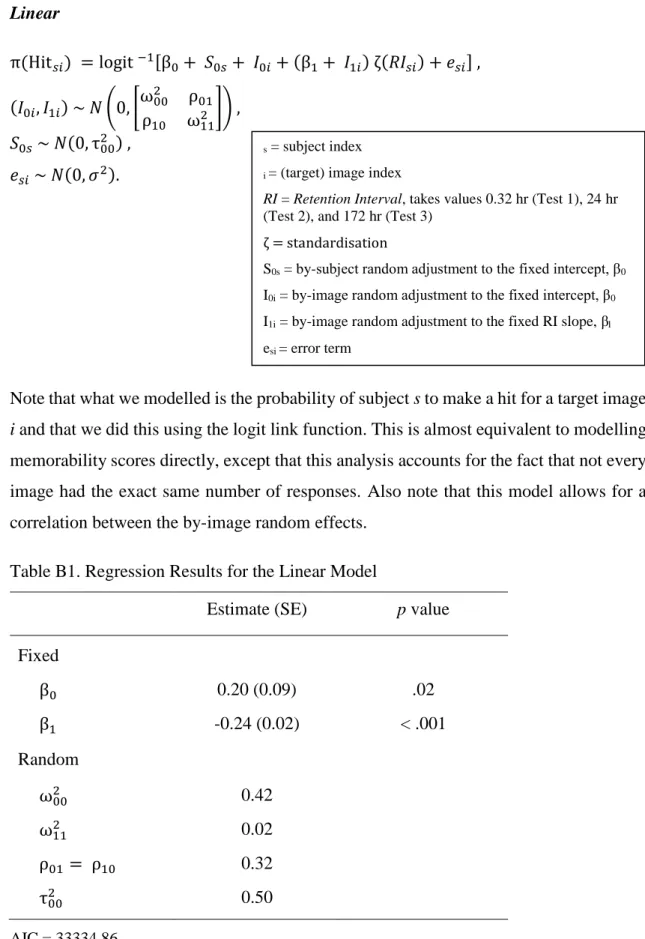
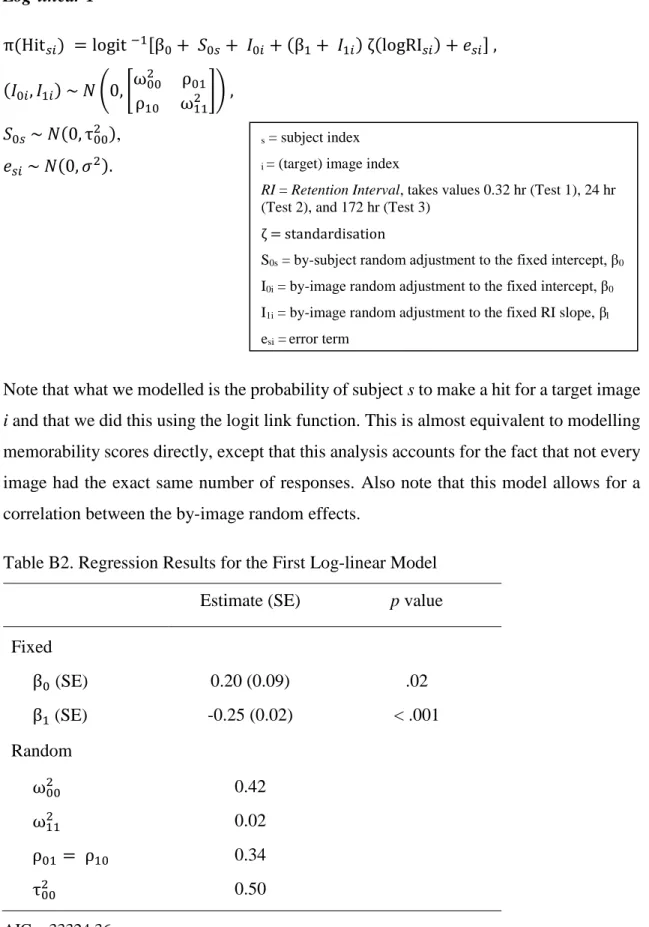
minutes. To further investigate the time course of memorability, we fitted two mixed-effects models to our data, one with the raw retention interval as predictor and one with the logarithm of the retention interval. Both models revealed a significantly negative effect of retention interval on memorability (p < .001), as expected, but the log-linear model fitted the data better according to Aikake’s information criterion (AIC). The AIC difference amounted to 10.50. The full model structures and their parameter estimates can be found in Appendix B. Thus, the current study, which investigated retention intervals up to one week, offers further support for Khosla et al.’s claim that memorability shows a log-linear relationship with time.
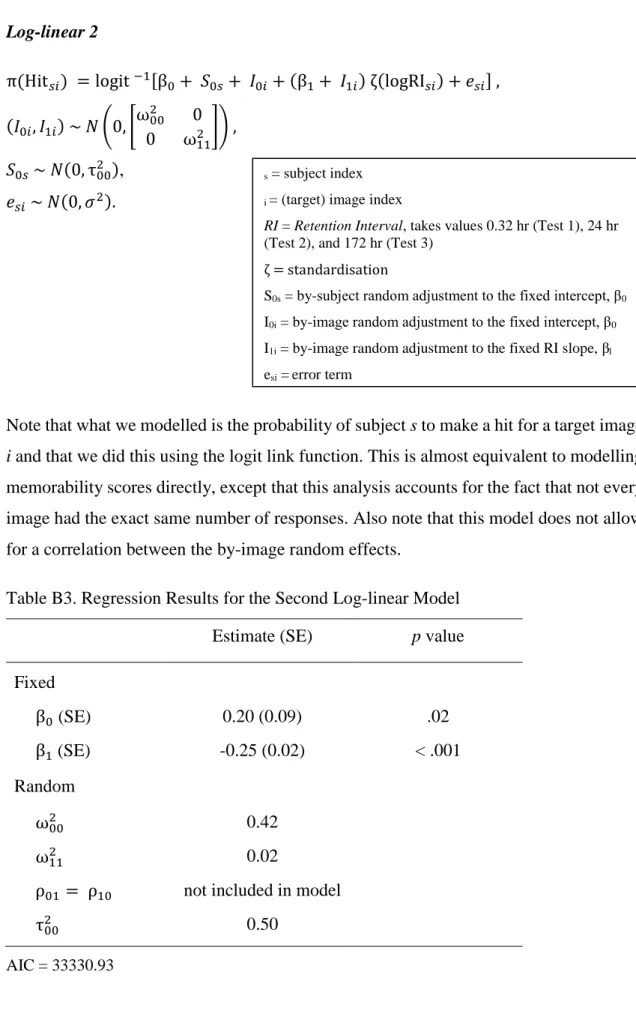
Next, we asked whether the more memorable images are also less prone to forgetting over time. Does the rate of decline depend on the baseline memorability of an image? The models described above both allowed for a correlation between the by-image random effects. The estimate for this correlation in the log-linear model equalled .34. Moreover, a second log-linear model, not allowing for a correlation, provided a significantly worse fit to the data, with an AIC difference of 6.57 (full model structure and parameter estimates in Appendix B). In other words, images with a higher intercept (i.e., higher baseline memorability) are associated with larger (or less negative) slopes (i.e. less rapid declines). This result is in line with Võ, Gavrilov, and Oliva (2013), who found decreasing rates of forgetting across lags of the repeat-detection memory game when comparing low-, medium-, and high-memorable images (in that order).
Discussion
Using a traditional visual long-term memory design, the current study first of all
replicated and extended the results of Isola et al. (2014) obtained with a repeat-detection memory game. The memorability (rank) scores collected here show high levels of
consistency across observers. This was the case at three different retention intervals: roughly 20 min, one day, and one week (plus or minus one day). Moreover, the rank scores correlate well with those reported by Isola et al and seem to remain relatively stable over time.
These results offer further support for the concept of memorability as an intrinsic image property that is consistent across observers, across paradigms, and across time. The finding that there is also large and consistent inter-item variability in the more traditional visual long-term memory design is important for memory
researchers adopting such design to compare certain conditions. Indeed, they might want to ensure their stimulus sets are well-controlled for memorability. When one decides to rely on predicted memorability scores rather than observed, we believe it is reasonable to employ the features and algorithms that have already been validated on memorability scores collected through a repeat-detection memory game (e.g., Khosla et al., 2015), as our study shows the scores are consistent across paradigms. This latter finding also opens the door for concepts and insights from the broader memory literature to be brought into memorability research and vice versa.
The consistency of memorability scores over time has implications for
researchers aiming to better understand memorability. Indeed, it suggests that one need not worry too much about complex time dependencies when investigating the
underlying factors of this property. The extension of previous memorability results to longer retention intervals further holds importance for practical applications, which indeed often deal with retention intervals longer than a few minutes (e.g., selecting memorable images for schoolbooks, websites, advertisements, etc.).
In addition, the current study found that memorability scores collected at larger retention intervals seemed to reach higher levels of consistency for the same number of
responses. It is possible that recognition performance becomes decreasingly susceptible to extraneous influences over time and increasingly dependent on the intrinsic
memorability of the image. We offer simulations in support of this explanation. Another interesting aspect of our data is that the way the consistency of memorability scores increases with number of responses is conform what one would expect based on the Spearman-Brown formula (Brown, 1910; Spearman, 1910). This means that one could estimate the full reliability of a set of memorability scores based on the split-half consistencies or estimate the required number of responses or
participants to ensure reliable measures.
Finally, the current study also investigated the time course of memorability scores. While the rank scores stay stable, the raw memorability scores decline over time and, based on current and previous results, they seem to do so log-linearly rather than linearly. Moreover, our mixed-effects models also suggest that more memorable images show slower rates of forgetting (i.e., less negative slopes across time).
Acknowledgments: We would like to thank Isola et al. (2014) for making their stimuli, data, and code publically available.
References
Bainbridge, W. A., Isola, P., & Oliva, A. (2013). The intrinsic memorability of face photographs. Journal of Experimental Psychology: General, 142(4), 1323–1334. https://doi.org/10.1037/a0033872
Borkin, M. A., Vo, A. A., Bylinskii, Z., Isola, P., Sunkavalli, S., Oliva, A., & Pfister, H. (2013). What makes a visualization memorable? IEEE Transactions on
Visualization and Computer Graphics, 19(12), 2306–2315. https://doi.org/10.1109/TVCG.2013.234
Brown, W. (1910). Some experimental results in the correlation of mental abilities.
British Journal of Psychology, 1904-1920, 3(3), 296–322. https://doi.org/10.1111/j.2044-8295.1910.tb00207.x
Bylinskii, Z., Isola, P., Bainbridge, C., Torralba, A., & Oliva, A. (2015). Intrinsic and extrinsic effects on image memorability. Vision Research, 116(Part B), 165–178. https://doi.org/10.1016/j.visres.2015.03.005
Cowan, N. (2001). The magical number 4 in short-term memory: A reconsideration of mental storage capacity. Behavioral and Brain Sciences, 24(1), 87–114. https://doi.org/10.1017/S0140525X01003922
Ebbinghaus, H. (1885). Über das Gedächtnis. Untersuchungen zur experimentellen Psychologie. Leipzig: Duncker & Humblot. Retrieved from
http://archive.org/details/berdasgedchtnis01ebbigoog
Isola, P., Xiao, J., Parikh, D., Torralba, A., & Oliva, A. (2014). What makes a
photograph memorable? IEEE Transactions on Pattern Analysis and Machine Intelligence, 36(7), 1469–1482. https://doi.org/10.1109/TPAMI.2013.200 Khosla, A., Raju, A. S., Torralba, A., & Oliva, A. (2015). Understanding and Predicting
Image Memorability at a Large Scale. In 2015 IEEE International Conference on Computer Vision (ICCV), 2390–2398. https://doi.org/10.1109/ICCV.2015.275 Macmillan, N. A., & Creelman, C. D. (2005). Detection theory: A user’s guide (2nd
ed.). Mahwah, NJ: Lawrence Erlbaum Associates.
Miller, G. A. (1956). The magical number seven, plus or minus two: Some limits on our capacity for processing information. Psychological Review, 63(2), 81–97.
https://doi.org/10.1037/h0043158
Nickerson, R. S. (1968). A note on long-term recognition memory for pictorial material.
Shepard, R. N. (1967). Recognition memory for words, sentences, and pictures. Journal of Verbal Learning and Verbal Behavior, 6(1), 156–163.
https://doi.org/10.1016/S0022-5371(67)80067-7
Spearman, C. (1904). The proof and measurement of association between two things.
The American Journal of Psychology, 15(1), 72–101. https://doi.org/10.2307/1412159
Spearman, C. (1910). Correlation calculated from faulty data. British Journal of Psychology, 1904-1920, 3(3), 271–295. https://doi.org/10.1111/j.2044-8295.1910.tb00206.x
Standing, L. (1973). Learning 10000 pictures. Quarterly Journal of Experimental Psychology, 25(2), 207–222. https://doi.org/10.1080/14640747308400340 Standing, L., Conezio, J., & Haber, R. N. (1970). Perception and memory for pictures:
Single-trial learning of 2500 visual stimuli. Psychonomic Science, 19(2), 73–74. https://doi.org/10.3758/BF03337426
Vo, M., Gavrilov, Z., & Oliva, A. (2013). Image memorability in the eye of the beholder: Tracking the decay of visual scene representations. Meeting abstract presented at VSS 2013. Journal of Vision, 13(9), 929.
https://doi.org/10.1167/13.9.929
Xiao, J., Hays, J., Ehinger, K. A., Oliva, A., & Torralba, A. (2010). SUN database: Large-scale scene recognition from abbey to zoo. In 2010 IEEE Conference on Computer Vision and Pattern Recognition (CVPR) (pp. 3485–3492).
Appendix A
General Task Performance
Table A1. Frequency of Miss Rates on the Vigilance Task
Miss rate Frequency Proportion Cumulative proportion
.00 37 .45 .45 .02 17 .21 .66 .04 11 .13 .79 .06 9 .11 .90 .08 3 .04 .94 .14 2 .02 .96 .20 1 .01 .98 .22 1 .01 .99 .24 1 .01 1.00
Note. Cumulative proportion was calculated based on raw proportions, not the rounded ones presented here. No participant was excluded based on their vigilance performance.
Table A2. Signal Detection Theory Measures for the Recognition Tests Hit rate
M (SD)
False alarm rate
M (SD) d’ M (SD) β M (SD) Test 1 .60 (.17) .12 (.10) 1.58 (0.58) 2.83 (2.68) Test 2 .55 (.16) .22 (.13) 0.98 (0.43) 1.59 (0.80) Test 3 .47 (.16) .27 (.15) 0.60 (0.35) 1.40 (0.64)
Note. For each participant, the set of signal detection measures was calculated three times (once per retention interval). The values in the table represent the mean (standard deviation) of the respective measure across participants for a given retention interval.
Appendix B Fitted GLMMs Linear π(Hit𝑠𝑖) = logit −1[β 0+ 𝑆0𝑠+ 𝐼0𝑖+ (β1+ 𝐼1𝑖) ζ(𝑅𝐼𝑠𝑖) + 𝑒𝑠𝑖] , (𝐼0𝑖, 𝐼1𝑖) ~ 𝑁 (0, [ω00 2 ρ 01 ρ10 ω112 ]) , 𝑆0𝑠 ~ 𝑁(0, τ002 ) , 𝑒𝑠𝑖 ~ 𝑁(0, 𝜎2).
Note that what we modelled is the probability of subject s to make a hit for a target image
i and that we did this using the logit link function. This is almost equivalent to modelling memorability scores directly, except that this analysis accounts for the fact that not every image had the exact same number of responses. Also note that this model allows for a correlation between the by-image random effects.
Table B1. Regression Results for the Linear Model
Estimate (SE) p value Fixed β0 0.20 (0.09) .02 β1 -0.24 (0.02) < .001 Random ω002 0.42 ω112 0.02 ρ01= ρ10 0.32 τ002 0.50 AIC = 33334.86 s = subject index
i = (target) image index
RI = Retention Interval, takes values 0.32 hr (Test 1), 24 hr (Test 2), and 172 hr (Test 3)
ζ = standardisation
S0s = by-subject random adjustment to the fixed intercept, β0
I0i = by-image random adjustment to the fixed intercept, β0
I1i = by-image random adjustment to the fixed RI slope, β1
Appendix B (continued) Fitted GLMMs Log-linear 1 π(Hit𝑠𝑖) = logit −1[β 0+ 𝑆0𝑠+ 𝐼0𝑖+ (β1+ 𝐼1𝑖) ζ(logRI𝑠𝑖) + 𝑒𝑠𝑖] , (𝐼0𝑖, 𝐼1𝑖) ~ 𝑁 (0, [ω00 2 ρ 01 ρ10 ω112 ]) , 𝑆0𝑠 ~ 𝑁(0, τ002 ), 𝑒𝑠𝑖 ~ 𝑁(0, 𝜎2).
Note that what we modelled is the probability of subject s to make a hit for a target image
i and that we did this using the logit link function. This is almost equivalent to modelling memorability scores directly, except that this analysis accounts for the fact that not every image had the exact same number of responses. Also note that this model allows for a correlation between the by-image random effects.
Table B2. Regression Results for the First Log-linear Model Estimate (SE) p value Fixed β0 (SE) 0.20 (0.09) .02 β1 (SE) -0.25 (0.02) < .001 Random ω002 0.42 ω112 0.02 ρ01= ρ10 0.34 τ002 0.50 AIC = 33324.36 s = subject index
i = (target) image index
RI = Retention Interval, takes values 0.32 hr (Test 1), 24 hr (Test 2), and 172 hr (Test 3)
ζ = standardisation
S0s = by-subject random adjustment to the fixed intercept, β0
I0i = by-image random adjustment to the fixed intercept, β0
I1i = by-image random adjustment to the fixed RI slope, β1
Appendix B (continued) Fitted GLMMs Log-linear 2 π(Hit𝑠𝑖) = logit −1[β 0+ 𝑆0𝑠+ 𝐼0𝑖+ (β1+ 𝐼1𝑖) ζ(logRI𝑠𝑖) + 𝑒𝑠𝑖] , (𝐼0𝑖, 𝐼1𝑖) ~ 𝑁 (0, [ω00 2 0 0 ω112 ]) , 𝑆0𝑠 ~ 𝑁(0, τ002 ), 𝑒𝑠𝑖 ~ 𝑁(0, 𝜎2).
Note that what we modelled is the probability of subject s to make a hit for a target image
i and that we did this using the logit link function. This is almost equivalent to modelling memorability scores directly, except that this analysis accounts for the fact that not every image had the exact same number of responses. Also note that this model does not allow for a correlation between the by-image random effects.
Table B3. Regression Results for the Second Log-linear Model Estimate (SE) p value Fixed β0 (SE) 0.20 (0.09) .02 β1 (SE) -0.25 (0.02) < .001 Random ω002 0.42 ω112 0.02
ρ01= ρ10 not included in model
τ002 0.50
AIC = 33330.93
s = subject index
i = (target) image index
RI = Retention Interval, takes values 0.32 hr (Test 1), 24 hr (Test 2), and 172 hr (Test 3)
ζ = standardisation
S0s = by-subject random adjustment to the fixed intercept, β0
I0i = by-image random adjustment to the fixed intercept, β0
I1i = by-image random adjustment to the fixed RI slope, β1
Table 1. Descriptive Statistics for Image Memorability for Three Different Retention Intervals. Min Max Mdn M SD Test 1 .21 1.00 .59 .60 .15 Test 2 .15 .96 .54 .55 .17 Test 3 .08 1.00 .48 .47 .18
Figure 1. Schematic of the Latin square design. Participants were randomly assigned to one of the three rows of the Latin square. The number of responses collected per image is indicated in each cell. This number can variate within a row as a result of dropout or exceptional removal of data files due to technical failures.
Figure 2. Six example images with their memorability scores. Each image was assigned three memorability scores, one for each retention interval—from top to bottom: Test 1 (20 min), Test 2 (1 day), and Test 3 (1 week).
Figure 3. Behavioural split-half consistency across observers in function of number of responses. Estimates are based on 1000 random splits. Nresp corresponds to the total
number of responses for an image, not to the number that goes into one half during the split-half procedure. The dashed line represents predicted consistencies based on the observed consistency where nresp is the maximum number of available responses, and
the Spearman-Brown formula (Brown, 1910; Spearman, 1910).
Figure 4. Simulated split-half consistency across observers. Estimates are based on 1000 random splits. Nresp corresponds to the total number of responses for an image, not to the
number that goes into one half during the split-half procedure. The dashed line
represents predicted consistencies based on the simulated consistency where nresp is the
maximal number of simulated responses, and the Spearman-Brown formula (Brown, 1910; Spearman, 1910). Five simulation conditions are plotted, differing in the amount of Gaussian noise. They are meant to simulate different levels of extraneous influences on recognition.
Figure 5. Consistency of memorability ranks over time. The panels show the pairwise scatter plots for the memorability scores at each of the retention intervals and the corresponding Spearman’s ρ values. The estimated upper bounds for these values are, from left to right, .69, .72, and .70.