University of Central Florida University of Central Florida
STARS
STARS
Electronic Theses and Dissertations, 2004-20192018
Learning Algorithms for Fat Quantification and Tumor
Learning Algorithms for Fat Quantification and Tumor
Characterization
Characterization
Sarfaraz HusseinUniversity of Central Florida
Part of the Computer Sciences Commons
Find similar works at: https://stars.library.ucf.edu/etd University of Central Florida Libraries http://library.ucf.edu
This Doctoral Dissertation (Open Access) is brought to you for free and open access by STARS. It has been accepted for inclusion in Electronic Theses and Dissertations, 2004-2019 by an authorized administrator of STARS. For more information, please contact [email protected].
STARS Citation STARS Citation
Hussein, Sarfaraz, "Learning Algorithms for Fat Quantification and Tumor Characterization" (2018). Electronic Theses and Dissertations, 2004-2019. 5962.
LEARNING ALGORITHMS FOR FAT QUANTIFICATION AND TUMOR CHARACTERIZATION
by
SARFARAZ HUSSEIN
B.E. NED University of Engineering and Technology, Karachi, 2011
A dissertation submitted in partial fulfilment of the requirements for the degree of Doctor of Philosophy
in the Department of Computer Science in the College of Engineering and Computer Science
at the University of Central Florida Orlando, Florida
Summer Term 2018
ABSTRACT
Obesity is one of the most prevalent health conditions. About 30% of the world’s and over 70% of the United States’ adult populations are either overweight or obese, causing an increased risk for cardiovascular diseases, diabetes, and certain types of cancer. Among all cancers, lung cancer is the leading cause of death, whereas pancreatic cancer has the poorest prognosis among all major cancers. Early diagnosis of these cancers can save lives. This dissertation contributes towards the development of computer-aided diagnosis tools in order to aid clinicians in establishing the quan-titative relationship between obesity and cancers. With respect to obesity and metabolism, in the first part of the dissertation, we specifically focus on the segmentation and quantification of white and brown adipose tissue. For cancer diagnosis, we perform analysis on two important cases: lung cancer and Intraductal Papillary Mucinous Neoplasm (IPMN), a precursor to pancreatic cancer. This dissertation proposes an automatic body region detection method trained with only a single example. Then a new fat quantification approach is proposed which is based on geometric and appearance characteristics. For the segmentation of brown fat, a PET-guided CT co-segmentation method is presented. With different variants of Convolutional Neural Networks (CNN), super-vised learning strategies are proposed for the automatic diagnosis of lung nodules and IPMN. In order to address the unavailability of a large number of labeled examples required for training, unsupervised learning approaches for cancer diagnosis without explicit labeling are proposed. We evaluate our proposed approaches (both supervised and unsupervised) on two different tumor diag-nosis challenges: lung and pancreas with 1018 CT and 171 MRI scans respectively. The proposed segmentation, quantification and diagnosis approaches explore the important adiposity-cancer as-sociation and help pave the way towards improved diagnostic decision making in routine clinical practice.
EXTENDED ABSTRACT
This dissertation explores the learning algorithms that can be used to extract imaging markers reliably so that the obesity-cancer relationship can be studied. The novel learning algorithms de-veloped in this dissertation are general and can be modified for other applications similar to those examined here. More specifically, we first investigate the automatic detection of white and brown adipose tissues using Positron Emission Tomography/Computed Tomography (PET/CT) scans and develop methods for the quantification of these tissues at the whole-body and body-region levels. We propose a patient-specific automatic adiposity analysis system with two modules i.e. detec-tion, segmentation and quantification of white and brown adipose tissue. In the first part, we detect white adipose tissue (WAT) and its two sub-types from CT scans, Visceral Adipose Tissue (VAT) and Subcutaneous Adipose Tissue (SAT). This process relies conventionally on manual or semi-automated segmentation, leading to inefficient solutions. Our novel framework addresses this chal-lenge by proposing an unsupervised learning method to separate VAT from SAT in the abdominal region for the clinical quantification of central obesity. This step is followed by a context-driven la-bel fusion algorithm through sparse 3D Conditional Random Fields (CRF) for volumetric adiposity analysis. Evaluations were performed on 151 CT scans and our proposed approach outperformed other methods by a significant margin.
In the second part of the dissertation, we automatically detect, segment, and quantify brown adi-pose tissue (BAT) using PET scans because unlike WAT, BAT is metabolically active. After iden-tifying BAT regions using PET, we perform a co-segmentation procedure utilizing asymmetric complementary information from PET and CT. Finally, we present a new probabilistic distance metric for differentiating BAT from non-BAT regions. In both parts, we perform automatic body-region detection using one-shot learning. Experimental evaluations conducted on 111 PET/CT
In the third part, we propose different supervised strategies for the characterization of lung nod-ules and Intraductal Papillary Mucinous Neoplasms (IPMN). Risk stratification of lung nodnod-ules as benign or malignant is one of the most important tasks in lung cancer diagnosis, staging and treat-ment planning. While the variation in the appearance of the nodules remains large, there is a need for a fast and robust computer-aided system. We propose a new end-to-end trainable multi-view deep Convolutional Neural Network (CNN) for nodule characterization. The trained network is used to extract features from the input image followed by a Gaussian Process (GP) regression to obtain the malignancy score. We also empirically establish the significance of different high-level nodule attributes such as calcification, sphericity and others for malignancy determination. These attributes are found to be complementary to the deep multi-view CNN features and a significant improvement over other methods is obtained.
We next propose a 3D Convolutional Neural Network (CNN) based nodule characterization strat-egy. With a completely 3D approach, we utilize the volumetric information from a CT scan which would be otherwise lost in the conventional 2D CNN based approaches. In order to mitigate the need for a large amount of training data for CNN, we resort to transfer learning to obtain highly discriminative features. Moreover, we also acquire a task-dependent feature representation for six high-level nodule attributes and fuse this complementary information via a Multi-task learning (MTL) framework.
For the diagnosis of IPMN, we propose a Convolutional Neural Network (CNN) based computer-aided diagnosis (CAD) system by utilizing multi-modal Magnetic Resonance Imaging (MRI). In our proposed approach, we use minimum and maximum intensity projections to ease the annotation variations among different slices and type of MRIs. Then, we present a CNN to obtain deep feature representation corresponding to each MRI modality (T1-weighted and T2-weighted). At the final step, we employ canonical correlation analysis (CCA) to perform a fusion operation at the feature
classification. Our results indicate significant improvements over other potential approaches to solve this important problem. The proposed approach doesn’t require explicit sample balancing in cases of imbalance between positive and negative examples. To the best of our knowledge, our study is the first to automatically diagnose IPMN using multi-modal MRI.
In medical imaging, the availability of labeled data warrants extensive commitments of time and ef-forts from radiologists. Hence, developing automated diagnostic systems with a minimum amount of training data is important. In the final part of this dissertation, we propose an unsupervised machine learning approach to perform tumor classification. First, we cluster the data into groups
and then improve the tumor classification using∝SVM which is learned on the label proportions.
We also explore the contribution of features extracted from different deep learning architectures in improving the classification. Furthermore, we study the effect of supervised learning approaches on the classification performance. Finally, we analyze unsupervised representation learning with Generative Adversarial Networks (GAN) for tumor classification. We evaluate our proposed ap-proaches for the diagnosis of lung nodules and IPMN, and obtain improved classification perfor-mance than other methods.
To my mother ~ To my father and all family
for their unconditional love, efforts and sacrifices
~
To every investor of time, effort and resources
in my learning ~
To all pursuers of knowledge and wisdom
ACKNOWLEDGMENTS
All praises are due to Allah, for countless gifts and blessings, who is the most gracious and the most merciful. I would like to thank my advisor Dr. Ulas Bagci for his efforts, guidance, and support throughout my graduate studies. I have been fortunate enough to learn not only about research but about different aspects of life which include but are not limited to commitment, discipline, and hard work. He kept me motivated during difficult phases of this journey. I’m also especially grateful to Dr. Mubarak Shah for the opportunity of working with him during the first few years of my graduate studies and for important lessons and guidelines about research. I’m very grateful to Dr. Mark Heinrich and Dr. Marianna Pensky for serving on my committee.
I would also like to thank our collaborators at the Mayo Clinic Jacksonville, namely, Dr. Michael Wallace, Dr. Juan Corrall, Dr. Pujan Kendal and Dr. Candice Bolan, as well as our collaborators at the National Institute of Health (NIH).
I would like to acknowledge the financial support for this work from Mayo-UCF Seed Funding as well as Zika Research Grant from the Florida Department of Health.
It is said that it takes a village to raise a child. This is true for a Ph.D. as well. I would like to thank all my teachers that kindled the love of knowledge in me. I would like to acknowledge Professor Shahab Tehzeeb for motivating me and guiding me towards graduate studies. I would like to thank all past and present members of CRCV including Dr. Imran Saleemi, Dr. Waqas Sultani, Dr. Khurram Soomro, Dr. Dong Zhang, Dr. Yang Yang, Mahdi Kalayeh, Harish RaviPrakash, Shervin Ardeshir, Muhammad Abdullah Jamal, Amir Mazaheri, Aliasghar Mortazi, Cherry Place, Brittany Kaval and Tonya LaPrarie for their support and good memories. I would like to acknowledge the support of all my friends, including Kumail Abbas, Shabeer Kirmani, Saad Khan, Fahd Khan,
I would also like to thank Vivek Singh and Terrence Chen from Siemens Healthineers as well as Kunlin Cao and Qi Song from CuraCloud Corporation for their support during my internships.
Last but most important, I would like to acknowledge the unconditional love and efforts of my parents, appa, brothers, sisters in law, nieces and nephews.
TABLE OF CONTENTS
LIST OF FIGURES . . . xv
LIST OF TABLES . . . xxii
CHAPTER 1: INTRODUCTION . . . 1
1.1 Segmentation and Quantification of White Adipose Tissue . . . 2
1.2 Segmentation and Detection of Brown Adipose Tissue . . . 6
1.3 Lung Nodule Diagnosis with Convolutional Neural Networks . . . 6
1.4 Diagnosis of IPMN with Multi-Modal Imaging . . . 8
1.5 Unsupervised Learning Approaches for Tumor Characterization . . . 9
1.6 Dissertation Organization . . . 10
CHAPTER 2: LITERATURE REVIEW . . . 11
2.1 Fat Segmentation and Quantification . . . 11
2.2 Malignancy Characterization of Lung Nodules . . . 12
2.3 Diagnosis of IPMN . . . 14
CHAPTER 3: SEGMENTATION AND QUANTIFICATION OF WHITE ADIPOSE
TIS-SUE . . . 17
3.1 Region Detection in whole-body CT volumes . . . 17
3.2 SAT-VAT Separation and Quantification . . . 19
3.3 Results . . . 25
3.3.1 Data for Central Obesity Quantification: . . . 25
3.3.2 Parameters and evaluations metrics: . . . 26
3.3.3 Comparisons: . . . 27
3.3.4 Computation Time: . . . 28
3.4 Summary . . . 29
CHAPTER 4: BROWN FAT DETECTION AND SEGMENTATION . . . 30
4.1 Method for BAT Detection and Segmentation . . . 31
4.2 Results . . . 36
4.2.1 Data for Quantification of BAT: . . . 36
4.2.2 Evaluation of Head-neck and Thorax Region Detection: . . . 38
4.2.3 Evaluation of BAT Delineation: . . . 39
4.2.5 Evaluation of BAT Region Proposals: . . . 40
4.3 Summary . . . 40
CHAPTER 5: SUPERVISED LEARNING FOR TUMOR CHARACTERIZATION . . . . 44
5.1 TumorNET: Lung Nodule Characterization Using Multi-View 2D Convolutional Neural Network with Gaussian Process . . . 45
5.1.1 Contributions: . . . 45
5.1.2 Materials . . . 46
5.1.3 Method . . . 47
5.1.3.1 Multiview Deep Convolutional Neural Network: . . . 47
5.1.3.2 Gaussian Process (GP) Regression: . . . 48
5.1.4 Experiments and Results . . . 49
5.1.5 Summary . . . 51
5.2 Malignancy characterization of Lung Nodules using 3D CNN Based Multi-Task Learning: . . . 53
5.2.1 Method . . . 55
5.2.1.1 Problem Formulation . . . 55
5.2.1.4 Optimization . . . 59
5.2.2 Experiments . . . 60
5.2.2.1 Data . . . 60
5.2.2.2 Results . . . 60
5.2.3 Summary . . . 63
5.3 Deep Multi-modal Diagnosis of IPMN . . . 65
5.3.1 CNN for Multi-modal Feature Representation: . . . 65
5.3.2 Feature Fusion with Canonical Correlation Analysis: . . . 67
5.3.3 Materials . . . 69
5.3.4 Experiments and Results . . . 70
5.3.5 Summary . . . 73
CHAPTER 6: UNSUPERVISED TUMOR CHARACTERIZATION . . . 75
6.1 Initial Label Estimation . . . 76
6.2 Learning with the Estimated Labels . . . 77
6.3 Calculating Label Proportions . . . 78
6.4 Experiments and Results: . . . 79
6.4.2 Classification using Supervised Learning . . . 83
6.4.3 Generative Adversarial Networks (GAN) . . . 84
6.5 Summary . . . 86
CHAPTER 7: CONCLUSION AND FUTURE DIRECTIONS . . . 88
7.1 Obesity . . . 88
7.2 Tumor Characterization . . . 89
7.3 Future Directions . . . 90
LIST OF FIGURES
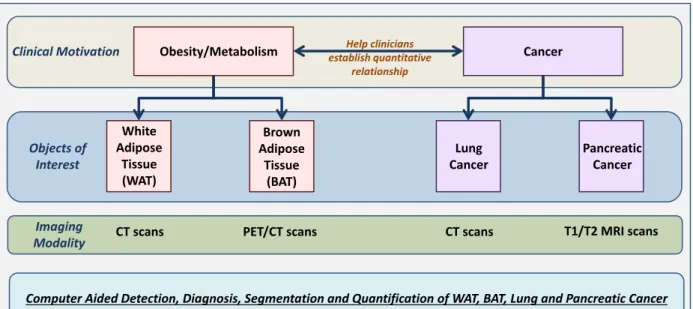
1.1 The organization of the dissertation is shown. The clinical motivation is to
help clinicians in establishing the quantitative relationship between obesity and different cancers. Image segmentation, object detection and quantifica-tion of white and brown adipose tissue drive the obesity and metabolism part of the study, whereas lung and pancreatic cancers are our focus for cancer diagnostic system. We focus on non-invasive quantification methods through radiology images. . . 3
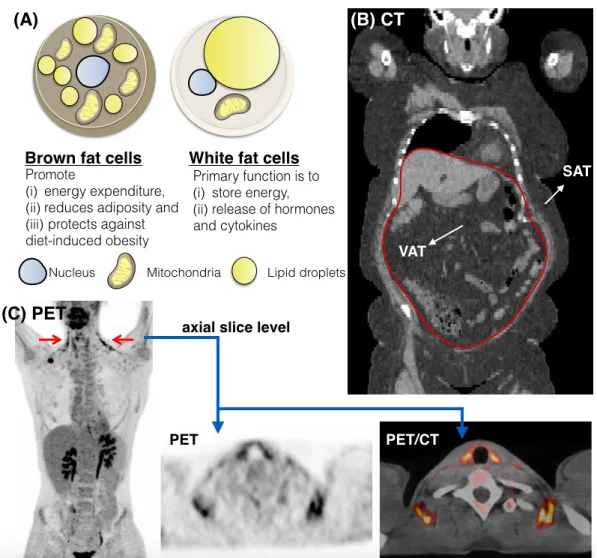
1.2 An illustration of different types of adipose tissues in Positron Emission
Tomography (PET) and Computed Tomography (CT) scans. (A) signifies the difference at the cellular level between Brown Adipose Tissue (BAT) and White Adipose Tissue (WAT). In contrast to WAT, BAT is metaboli-cally active and consumes energy. (B) shows Subcutaneous Adipose Tissue (SAT) and Visceral Adipose Tissue (VAT) in a coronal view of CT. The red boundary illustrates the thin muscular wall separating these two sub-types. The wall remains mostly discontinuous, making SAT-VAT separation signifi-cantly challenging. (C) depicts metabolically active BAT in PET (left/middle) and PET/CT fusion (right). . . 4
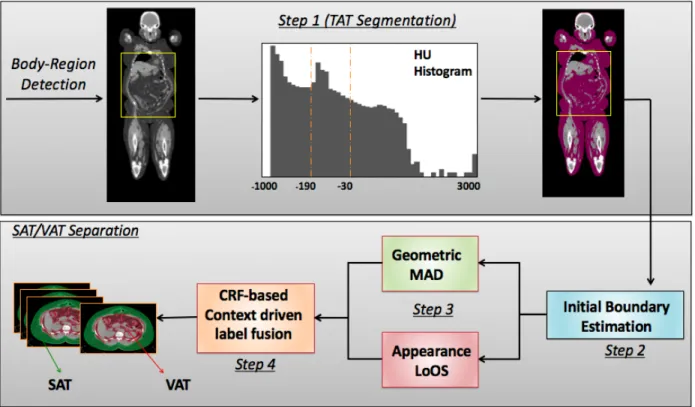
3.1 An overview of the proposed SAT-VAT separation method. Once the abdom-inal region is detected, Total Adipose Tissue (TAT) is segmented using the CT intensity interval known for fat tissue. Initial Subcutaneous-Visceral adi-pose tissue boundary is estimated by evaluating multiple hypothesis points. Geometric Median Absolute Deviation (MAD) and appearance based Local Outlier Scores (LoOS) are then combined within the 3D Conditional Random Field (CRF) based label fusion. . . 19
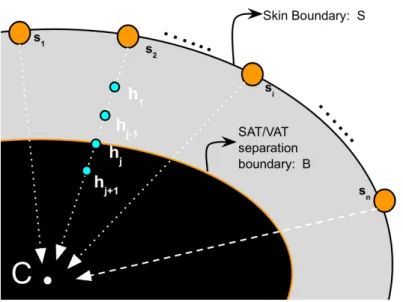
3.2 An illustration of skin boundary and hypothesis points along the radii
con-nectingSwith its centroidC. For each point (yellow) inS, a set of hypothe-ses (blue) is generated which is along the line connecting the skin boundary point with the centroidC. . . 21
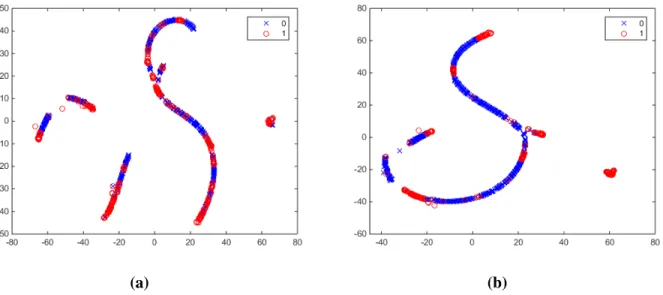
3.3 t-SNE visualizations using (a) Euclidean and (b) Normalized Correlation
dis-tances. Better separation of classes (red and blue) can be clearly seen in (b). . . . 23
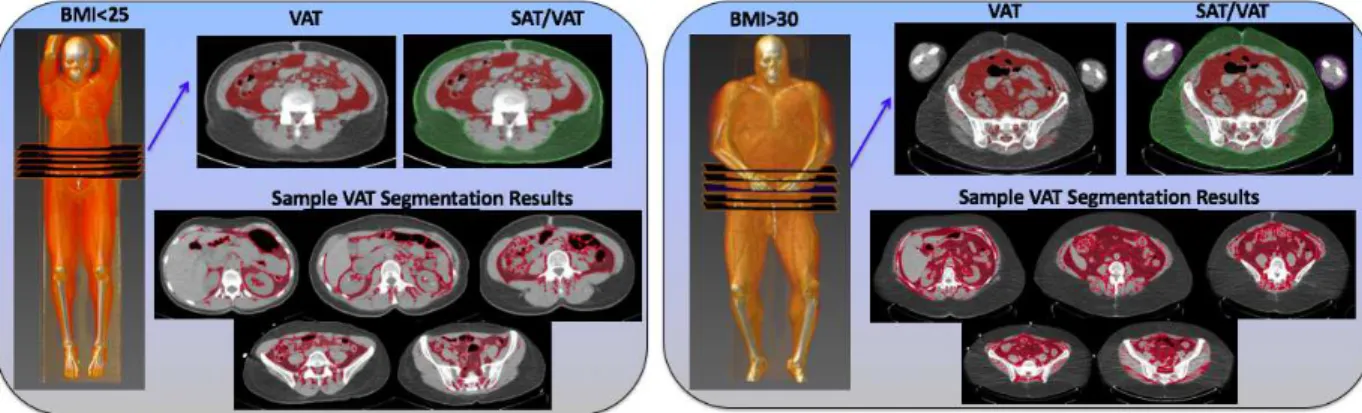
3.4 Visceral Adipose Tissue (red) and Subcutaneous Adipose Tissue (green)
seg-mentations are illustrated for two subjects (one with BMI<25, another with
BMI> 30) at the chosen abdominal slice level along with their volume
ren-derings. Several abdominal slices are also shown for central adiposity accu-mulation. . . 27
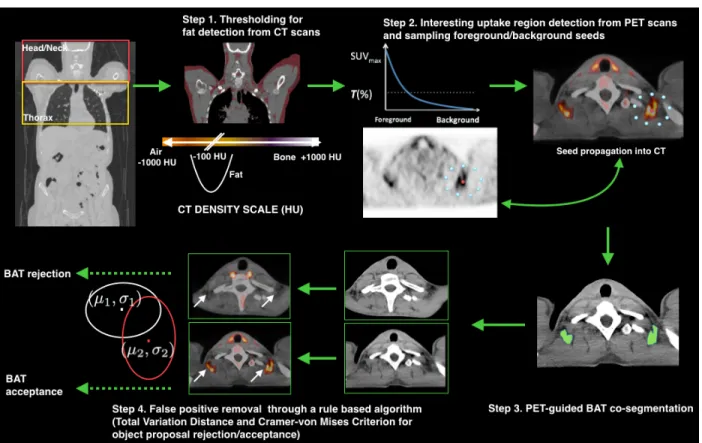
4.1 An overview of the proposed Brown Adipose Tissue (BAT) detection and seg-mentation system. Given the head-neck and thorax regions, adipose tissue is identified using CT thresholding intervals (Step 1). Using the corresponding PET scans, segmentation seeds are sampled in accordance with high uptake regions (Step 2). PET-CT co-segmentation is performed using Random Walk (Step 3) followed by false positive removal (Step 4) using Total Variation and Cram´er-von Mises distances. . . 31
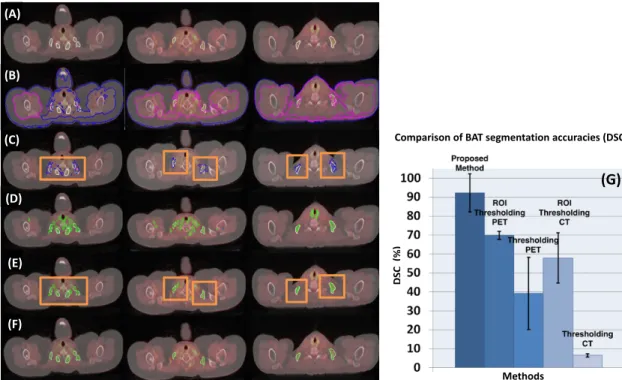
4.2 For three different anatomical levels (columns), row (A) shows reference
standards (white); row (B) demonstrates the results from CT thresholding where pink (inner) and blue (outer) contours show brown fat delineation (blue contour shows fat region near skin boundary which leaks into the body cavity and also overlaps with pink contour as in the first column); row (C) comprises the results from ROI (Region of Interest) based CT thresholding, where or-ange boxes show user drawn ROIs and blue contours are the brown fat de-lineation results; row (D) shows the results from conventional PET thresh-olding, where green contours show output BAT delineations; row (E) depicts the ROI based PET thresholding; and row (F) demonstrates the proposed al-gorithm’s delineation results using PET and CT jointly. (G) Dice Similarity Coefficients (DSC) of the proposed method in comparison with ROI based PET thresholding, PET thresholding, ROI based CT thresholding, and CT thresholding methods are shown. . . 38
5.1 An overview of the proposed method. First, the median intensity projec-tion is performed across each axis, followed by their concatenaprojec-tion as three channels of an image. Data augmentation is performed using scaling, rota-tion, adding Gaussian, Poisson, Salt and Pepper (S&P) and Speckle Noise. A CNN with 5 convolution and 3 fully connected layers is trained from scratch. For testing, the 3 channel image is passed through the trained network to get a 4096-dimensional feature from the first fully connected layer. Finally, the
malignancy score is obtained using the Gaussian Process regression. . . 46
5.2 Qualitative results showing median intensity projected images for correctly
(green) and incorrectly (red) scored lung nodules. (a) and (b) show malignant and benign nodules respectively where each row shows different cases and column represents different views (axial, sagittal, coronal). . . 52
5.3 Lung nodule attributes with different scores. As we move from the top
(at-tribute missing) to the bottom (at(at-tribute with the highest prominence), the prominence of the attributes increases. Column (a) and (b) show calcified and spherical nodules; (c) represents margin where the top row is for poorly defined nodules and the bottom row shows well-defined nodules. Column (d) and (e) show lobulated and spiculated nodules whereas (f) represents nodules with different textures. The top row in (f) represents a non-solid nodule and the bottom row shows a solid nodule. The graph in (g) shows the number of nodules with different malignancy scores . . . 54
5.4 An overview of the proposed approach. First, we fine-tune 3D CNNs using labels for malignancy and six attributes. Given the input volume, we pass it through different 3D CNNs each corresponding to an attribute (task). The network comprises 5 convolution, 5 max pooling, and 2 fully connected lay-ers. We use the output from the first fully connected layer as the feature representation. The features from different CNNs are fused together using graph regularized sparse least square optimization function to obtain coeffi-cient vectors corresponding to each task. During the testing phase, we multi-ply the feature representation of the testing image with the coefficient vector to obtain the malignancy score. . . 55
5.5 Plots to show classification accuracy against various threshold values for the
average absolute score difference. The graphs in (a) and (b) represent results from 10 different cross-validation (CV) sets. It can be seen that the classifi-cation accuracy increases, as we increase the threshold value for the absolute score difference. The graph (c) shows the improved performance of the pro-posed method in comparison with GIST+LASSO and 3DCNN with Trace Norm. . . 62
5.6 Qualitative results using our proposed approach. (a) and (b) show axial views
of benign and malignant nodules respectively, where first four columns con-sist of successful cases (where prediction was within±1 of the expert score) and the last column (after dotted line) shows failure cases. . . 63
5.7 Effect of fine-tuning on 3D CNN features. t-SNE visualization for features obtained from (a) pre-trained network and (b) network after fine-tuning. The separation between features belonging to two classes, i.e. benign nodules (represented in blue) and malignant nodules (shown in red) can be readily observed in (b). . . 64
5.8 An overview of the proposed method. First, the minimum and maximum
intensity projections are computed corresponding to T1 and T2 scans respec-tively. The intensity projections are then fed into a pre-trained Convolutional Neural Network (CNN) to obtain feature representation. Canonical Correla-tion Analysis (CCA) based feature fusion is performed in order to obtain dis-criminative and transformed feature representation. Finally, an SVM based classifier is employed to obtain the final label (normal or IPMN). . . 67
5.9 An illustration to show CCA computed between features from two different
imaging modalities i.e. T1 and T2 MRI scans . . . 68
5.10 Qualitative results of our proposed approach, showing minimum and
maxi-mum intensity projected images for T1 and T2 scans on left and right respec-tively. Each row represents a different case where the images correctly clas-sified as IPMN are shown in green, whereas the misclassification of IPMN as normal are shown in red. . . 72
6.1 An outline of the proposed unsupervised approach. Given the input images,
we compute GIST features and performk-means clustering to get the initial
set of labels which can be noisy. Using the set of labels, we compute label proportions corresponding to each cluster/group (Eq. 6.4). We finally employ
∝SVM to learn a discriminative model using the features and label proportions. 76
6.2 Representation of lung nodules in (a) axial CT slices and in (b) volume
ren-derings. The top row shows malignant nodule where the second row depicts an instance of benign nodule. The nodules are highlighted in red in (a) and are pointed by arrows in (b). . . 79
6.3 Axial T2 MRI scans illustrating pancreas. The top row shows different ROIs
of pancreas, along with a magnified view of a normal pancreas (outlined in blue). The bottom row shows ROIs from subjects with IPMN in the pancreas, which is outlined in red. . . 80
6.4 Influence of deep learning features obtained from different layers of a VGG
network with and without ReLU non-linearities. The graph on the left shows accuracy, sensitivity and specificity for unsupervised lung nodule classifica-tion (clustering), whereas the right one shows the corresponding results for IPMN. . . 82
6.5 The generator architecture of DCGAN used to perform unsupervised
LIST OF TABLES
3.1 Abdominal region detection results measured by Intersection over Union
(higher the better) and average absolute slice difference (lower the better)
along with standard error of the mean (SEM). The IoUs are in 0-1 interval. . . 26
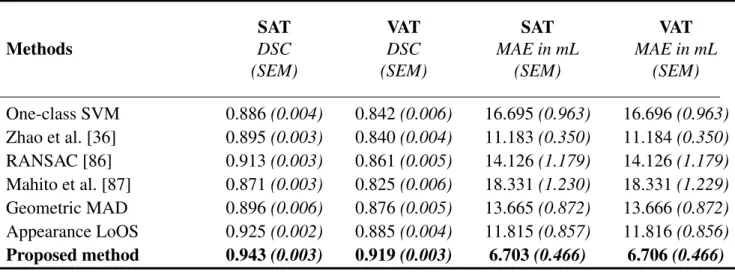
3.2 Segmentation and quantification results for Subcutaneous Adipose Tissue
(SAT) and Visceral Adipose Tissue (VAT) evaluated by Dice Similarity Co-efficient (higher the better) and Mean Absolute Error (lower the better) along
with standard error of the mean (SEM). . . 28
4.1 Head-neck and Thorax Region detection results measured by Intersection
over Union (IoU) and average absolute slice difference along with standard error of the mean (SEM). IoUs are in 0-1 interval. . . 40
5.1 Comparison of the proposed approach with Support Vector Regression,
Elas-tic Net and LASSO using accuracy measure and standard error of the mean (SEM). . . 50
5.2 Regression accuracy and standard error (SEM) using the combination of
high-level attributes and CNN features. . . 51
5.3 Classification accuracy and mean absolute score difference (lower the
bet-ter) of the proposed multi-task learning method in comparison with the other methods. . . 61
5.4 Results for accuracy, sensitivity and specificity of the proposed multi-modal fusion approach along with standard error of the mean (SEM) in comparison
with single modality and feature concatenation based approaches. . . 70
5.5 Classification accuracy along with standard error of the mean (SEM) for three
class classification (normal, low grade IPMN and high grade IPMN) of
pro-posed approach in comparison with other approaches. . . 71
6.1 Average classification accuracy, sensitivity and specificity of the proposed
unsupervised approach for IPMN and lung nodule classification with other methods . . . 81
6.2 Classification of IPMN and Lung Nodules using different features and
super-vised learning classifiers. . . 83
6.3 Supervised classification for IPMN and Lung Nodules using unsupervised
feature learning via Deep Convolutional Generative Adversarial Networks
CHAPTER 1: INTRODUCTION
The idea of automatically detecting and classifying objects with high accuracy, robustness and ef-ficiency has long enticed researchers. Several attempts have been made to model human vision capabilities into machines so as to serve this purpose. There has been an increased interest in performing automatic and computer-aided detection and diagnosis (CAD). Conventionally, radi-ologists manually analyze images to detect and diagnose clinical anomalies which can then be referred for biopsies. As medical imaging devices are becoming more and more accessible to the general population, the number of images to analyze is drastically increasing. This calls for an increased manpower (radiologists) available to analyze them. However, there is one radiologist available for 10,000 people in the United States [1]. This number soars to 100,000 for India [2] and more than 200,000 for Kenya [3]. This increases the workload of radiologists where an average radiologist analyzing MRI or CT should study one image every 3-4 seconds in an 8-hour workday to satisfy workload requirements [4]. The heavy workload leads to an increase in the number of diagnostic errors where the retrospective error rate among radiologic examinations is around 30% with real-time errors averaging around 3-5% [5]. Annually misdiagnosis results in an estimated number of 40,000 to 80,000 US hospital deaths [6].
The CAD tools can assist radiologists by providing them a second opinion for better diagnosis. Moreover, these automated tools can efficiently sift through images to mark cases which require immediate attention. The algorithms perform detection and diagnosis much faster than a human and are especially helpful where significant exertion is required such as segmentation tasks. More-over, these approaches are less prone to biases which are quite common among radiologists. The common biases in medical reasoning are analyzed in [7]. Although there are CAD tools devel-oped to detect and diagnose different pathologies, they are not accurate and robust enough to be
them inefficient for clinical applications. Moreover, there is no CAD system to help analyze the obesity-cancer association. This dissertation is an effort to bridge this gap.
The overarching goal of this dissertation is to facilitate clinicians in establishing the quantitative relationship between obesity/metabolism and cancers. In the clinical literature, the relationship between obesity and different types of cancers is thoroughly discussed, however, the use of CAD systems can help automate the process and make the study scalable to larger cohorts. Specifically, we focus on two cancer types, lung and pancreatic cancers, that are not investigated in the literature extensively in terms of metabolic health.
In order to represent metabolic information, one needs to extract fat volumetry and depot (location) in the body. In this dissertation, CAD approaches for the segmentation, detection, and quantifica-tion of white and brown fat are proposed. Moreover, methods for the diagnosis of lung cancer and IPMN which is the precursor to the pancreatic cancer are presented. The overall organization of the dissertation along with the clinical motivation, imaging modalities, and technical objectives are shown in Figure 1.1. In terms of technical contributions, we develop algorithms to extract cancer and metabolism related markers and perform their quantification and automatic characterization.
1.1 Segmentation and Quantification of White Adipose Tissue
Brown adipose tissue (BAT), brown fat, and white adipose tissue (WAT) are the two types of
adipose tissues found in mammals (Figure 1.2-A). Quantification of WAT and its subtypes is an important task in the clinical evaluation of obesity, cardiac diseases, diabetes, and other metabolic syndromes [8–10]. Among them, obesity is one of the most prevalent health conditions.
Obesity/Metabolism White Adipose Tissue (WAT) Brown Adipose Tissue (BAT)
CT scans PET/CT scans
Cancer
Lung
Cancer Pancreatic Cancer
CT scans T1/T2 MRI scans
Clinical Motivation Objects of Interest Imaging Modality Help clinicians establish quantitative relationship
Computer Aided Detection, Diagnosis, Segmentation and Quantification of WAT, BAT, Lung and Pancreatic Cancer
Figure 1.1: The organization of the dissertation is shown. The clinical motivation is to help clin-icians in establishing the quantitative relationship between obesity and different cancers. Image segmentation, object detection and quantification of white and brown adipose tissue drive the obe-sity and metabolism part of the study, whereas lung and pancreatic cancers are our focus for cancer diagnostic system. We focus on non-invasive quantification methods through radiology images.
About 30% of the world’s and over 70% of the United States’ adult populations are either over-weight or obese [11,12], causing an increased risk for cardiovascular diseases, diabetes, and certain types of cancer. Central obesity (also known as abdominal obesity) is the excessive buildup of fat in the abdominal region. Traditionally, Body Mass Index (BMI) has been used as a measure of obesity and metabolic health; however, BMI remains inconsistent across subjects, especially for underweight and obese individuals. Instead, volumetry of the abdominal fat, i.e., Visceral Adipose Tissue (VAT), is considered as a reliable, accurate, and consistent measure ofbody fat distribution. As VAT manifests itself mainly in the abdominal region, it is regarded as an important marker for evaluating central obesity. In clinical literature, the association between VAT and different diseases has been studied extensively.
Figure 1.2: An illustration of different types of adipose tissues in Positron Emission Tomography (PET) and Computed Tomography (CT) scans. (A) signifies the difference at the cellular level between Brown Adipose Tissue (BAT) and White Adipose Tissue (WAT). In contrast to WAT, BAT is metabolically active and consumes energy. (B) shows Subcutaneous Adipose Tissue (SAT) and Visceral Adipose Tissue (VAT) in a coronal view of CT. The red boundary illustrates the thin muscular wall separating these two sub-types. The wall remains mostly discontinuous, mak-ing SAT-VAT separation significantly challengmak-ing. (C) depicts metabolically active BAT in PET (left/middle) and PET/CT fusion (right).
For instance, visceral obesity quantified through Computed Tomography (CT) was found to be a significant risk factor for prostate cancer [13]. In [14], visceral adiposity was found to be a significant predictor of disease-free survival rate in resectable colorectal cancer patients. In contrast
to Subcutaneous Adipose Tissue (SAT), VAT was concluded to have an association with incident cardiovascular disease and cancer after adjustment for clinical risk factors and general obesity [15]. Speliotes et al. [16] found VAT as the strongest correlate of fatty liver among all the other factors used in their study. In [17], VAT was found to be an independent predictor of all-cause mortality in men after adjustment for abdominal subcutaneous and liver fat. This clinical evidence shows that the robust and accurate quantification of VAT can help improve the identification of risk factors, prognosis, and long-term health outcomes.
However, automatic separation of VAT from SAT in CT images is not trivial because both VAT and SAT regions share similar intensity characteristics (Hounsfield unit (HU)), and are vastly connected (Figure 1.2-B). To segregate these two tissues, radiologists usually use various morphological op-erations along with manual interactions, but this process is subjective and unattractive for routine clinical evaluations. A set of representative slices at or near the umbilical level is often used for quantifying central obesity [18]. Still, these selections do not accurately infer volumetric quan-tification. Thus, inefficient and inaccurate quantification remains a major obstacle in the clinical evaluation of body fat distribution.
Our contributions: To the best of our knowledge, the proposed system is the first fully automated method for detecting, segmenting, and quantifying SAT and VAT regions from radiology scans (CT images). First, we propose an automated abdominal and thorax region detection algorithm, based
on deep learning features. Second, we develop an unsupervised learning method for separating
VAT from SAT using appearance (via Local Outlier Scores) and geometric (via Median Absolute Deviation) cues. For volumetric quantification, we integrate contextual information via a sparse 3D Conditional Random Fields (CRF) based label fusion algorithm. Our work can be considered as the largest central obesity quantification study (151 CT scans) to date, validating accurate region and abdominal fat detection algorithms.
1.2 Segmentation and Detection of Brown Adipose Tissue
BAT is important for thermogenesis and is considered as a natural defense against hypothermia and obesity [19]. Since BAT is metabolically active, the sensitivity of Positron Emission Tomography (PET) imaging to detect BAT regions is much higher than that of Magnetic Resonance Imaging (MRI) and Computed Tomography (CT) (Figure 1.2-C). However, PET lacks specificity due to limited structural information. When combined with CT and/or MRI, both specificity and sensi-tivity are increased due to the inclusion of anatomical sites into the evaluation framework. Despite rapid improvements in the imaging facets of BAT detection, the available methods are limited to manual and semi-automated strategies; hence, they are time-consuming and non-reproducible.
Our contributions:For our contributions in BAT detection and segmentation, we first use a fixed HU interval to identify total adipose tissue (TAT) from CT images. Next, we devise a seed sampling scheme for extracting foreground and background cues from high uptake regions of PET images in head-neck and thorax regions only. The identified seeds are propagated into the corresponding CT scans as well. This is followed by a PET-guided image co-segmentation on the hypergraph (PET/CT) to delineate potential BAT regions. Lastly, for false positive (FP) rejection, we propose
a novel probabilistic metric that combines Total Variation and Cram´er-von Mises distances to
differentiate BAT regions from non-BAT regions.
1.3 Lung Nodule Diagnosis with Convolutional Neural Networks
Cancer is among the leading causes of death worldwide. Out of 8.2 million deaths due to cancer worldwide, lung cancer accounts for the highest number of mortalities i.e. 1.59 million [20]. Moreover, lung cancer still has a 5-year survival rate of 17.8% where only 15% of all cases are diagnosed at an early stage [21]. Risk stratification of lung nodules can aid in identifying cancer
stage leading to improved treatment and higher chances of survival. In addition, any significant development to accurately and automatically characterize lung nodules can save significant manual exertion as well as valuable time.
Early diagnosis is one of the ways to reduce deaths related to lung cancer [22]. In this regard, lung screening programs are especially beneficial. Low Dose CT scans are usually used to perform lung nodule diagnosis, including both detection and risk stratification. Although CT imaging remains the gold standard for lung cancer detection and diagnosis, Computer-Aided Diagnosis (CAD) and quantification tools are often necessary. Moreover, research in developing CAD algorithms can help explore the domain of imaging features and biomarkers which can be then studied by radiol-ogists to further improve clinical decision making.
The development of a fast, robust and accurate system to perform risk stratification of lung nod-ules is therefore of significant importance. Specifically, the availability of large publicly available datasets such as LIDC-IDRI from Lung Image Database Consortium [23] has helped accelerate the research in this regard. However, the variability in nodule characteristics, including shape, size, intensity, location, as well as uncertainty among radiologists’ interpretations have made this problem particularly challenging. The advancement in machine learning methods, including the development of novel classification and feature learning techniques, has increased the efficacy of this task. However, there remains a substantial progress to be done in order to develop a CAD system attractive enough to be used in routine clinical evaluations of lung nodules.
Our Contributions:
• We utilize the full potential of a deep neural network by training a 2D network from scratch on lung nodule dataset. In order to generate enough examples for training, we perform data augmentation. Finally the malignancy score is predicted with Gaussian Process Regression.
• We analyze the influence of high level nodule attributes such as calcification, lobulation, spicula-tion and others for malignancy predicspicula-tion. Our proposed approach is based on 3D CNN network with multi-task learning to jointly learn the relationship between attributes and malignancy. • We evaluate our proposed approaches on one of the largest publicly available datasets consisting
of more than 1000 low-dose CT scans.
1.4 Diagnosis of IPMN with Multi-Modal Imaging
Among all cancers, pancreatic cancer has the poorest prognosis with a 5-year survival rate of just 7% in the United States [24]. To address the problem of automatic diagnosis of pancreatic cancer, we propose a new CAD framework for Intraductal Papillary Mucinous Neoplasms (IPMN). IPMN is a mucin-producing neoplasm found in the main and branch pancreatic ducts. They are radiographically identifiable precursors to pancreatic cancer [25, 26]. If left untreated, they can progress into invasive cancer. For instance, around one-third of resected IPMNs are found to be associated with invasive carcinoma [27]. In 2012, Tanaka et al. [28] published the International consensus guidelines for the preoperative management of IPMN using radiographic and clinical criteria. These guidelines can be used in the development of CAD approaches for the separation of IPMNs from normal pancreas. The CAD approaches can yield to identify important imaging biomarkers that may assist radiologists for improved diagnosis, staging, and treatment planning.
Our Contributions:
• To the best of our knowledge, this is the first study to use deep learning for the classification of IPMN.
subjects with IPMN. We also perform further stratification of IPMN in low-grade and high-grade categories, a necessary task for the management of IPMN.
• Extensive experimental evaluations are performed on a dataset comprising 139 subjects, the largest study of IPMN to date.
1.5 Unsupervised Learning Approaches for Tumor Characterization
Medical imaging researchers are continuously working on developing tumor characterization algo-rithms and are assisted by the availability of large publicly available datasets such as LIDC-IDRI from Lung Image Database Consortium [23] for evaluation. The dataset comprising 1018 with annotations from four radiologists is one of the largest lung nodule dataset. Hence, the develop-ments and evaluations of supervised machine learning algorithms for lung nodule detection and classification are possible. Yet, at the same time, generating annotation labels for lung nodules re-mains a time-consuming task which is subject to intra and inter-observer variability among experts (radiologists).
In the final part of this dissertation, we explore the potential of unsupervised learning for tu-mor classification. Inspired by the successful application of unsupervised methods in other do-mains [29, 30], we study to extract important discriminative information from a large amount of unlabeled data. We employ both handcrafted and deep learning features extracted from pre-trained networks for classification. In order to obtain an initial set of labels in an unsupervised fashion, we cluster the samples into different groups in feature domain. We next propose to train Proportion-Support Vector Machine (∝SVM)classifier using label proportions rather than instance labels. The trained model is then employed to classify testing samples as benign or malignant.
Our Contributions:
• To the best of our knowledge, our work is the first to study the potential of unsupervised learn-ing methods for the lung nodule classification uslearn-ing both handcrafted and deep learnlearn-ing features.
• In order to alleviate the effect of noisy labels obtained during clustering, we propose to employ
∝SVM which is trained on label proportions. Instead of hard assigning label proportions, we
estimate the label proportions in a data-driven manner. We experimentally establish that learning
a discriminative model using the proposed combination of clustering and∝SVM is superior in
performance as compared to training a classifier with noisy instance level labels.
1.6 Dissertation Organization
This dissertation is organized as follows. In Chapter 2, a literature survey of different existing tech-niques regarding white adipose tissue, brown adipose tissue, supervised and unsupervised diagno-sis techniques for lung nodules and IPMN is provided. In chapter 3, we present our segmentation and quantification approach for white adipose tissues. The detection and segmentation of brown fat are described in chapter 4. In chapter 5, we propose different supervised learning techniques for the malignancy determination of lung nodules and IPMN. Chapter 6 introduces unsupervised learning approaches for tumor characterization. Finally, in chapter 7, we present conclusions and future directions.
The dissertation comprises work on white and brown fat quantification published in [31, 32], as well as lung nodule and IPMN diagnosis published in [33–35]
CHAPTER 2: LITERATURE REVIEW
2.1 Fat Segmentation and Quantification
For abdominal fat (central obesity) quantification, Zhao et al. [36] used intensity profile along the radii connecting sparse points on the outer wall (skin boundary) starting from the abdominal body center. Boundary contour was then refined by a smoothness constraint to separate VAT from SAT. This method, however, does not adapt to obese patients easily, where the neighboring subcutaneous and visceral fat cavities lead to a leakage in the segmentation. In another study, Romero et al. [37] used heuristic search strategies to generate the abdominal wall mask on a small set of representative slices. In a similar fashion, the method in [38] developed a semi-supervised segmentation method based on a hierarchical fuzzy affinity function. Its success is vague when patient-specific quan-tification is considered. Mensink et al. [39] proposed to use a series of morphological operations; however fine-tuning of the algorithm is difficult, and the process should be repeated almost for every patient when the abdominal wall is too thin. More recently, Kim et al. [40] generated a sub-cutaneous fat mask using a modified “AND” operation on four different directed masks. However, logical and morphological operations make the whole quantification system vulnerable to ineffi-ciencies. In a more advanced method such as in [41], SAT, VAT, and muscle were separated using a joint shape and appearance model, but the reproducibility of the method is highly dependent on the model at hand. Based on a similar idea as in [36], a recent method by Kim et al. [42] estimated the muscle boundary using a convex-hull and then performed smoothing by selecting points that minimize the distance between the contour and the organ regions. However, the performance is dependent on the goodness of fit of the convex-hull. Although the method addresses SAT-VAT separation at a volumetric level, it lacks the use of appearance features and volumetric smoothing which is important for improved segmentation.
Presently, there is no automated CAD system available for BAT quantification using radiology scans. Existing studies are mostly based on the qualitative observations of expert radiologists and nuclear medicine physicians. In those studies, strictly chosen specific anatomical locations were explored for BAT presence [43, 44]. The quantification process was conducted either by manual or semi-automated delineation methods. Since PET images have high contrast, thresholding and clustering-based methods are well-suited for the delineation of uptake regions. Therefore, a simple thresholding was often used for segmenting uptake regions pertaining to BAT, allowing the
extrac-tion of volumetric andSU V (i.e., “standardized uptake value”) based metrics. BAT is considered
present if there are areas of tissues that are (i) more than 5 mm in diameter, (ii) CT density is restricted to -190 to -30 Hounsfield Units (HU), and (iii) have an SUV of 18F-fluorodeoxyglucose (18F-FDG) of at least 2 g/ml [43, 44] in corresponding PET images. Here it is important to note that in [45], authors chose the thresholding value for SU Vmax >3 g/ml to identify BAT regions. Hence, there is no clear consensus on the choice of SUV for BAT regions. In the last step, regions of interest (ROIs) are manually defined to remove false positive (FP) regions from consideration. Several manual FP removal steps may be required for differentiating uptake between BAT regions and lymph nodes, vessels, bones, and the thyroid [46]. All these manual identifications require extensive user knowledge of the anatomy. Furthermore, in cases where pathologies are present,
segregating pathologies from normal variants of18F-FDG on BAT regions can be extremely
chal-lenging [19].
2.2 Malignancy Characterization of Lung Nodules
Conventionally, the classification of lung nodules was performed using hand-crafted imaging fea-tures such as histograms [47], Scale Invariant Feature Transform (SIFT) [48], Local Binary
Pat-terns (LBP) [49] and Histogram of Oriented Gradients (HOG) [50]. The extracted sets of features were then classified using a variety of classifiers such as Support Vector Machines (SVM) [51] and Random Forests (RF) [52]. Recently with the success of deep convolutional neural network (CNN) for image classification, the detection and classification applications in medical imaging have adopted it for improved feature learning and representation. Tedious feature extraction and selection can now be circumvented using supervised high-level feature learning. This has also at-tracted the attention of researchers working in lung nodule detection and classification with limited success since the feature learning and classification were considered as separate modules. In those
frameworks, a pre-trained CNN was only used for feature extraction whereas classification was
based on an off-the-shelf classifier such as RF [53, 54]. In sharp contrast to these methods, we perform an end-to-end training of CNN for nodule characterization while combining multi-view features to obtain improved characterization performance.
Conventionally, the characterization of lung nodules comprised nodule segmentation, extraction of hand-crafted imaging features, followed by the application of an off-the-shelf classifier/regressor. The method by Uchiyama et al. [47] was based on the extraction of various physical measures, including intensity statistics and then classification using Artificial Neural Networks. El-Baz et al. [55] first segmented the lung nodules using appearance-based models and used spherical harmonic analysis to perform shape analysis. The final step was the classification usingk-nearest neighbor. Proposing a study based on texture analysis, Han et al. [56] extracted 2D texture features such as Haralick, Gabor and Local Binary Patterns (LBP) and extended them to 3D. Support Vector Machine (SVM) was employed to perform the classification. In another classical work by Way et al. [57], segmentation is performed using 3D active contours followed by the extraction of texture features from the rubber band straightening transform of the surrounding voxels. The classification was performed using Linear Discriminant Analysis (LDA) classifier. In another study, Lee et al. [58] proposed a feature selection based approach using both imaging and clinical data. An
ensemble classifier, combining genetic algorithm (GA) and random subspace method (RSM) was then used to gauge feature relevance and information content. Finally, LDA was employed to perform classification on the reduced feature set.
Following up on the success of deep learning, the medical imaging community has moved from feature engineering to feature learning. In those frameworks, CNN had been used for feature extraction and an off-the-shelf classifier such as Random Forest (RF) was employed for classifi-cation [53, 54]. Recently, Buty et al. [54] combined spherical harmonics along with deep CNN features and then classified them using RF. However, the use of CNN for lung nodule classification has been confined to 2D image analysis [59], thus falling short of utilizing the important volumetric and contextual information.
Moreover, the use of high-level image attributes had been found to be instrumental in the risk assessment and classification of lung nodules. In an effort to study the relationship between nod-ules attributes and malignancy, Furuya et al. [60] found that in a particular dataset, 82% of the lobulated, 97% of the densely spiculated, 93% of the ragged and 100% of the halo nodules were malignant. Moreover, 66% of the round nodules were found to be benign. Inspired by this study, in this dissertation we utilize 3D CNN to a learn discriminative feature set corresponding to each of the 6 attributes. We then fuse these feature representations via MTL to determine the malignancy likelihood.
2.3 Diagnosis of IPMN
In the literature, there are a limited number of studies addressing the automatic diagnosis of IPMN using radiology images. Hanania et al. [61] studied the contribution of numerous low-level imaging features such as texture, intensity, and shape to perform low and high-grade IPMN classification.
In the approach by Gazit et al. [62] texture and component enhancing features were extracted from the segmented cysts. The process is then followed by a feature selection and classification frame-work. Both of these approaches [61, 62], however, are evaluated on CT images and require the segmentation of cysts or pancreas. In contrast to these methods, our approach doesn’t require prior segmentation of cysts or pancreas and is evaluated on multi-modal MRI scans rather than CT. In this dissertation, we hypothesize and evaluate the influence of complementary information in T1-weighted and T2-T1-weighted scans that can be utilized to perform improved diagnosis of IPMN.
2.4 Unsupervised Learning Approaches
Conventionally, the visual recognition and classification tasks were addressed using supervised learning algorithms which use labeled data. However, for tasks where manually generating la-bels corresponding to large datasets is laborious and expensive, the use of unsupervised learning methods is of significant value. Unsupervised techniques had been used to solve problems in various domains ranging from object categorization [29], narrated video summarization [30], text mining [63], and speech processing [64]. These methods typically relied on some complemen-tary information provided with the data to improve learning which may not be available for many classification tasks in medical imaging.
In medical imaging, there have been different approaches that used unsupervised learning for de-tection and diagnosis problems. The approach by Shin et al. [65] used stacked autoencoders for multiple organ detection in MRI scans. Vaidhya et al. [66] presented a brain tumor segmenta-tion method with stacked denoising autoencoder evaluated on multi-sequence MR images. In the work by Sivakumar et al. [67], the segmentation of lung nodules was performed with unsupervised clustering methods. In order to explore the information from unlabeled images, Zhang et al. [68]
described a semi-supervised method for the classification of four types of nodules. In sharp con-trast to these approaches, the unsupervised learning strategies presented in this dissertation don’t involve feature learning using autoencoders. Using the set of hand-crafted features, we propose an unsupervised learning approach where initially estimated labels are progressively improved. We also present a new unsupervised learning strategy with Generative Adversarial Networks (GANs).
CHAPTER 3: SEGMENTATION AND QUANTIFICATION OF WHITE
ADIPOSE TISSUE
Related Publication:
Automatic Segmentation and Quantification of White and Brown Adipose Tissues from PET/CT Scans. Sarfaraz Hussein, A. Green, A. Watane, D. Reiter, X. Chen, G.Z. Papadakis, B. Wood, A. Cypess, M. Osman, U. Bagci. IEEE Transactions on Medical Imaging (IEEE-TMI) 36.3 (2017): 734-744.
This chapter is the first part of our exploration into adiposity-cancer association. In this chapter, we present a method for the segmentation and quantification of white adipose tissue. The segmen-tation and quantification framework for white adipose tissue begins with the detection of regions of interest. In this case, white fat segmentation is performed in the abdominal region. We then estimate the initial boundary that separates subcutaneous fat from the visceral fat. The boundary is iteratively improved using geometric median absolute deviation and appearance local outlier scores. The final step involves sparse 3D conditional random fields to obtain the final SAT-VAT separation. The following sections discuss these individual steps in detail.
3.1 Region Detection in whole-body CT volumes
The input to our region detection algorithm is a whole body CT volumeI ∈RX×Y×Z. Since it is difficult to get a large amount of annotated data for training in medical imaging applications, one should resort to as few training examples as possible. Therefore, we propose a new region detection
method based on the concept ofone-shot learning, as the learners are trained only on one image to make predictions for the remaining images. The proposed region detection framework locates two slices in the CT volume, i.e., top and bottom of the region of interest (yellow box in Figure 3.1). Detecting these two slices is challenging since they can easily be confused with similarly appearing slices. Therefore, there is a need for a better feature representation. In this regard, deep learning has recently adapted quite successfully for computer vision and medical imaging applications [69, 70]. To benefit from this rich representation of image features, we use Convolutional Neural Network (CNN) features (i.e., deep learning features) as image attributes extracted from the first fully-connected layer of the pre-trained Fast-VGG Network [71]. The network comprises 5 convolution layers and 3 fully connected layers. The first, second, and fifth convolution layers are followed by a max-pooling layer by convention. In order to have faster operations, 4-pixels stride is used in the first convolution layer. The dimension of the feature vector generated for each slice is equal to 4096. Given the reference annotations of the body regions for one subject’s volumetric image, we find its Euclidean distance with the testing subjects’ images using deep learning features. For training, we use two sets of learners: positive (Dp) and negative (Dn). The testing sliceI ∈ I corresponding to the smallest distance with the positive set and largest distance with the negative set is selected as the desired result. In order to combine the probabilities pertaining toDp andDn learners, we uselogarithmic opinion pooling[72] as:
P(I) = 1 ZP(I|Dp) wP(I|D n)1−w, (3.1) whereZ = P I∈I
3.2 SAT-VAT Separation and Quantification
The proposed SAT-VAT separation framework consists of 4 steps as illustrated in Figure 3.1. Since the HU interval for certain substances such as fat, water, and air in CT remains relatively constant, it is straightforward to identify TAT using a clinically validated thresholding interval on the HU space (step 1).
Figure 3.1:An overview of the proposed SAT-VAT separation method. Once the abdominal region
is detected, Total Adipose Tissue (TAT) is segmented using the CT intensity interval known for fat tissue. Initial Subcutaneous-Visceral adipose tissue boundary is estimated by evaluating multiple hypothesis points. Geometric Median Absolute Deviation (MAD) and appearance based Local Outlier Scores (LoOS) are then combined within the 3D Conditional Random Field (CRF) based label fusion.
In step 2, we identify the initial boundary between VAT and SAT regions by conducting a sparse search over a line connecting the abdominal region center with the skin boundary (white dotted line
points: Median Absolute Deviation (MAD) coefficient and Local Outlier Scores (LoOS). In the final step, we develop a sparse 3D CRF formulation to perform the finest SAT-VAT separation utilizing shape, anatomy, and appearance cues.
Step 1: Total Adipose Tissue (TAT) Segmentation
The input to our fat quantification pipeline is the abdominal volume. By following the clinical convention, we threshold the abdominal CT volume by -190 to -30 HU interval to obtain TAT [73]. We also perform a morphological closing on the input image using a disk with a fixed radius of
rfollowed by a median filtering in anm xmneighborhood. This pre-processing is conducted to
perform noise suppression and make the volume smooth for the next phase.
Step 2: Initial Boundary Estimation
We roughly identify the skin boundary of the abdominal region by selecting the longest isoline in the thresholded image (obtained from Step 1). For each point on the skin boundary contour
S ={s1, . . . , sn}, we generate a set ofhypothesesH ={h1, . . . , hu}along the radii connectingS with its centroidC(Figure 3.2). Each hypothesis (candidate boundary location) is next verified for the possibility of being a boundary location by assessing image gradient information on the line
connecting its location to the centroid C (white arrows in Figure 3.2). The SAT-VAT separation
boundary, B = {b1, . . . , bn}, should satisfy the following condition: hj 6= hj−1 forhj ∈ B, and bi ∈ H, ∀i. As illustrated in Figure 3.2, hypothesis points change their gradients in close
vicin-ity of boundary B. These boundary points can still be noisy and may get stuck inside the small
cavities of the subcutaneous fat. To alleviate such instabilities, the next step proposes a two-stage refinement methodology.
Figure 3.2: An illustration of skin boundary and hypothesis points along the radii connectingS
with its centroidC. For each point (yellow) inS, a set of hypotheses (blue) is generated which is along the line connecting the skin boundary point with the centroidC.
Step 3: Outlier Rejection
Geometric MAD: In the first stage of the outlier removal, we apply MAD on the distances
be-tween B andS. The intuition behind this idea is that the SAT-VAT separation boundary should
maintain a smoothly varying distance from the skin boundary. However, the outliers in subcuta-neous and visceral cavities usually violate this smooth transition; therefore, we apply MAD on the
points betweenBandSto remove outliers based on the geometric information. The higher outlier
sensitivity of MAD in comparison with the mean-based method and other methods were studied in [74]. The resulting MAD coefficientΦi, for each boundary point, indicates a score for being an
outlier:
Φi = (|di−med(d)|)(med(|di−med(d)|))−1, (3.2)
where d is the Euclidean distance between S and B, di = ksi−bik2, and med is the median
outliers and subsequently removed fromB.
Local Outlier Scores: Although MAD can be quite effective in outlier rejection, there may still
be some boundary locations that potentially lead to the drift of SAT-VAT separation due to the limitations of shape/geometry based attributes. To mitigate the influence of those boundary points, we apply the second stage of the outlier rejection, integrating appearance information through Histogram of Oriented Gradients (HOG) features [75]. For each candidate boundary point, we
attach its appearance attributes (HOG) computed in ac×ccell. Since candidate boundary points
lie on a high dimensional manifold (non-Euclidean), thenormalized correlation distancecomputes
similarities of those points. This is justified by computing the proximity,Qij between boundary pointsbiandbj usingt-distributed stochastic neighborhood embedding (t-SNE) [76]:
Qij =
1 + (kbi−bjk2)−1
P
u6=v(1 + (kbu −bvk2)−1
. (3.3)
Figure 3.3 demonstrates the feature embedding visualization usingt-SNE, where better separation of features with normalized correlation distance is observed. Points not mapped together to denser regions in high dimensional feature space are considered as outliers. By following this intuition,
we obtain local outlier scores (LoOS)Π, indicating the confidence measure for each point being
an outlier [77]: Π(x) =erf P LOF(x) √ 2.nP LOF , (3.4)
whereerf is the Gaussian Error Function, and PLOF is the probabilistic local outlier factor based on the ratio of the density around pointxand the mean value of estimated densities around all the
(a) (b)
Figure 3.3: t-SNE visualizations using (a) Euclidean and (b) Normalized Correlation distances.
Better separation of classes (red and blue) can be clearly seen in (b).
Step 4: Context Driven Label Fusion using sparse 3D CRF
In order to fuse the labels of the boundary candidates across different slices of an image volume and create a fine SAT-VAT separating surface, we use sparse 3D Conditional Random Fields (CRF). In our CRF formulation, a set ofN slices is selected to construct a graphG = (V, E), where the
nodes (V) consist of only the hypothesis boundary points (not the image pixels) and the edges
(E)join neighboring boundary points in a high dimensional feature space. The labels, i.e., outlier
and SAT-VAT boundary, are considered as source and sink in the context of our work. We define unary potentialsof the CRF as the probabilities obtained after applyingk-means clustering to the normalized outlier scores of the third stage:
We define thepairwise potentialsbetween the neighboring pointsviandvj as: Ψ(ki, kj|vi, vj) = 1 1 +|φi−φj| [ki 6=kj], (3.6)
where |.| is the L1 distance, [.] is the indicator function, and φ is the concatenated vectorized
appearance and geometric features. Once unary and pairwise potentials are defined, we seek to minimize the negative logarithm ofP(k|G;w)withklabels (k∈ {0,1})and weightswas:
k∗ = argmin k,w (−log(P(k|G;w))) = argmin k,w (X vi∈V Θ(ki|vi) +w X vi,vj∈E Ψ(ki, kj|vi, vj)) (3.7)
Equation 3.7 is solved using graph-cut based energy minimization [78]. Graph-cut for more than two labels is an NP-hard problem and solved using approximate solutions. We have chosen graph-cut for minimizing the energy function defined to solve 3D sparse CRF. In contrast to level sets and loopy belief propagation methods, the graph-cut for two labels returns the global optimum in polynomial time. Additionally, graph cut formulation with a discrete binary solution space of [0,1] after linear programming relaxation (as in equation 3.7) is a convex problem. After solving equation 3.7, we fit a convex-hull around the obtained visceral boundaries and the segment inside the convex-hull is masked as VAT.
3.3 Results
3.3.1 Data for Central Obesity Quantification:
With IRB approval, we retrospectively collected imaging data from 151subjects who underwent
PET/CT scanning (67 men, 84 female, mean age: 57.4). Since CT images are from whole-body PET/CT scans (64-slice Gemini TF, Philips Medical Systems); they have low resolution, and no
contrast agent was used for scanning. In-plane spacing (xy-plane) of CT image was recorded as
1.17 mm by 1.17 mm, and slice thickness was 5 mm. The scanner parameters for the CT were as
follows: 120-140 kV and 33-100 mA (based on BMI), 0.5s per CT rotation, pitch of 0.9 and 512×
512 data matrix was used for image fusion. The field of view (FOV) was from the top of the head to the bottom of the feet. The CT reconstruction process was based on filtered back-projection algorithm. No oral or intravenous contrast was administered.
Subjects were selected to have aroughly equal distribution of varying BMIs in order to have an
unbiased evaluation. Our evaluation set comprised underweight subjects (N=20), normal subjects
(N=50), overweight subjects (N=46), obese subjects (N= 35). UB (>10 years of experience in
body imaging with CT and PET/CT interpretation) and GZP (>10 years of experience as a nuclear medicine physician and body imaging fellowship in radiology and imaging sciences) segmented fat regions by separating SAT and VAT boundary and using appropriate image post-processing such as edge-aware smoothing. Complementary to this interpretation, the participating radiologist BW (>20 years of experience in general radiology, body imaging, interventional radiology, and oncology imaging) evaluated SAT and VAT separating boundary qualitatively for both interpreters, and their segmentations were accepted at the clinical level of evaluations. This process is currently the most common procedure in creating a reference standard for segmentation evaluation [79–82].
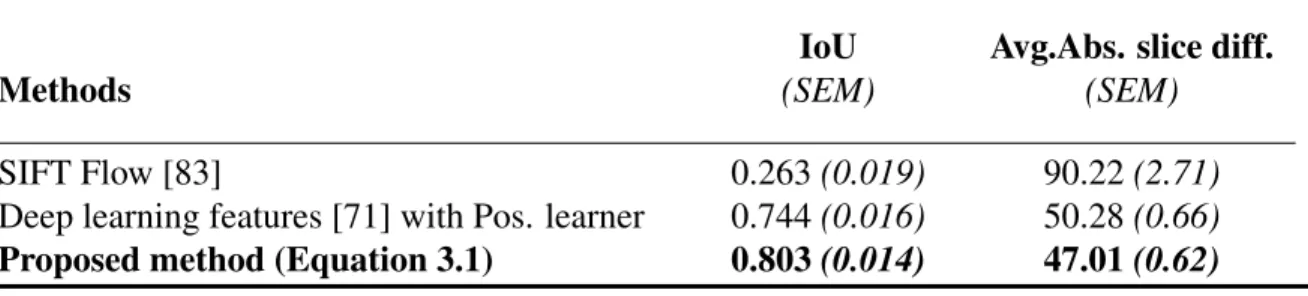
Table 3.1: Abdominal region detection results measured by Intersection over Union (higher the better) and average absolute slice difference (lower the better) along with standard error of the mean (SEM). The IoUs are in 0-1 interval.
IoU Avg.Abs. slice diff.
Methods (SEM) (SEM)
SIFT Flow [83] 0.263(0.019) 90.22(2.71)
Deep learning features [71] with Pos. learner 0.744(0.016) 50.28(0.66)
Proposed method (Equation 3.1) 0.803(0.014) 47.01(0.62)
Above 99% of agreement over Dice Similarity Coefficient (i.e. overlap ratio) was found between observers’ evaluations with no statistical difference (t-test,p >0.5).
3.3.2 Parameters and evaluations metrics:
The following parameters were noted for reproducible research in our experiments: r = 10,
m = λ = 3, t = 2.5, c = 14, w = 0.5, and N = 5. For evaluation of region detection, we
usedIntersection over Union (IoU) [84] given by: Overlap(RG,RS)
max(|RG|,|RD|), whereRG andRD were
refer-ence standard and automatically detected abdominal region, respectively. We also reported region
detection results using the absolute difference in slices between RG and RD. For segmentation
evaluation, we used widely accepted Dice Similarity Coefficient (DSC): |2I|IG∩IS|
G|+|IS|, where IG and
IS were reference standard and automatically segmented fat region, respectively. Moreover, we
measured the volumetric fat difference (in milliliters, mL) between true and segmented fat regions with Mean Absolute Error (MAE) metric.
Figure 3.4: Visceral Adipose Tissue (red) and Subcutaneous Adipose Tissue (green) segmenta-tions are illustrated for two subjects (one with BMI< 25, another with BMI> 30) at the chosen abdominal slice level along with their volume renderings. Several abdominal slices are also shown for central adiposity accumulation.
3.3.3 Comparisons:
For abdominal region detection, the upper boundary of the region was defined by the superior aspect of the liver, whereas the lower boundary was defined by the bifurcation of the abdominal aorta into the common iliac arteries [85]. As can be seen in Table 3.1, the proposed region detec-tion method significantly outperformed registradetec-tion based methods such as Scale Invariant Feature Transform (SIFT) flow [83]. Moreover, the proposed combination of positive and negative learners (Equation 3.1) provided percentage improvement of 7.9% in IoU and 6.5% reduction in average absolute slice difference, compared to only a positive learner with deep learning features.
We also performed extensive evaluations for SAT-VAT segmentation and quantification. We com-pared our method with One-class SVM, Zhao et al. [36], Random Sample Consensus (RANSAC) [86], and the state-of-the-art outlier detection method by Mahito et al. [87], which was based on iterative data sampling. In addition, we showed the results of our proposed framework’s individual steps to provide a progressive improvement in accuracy, i.e., Geometric MAD, Appearance LoOS, and the final context driven fusion using sparse 3D CRF. As mentioned above, two delineations from expert interpreters were considered for the segmentation evaluation of SAT and VAT.