IDEnet : Inception-Based Deep Convolutional
Neural Network for Crowd Counting Estimation
Samuel Cahyawijaya Institut Teknologi Bandung
Bandung, Indonesia [email protected]
Bryan Wilie Institut Teknologi Bandung
Bandung, Indonesia [email protected]
Widyawardana Adiprawita Institut Teknologi Bandung
Bandung, Indonesia [email protected]
Abstract— In crowd counting task, our goals are to estimate density map and count of people from the given crowd image. From our analysis, there are two major problems that need to be solved in the crowd counting task, which are scale invariant problem and inhomogeneous density problem. Many methods have been developed to tackle these problems by designing a dense aware model, scale adaptive model, etc. Our approach is derived from scale invariant problem and inhomogeneous density problem and we propose a dense aware inception based neural network in order to tackle both problems. We introduce our novel inception based crowd counting model called Inception Dense Estimator network (IDEnet). Our IDEnet is divided into 2 modules, which are Inception Dense Block (IDB) and Dense Evaluator Unit (DEU). Some variations of IDEnet are evaluated and analysed in order to find out the best model. We evaluate our best model on UCF50 and ShanghaiTech dataset. Our IDEnet outperforms the current state-of-the-art method in ShanghaiTech part B dataset. We conclude our work with 6 key conclusions based on our experiments and error analysis.
Keywords—crowd counting, inception network, convolutional neural network, deep learning, dense aware, scale adaptive
I. INTRODUCTION
Crowd counting is a task to perform counting on a large number of specified objects from the given image. In small number object counting, a detection based approach is likely to be used, such method works well in most low-density (sparse) image, but usually failed on a high-density (crowd) image[9][11][14]. In crowd counting task, model is developed to
fit the dense map of the image and output the total predicted count from the given image. From our analysis, there are two major problems which need to be tackled in order to get better counting estimation. The first problem is scale invariant problem which is caused by variety scale of an object from the given image. The second problem is inhomogeneous density problem which is caused by the difference density level of each crowd image. Both problems lead to the difficulty in choosing the right filter size for each image region.
To handle those problems we bring the idea from inception netwok. Inception network is divided into several repeatable kind of inception modules. Each inception module lets the network learns the best filter to be used by providing multiple paths of computational graph. Inception netwok first introduced in 2014 by Szegedy, C. et al.[1] and there have been
some countinuous improvement versions of it, starting from Inception-v1[1]; BN Inception[2]; v2 and Inception-v3[3]; Inception-v4, Inception Resnet-v1, and Inception
Resnet-v2[4]. Inception network have been evaluated against
ILSVRC dataset and resulting in a really high accuracy. In this paper, we introduce a novel approach based on Inception Network v1 called Inception Dense Estimator Network (IDEnet). There are 4 main contributions of this works. First, in section III, we show a novel methodology to
apply Inception Network idea in counting task, especially the modification to handle crowd counting task. Second, in subsection IV.B, we report our alternative results that we get when implementing some alternatives of IDEnet architecture. Third, in subsection IV.C, we evaluate our final proposed model with two publicly available crowd counting datasets (UCF50 and ShanghaiTech), and bencmark our evaluation result with other methods. Fourth, in subsection IV.D, we conduct manual error analysis to get more understanding about the counting estimation error.
II. RELATED WORKS
Works in the crowd counting task can be divided into 2 methods, detection-based and regression-based. We focus our study on regression-based methods because detection-based methods tend to severely suffer in crowd with high occlusion level[9][11][14]. Some regression analysis approaches have been
conducted for crowd counting tasks. A texture analysis with edge and foreground detection has been conducted[5] in 2005.
A bayesian poisson regression technique[6] has been evaluated on a sparse crowd image in 2009. A multiple texture analysis approach[7] has been performed by combining several texture
analysis techniques, which are head detection, fourier, wavelet transform, interest point analysis, and GLCM.
Several regression-based methods are designed to be scale adaptive. In order to be scale adaptive, most works implement a multi column network[8][9][10]. In multi column network,
input image is splited into several different subnetworks, where each subnetwork has different architecture and hyperparameters. The output from subnetworks are then merged to estimate the count. In another work, named Switching CNN[11], the network divided into a switch module
and 3 different counting modules. The switch will choose which regressor should be used for the given input image.
Some other regression-based methods utilise spatiotemporal features by using sequence of images to improve the counting quality. Xiong, F. et al.[12] utilise
convolution LSTM layer in order to process sequence of images into the estimated dense map. Liu, W et al.[13] process
sequence of images with a siamese network approach where each subnetwork will extract spatial feature from image at time T and then combined with some temporal constraints.
Another approach called scale-adaptive CNN[14], develops a scale adaptive single-column network by utilising pooling, residual, and deconvolution layer. Another work, called Pyramidal CNN[15], is estimating global and local context to achieve better estimation. In Liu et al.[16], dense rank is
generated from image and both count and rank are estimated to improve the quality of the model. Another work called DecideNet[17], use an approach similar to a multi column, but
some columns interact with another column by sending their output as one of the another column’s input.
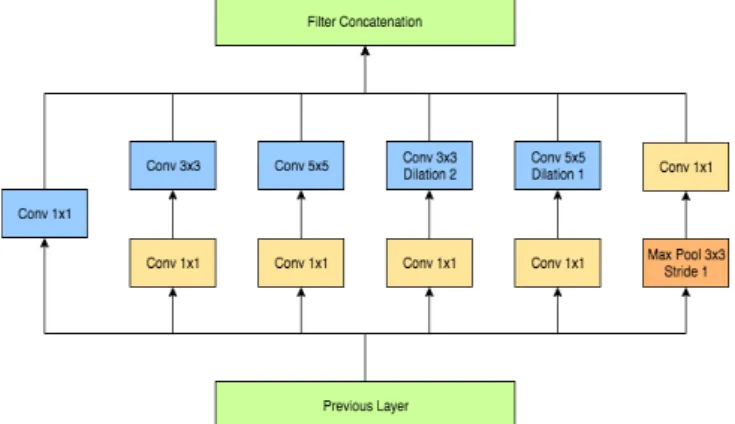
Fig. 1. IDB-v1a module as described in section III.A
III. PROPOSED METHOD
Our proposed method, Inception Dense Estimator Network (IDEnet), consists of 2 basic building blocks, which are Inception Dense (IDB) and Dense Evaluator Unit (DEU). Combination of several IDBs with an additional pooling layer in the end is called Inception Dense Group (IDG). An IDG is the features extractor module which features will be evaluated into a dense map by a DEU module. Several combinations between each module have been evaluated, each combination and the detail of the complete network architecture are explained below:
A. Inception Dense Block (IDB)
IDB is the basic building block of IDEnet. IDB is equivalent to inception module in Szegedy, C. et al.[1]. In
order to decide the architecture of IDB, analysis through the UCF50 and Shanghai Tech dataset are conducted. From the analysis, we conclude that with image resolution of 1024x1024, the minimum size of recognizeable person's head in a photo is aroound 3 to 5 pixels, while the maximum size of a person's head is between 150 to 200 pixels.
From the above conclusion, we design the minimum size for the convolution filter on IDB to be 3 by 3 and 5 by 5 pixels. To reach filter size of 150 to 200 pixels, we use a 2 by 2 pooling at the end of each IDG and stack up several IDGs so that the network satisfies the equation (1).
𝑦 = arg max
)(+) 𝑓 𝛼 ∗ 2
(123) , 𝑦 ∈ [𝑆
89:, 𝑆8;<] (1) Where 𝛼 is an IDB filter, 𝑓 𝛼 is the size of an IDB filter, 𝛽
is the number of IDGs within the designed IDEnet, Smin is the
lower bound of the maximum head size, which is 150 pixels, and Smax is the upper bound of the maximum head size, which
is 200 pixels.
In this paper, we conduct experimentation with two alternatives of IDB unit. The first alternative consists of 6 different computation units, which is defined as follow: 1x1 convolution, 3x3 convolution, 5x5 convolution, 3x3 convolution with dilation of 2, 5x5 convolution with dilation of 1, and max pooling. The second alternative is the same as inception block on Inception V1[1]. The second alternative
consists of 4 different computational units, which is defined as follow: 1x1 convolution, 3x3 convolution, 5x5 convolution, and max pooling. We name the first alternative of IDB unit as v1a and the second alternative as IDB-v1b. The illustration of our IDB-v1a and IDB-v1b are shown in Fig.1 and Fig. 2 respectively.
Fig. 2. IDB-v1b module as described in section III.A
B. Inception Dense Group (IDG)
An IDG is a sequentially connected IDB units with an additional pooling layer placed after the last IDB. As in the previous analysis in subsection III.A, we design our IDG to satisfy the equation (1). We design slightly different versions of IDG for each version of IDB. We call this IDG as IDG-v1a and IDG-v1b. The illustration of our IDG-v1a and IDG-v1b are shown in Fig. 3.
Fig. 3. IDG-v1a (left) and IDG-v1b (right) module
We also design another version of IDG which we called IDG-v1c. When designing IDG-v1c, we start with hypothesis that in order to be scale adaptive, each IDG have to extract feature and perform a counting for the current filter size simultaneously and carry the extracted features and count to the next IDG. In order to carry the extracted features forward, max pooling is widely known to work really well. Although max pooling works really well for forwarding feature to the next layer, in order to carry the count forward to the next layer we should perform a summation pooling instead of max pooling.
By carrying the count forward, the next IDG and DEU module will be able to combine the previous IDG module count with the extracted count from the current IDG module. There is no summation pooling layer in the framework we use when we do our experimentation, we instead use average pooling layer as a replacement, as average operation is basically a summation divided by a constant number. So, from there, we use both average pooling and max pooling at the end of each IDG for carrying the extracted counting and extracted feature from previous IDG layer. The illustation of IDG-v1c is shown in Fig. 4.
Fig. 4. IDG-v1c: IDG module with average and max pooling
C. Dense Evaluator Unit (DEU)
DEU is simple regressor module to flatten the multi channel image output from IDG into a single channel image, which represent the dense map result. We flatten the multi channel image into a single channel image by using a 1x1 convolution filter. We also apply a drop out regularization on DEU module to prevent the model from overfitting. The illustration of DEU module is shown in Fig 5.
Fig. 5. DEU module to regularize the model and flatten output image into a 1D channel dense map image
D. Inception Dense Estimator (IDEnet)
IDEnet consists of several IDGs and DEUs. In this work, we conduct 3 experiments on our IDEnet model based on 3 considerations. Each experiment will compare 2 IDEnet model and from the result of each experiment, the best IDEnet design will be iterated for the next experimentation.
The first consideration is single regression loss versus multiple regression loss approach. In Inception-v1[1],
auxiliary classifiers were added into the model to improve the convergence of very deep neural network, prevent gradient vanishing problem, and regularize the model, while in Inception-v3[3] the auxiliary classifiers were removed
because the auxiliary classifiers didn’t give any beneficial impact to the model. We conduct similar experiment with the same idea as in the Inception-v3[3]. Our first model will have
a multiple DEUs, which named IDEnet-v1a, and our second model will have single DEU, which named IDEnet-v1b. Both of IDEnet-v1a and IDEnet-v1b use 4 layers of IDG-v1a as the main computational module and 4 DEUs which each DEU is connected to each IDG-v1a. The illustration for both IDEnet-v1a and IDEnet-v1b are shown in Fig. 6.
Fig. 6. IDEnet-v1a (left) and IDEnet-v1b (right)
The second consideration is larger filter size with less pooling layers versus smaller filter size with more pooling layers. We use IDEnet-v1b for the larger filter size model, as it turns out giving better result than IDEnet-v1a. For the smaller filter size model, we use 5 layers of IDG-v1b as the main computational module with single DEU. We named this model as IDEnet-v1c.
The third consideration is related to our own hypothesis as explained in subsection III.B. We compare between v1c and another IDEnet design which name IDEnet-v1d. In this model, we use IDG-v1c which incorporate average pooling and max pooling at the end of the IDG module. The illustration of IDEnet-v1c and IDEnet-v1d are shown in Fig. 7.
Fig. 7. IDEnet-v1c (left) and IDEnet-v1d (right)
IV. EXPERIMENTS
We conduct several experiments to evaluate our IDEnet. Each experiment will compare two IDEnet models, and from the result of each experiment, the best IDEnet design will be iterated for the next experimentation. The best IDEnet model from the experiment will then be evaluated on UCF50, ShanghaiTech part A, and ShanghaiTech part B dataset. The detail and result of the experiment are described below:
A. Experimental Protocol
We conduct 3 types of experiment for deciding the best model of our IDEnet. Each experiment corresponds to each consideration which as described in subsection III.D. The first experiment compares network with single regression loss model and network with multiple regression loss model. The second experiment compares network with larger filter size and less pooling layers and network with smaller filter size and more pooling layers. The third experiment compares network with max pooling layers and network with average pooling and max pooling layers.
In the first experiment we compare IDEnet-v1a with v1b. In the second experiment we compare IDEnet-v1b with IDEnet-v1c. In the third experiment we compare IDEnet-v1c with IDEnet-v1d. We quatitatively compare the model performance by calculating the mean absolute error (MAE) of each model with UCF50 dataset. We split the UCF50 into 90% training set, 5% dev data, and 5% test set. Each image is sliced into a patch of size 224x224. We perform the evaluation to each patch image instead of a single full image. We train each model with 10 epoch training with decayed learning rate start from 0.01 with 0.5 decay rate per epoch. The loss function for single regression loss network and multiple regression losses are defined in equation (2) and equation (3) respectively.
𝑙𝑜𝑠𝑠 =
B3 B:HI J9HI GDHI|𝑦
:9D− 𝑦′
:9D|
(2)𝑙𝑜𝑠𝑠
8KLM9=
O𝑊
9∗ 𝑙𝑜𝑠𝑠
99HI (3)
where N is the batch size, W and H are width and height of output dense map, Wi is the loss weight for regression on step
i, lossi is the single loss for step I, 𝑦:9Dis the value of pixel (i, j) of the nth ground truth dense map, and 𝑦′
:9Dis the value of pixel (i, j) of the nth predicted dense map.
B. Experiments Result and Analysis
TABLE I. EXPERIMENT RESULT
Model Name MAE Dataset
Training Dev Test
IDEnet-v1a 90.82 232.41 202.28
IDEnet-v1b 73.53 194.06 202.05
IDEnet-v1c 50.00 45.64 53.98
IDEnet-v1d 48.61 43.50 51.25
From the experiment result on Table. I, we could derive the following conclusions:
1. Multiple regression loss on counting task doesn’t improve the convergence of the network nor regularize the network. This result gives consistent conclusion with the removal of auxiliary classifiers as explained on Inception-v3[3].
2. Smaller filter size with more pooling layers works better than bigger filter size with less pooling layers. This probably happens bacause of the redundant counting performed on same object within the different filter in the same IDG unit. Further analysis is needed to explain this phenomenon.
3. For counting task, combination of average pooling and max pooling perform slightly better than using only max pooling. This answer our hipothesis that have been described in subsection III.B.
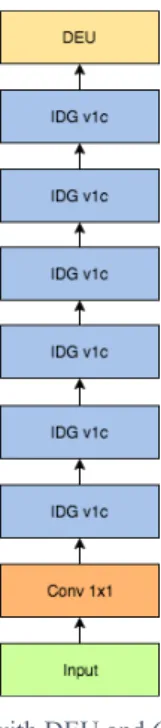
From the experiment results and conclusions, we decided to use IDEnet-v1d as our IDEnet-v1, to be evaluated and benchmarked on UCF50 dataset, ShanghaiTech part A, and ShanghaiTech part B dataset. The illustration of IDEnet-v1 is shown in Fig. 8.
Fig. 8. IDEnet-v1: with DEU and 6 layers of IDG-v1c
We conduct two different preprocessing approaches generating the density map. In the first approach we use the density map directly from the ground truth image. In the second approach, we modify the density map by performing gaussian kernel normalization (GKN) to the ground truth image. By performing GKN, the total sum of the dense image stays the same and this method makes the network learns the dense map better[8].
We evaluate the performance of our IDEnet-v1 by calculatinng mean absolute error (MAE) and mean square error (MSE). The calculation of MAE and MSE are defined in equation (4) and equation(5) respectively.
𝑀𝐴𝐸 =
3 B|𝑦
9− 𝑦′
9|
B 9HI(4)
𝑀𝑆𝐸 =
3 B|𝑦
9− 𝑦′
9|
B 9HI (5)where N is the number of samples in the dataset, 𝑦9is the ground truth count of the ith image, and 𝑦′
9 is the predicted count of the ith image.
C. Evaluation Comparison
We benchmark the performance of our work with the other works by implementing the standard evaluation protocol on each dataset and use the same formula to calculate the MAE and MSE evaluation metric.
We evaluate our IDEnet-v1 with two different crowd counting datasets. The first dataset is UCF50 from University
of Central Florida and the second dataset is ShanghaiTech dataset from ShanghaiTech University. ShanghaiTech dataset is divided into two different parts, which are called ShanghaiTech part A and ShanghaiTech part B. The statistics of our datasets are shown in Table II.
TABLE II. DATASET STATISTICS UCF50 AND SHANGHAITECH
Dataset Measure
Min Max Average Total
UCF50 96 4633 1279.50 63,974
ShanghaiTech part A 33 3139 501.40 241,677
ShanghaiTech part B 9 578 123.60 88,488
UCF50 dataset contains 50 grayscale crowd images. UCF50 dataset have various density level of the crowd image the image size is not standardized. The statistics of UCF50 dataset is shown in Table II. Evaluation on UCF50 dataset is conducted by performing a 5-folds cross validation on the dataset. We compare our IDEnet-v1 with eight existing methods [8][9][10][11][12][14][15][16]. The UCF50 dataset evaluation
result is shown in Table III.
TABLE III. EVALUATION METRIC OF THE UCF50 DATASET
Method Evaluation Metric
MAE MSE CrowdNet[8] 645.00 - MCNN[9] 377.60 509.10 Hydra CNN[10] 333.73 425.26 SaCNN[14] 314.90 424.80 Switch-CNN[11] 318.10 439.20 Pyramidal CNN[15] 295.80 320.90 ConvLSTM-nt[12] 284.50 297.10 Liu, X et al.[16] 279.60 388.90 Ours: IDEnet-v1 357.79 513.29 Ours: IDEnet-v1 + GKN 368.18 519.12
ShanghaiTech part A and ShanghaiTech part B have several differences[2]. ShanghaiTech part A consists of 300
training data of crowd images and 182 test data of crowd images, while ShanghaiTech part B consist of 400 training data of crowd images and 316 test data of crowd images. Another difference is ShanghaiTech part A has unstandardized image size and is retrieved from the internet, while ShanghaiTech part B has a standardized image of 1024x768 and is taken from metropolitan areas in Shanghai.
For ShanghaiTech part A, we compare our IDEnet-v1 with five existing methods [9][11][14][15][16]. The ShanghaiTech
part A evaluation result is shown in Table IV. For ShanghaiTech part B, we compare our IDEnet-v1with seven existing methods [9][11][13][14][15][16][17]. The ShanghaiTech part
B evaluation result is shown in Table V. Our IDEnet-v1 unable to achieve the best result in UCF50 dataset and ShanghaiTech part A dataset, but our IDEnet-v1 with GKN is able to outperform the state of the art method in ShanghaiTech part B dataset.
TABLE IV. EVALUATION METRIC OF SHANGHAITECH PART A
Method Evaluation Metric
MAE MSE MCNN[9] 110.20 173.20 Switch-CNN[11] 90.40 135.00 SaCNN[14] 86.80 139.20 Pyramidal CNN[15] 73.60 106.40 Liu, X et al.[16] 72.00 106.60 Ours: IDEnet-v1 102.95 158.24 Ours: IDEnet-v1 + GKN 95.81 153.08
TABLE V. EVALUATION METRIC OF SHANGHAITECH PART B
Method Evaluation Metric
MAE MSE MCNN[9] 59.10 81.70 Liu, W et al.[13] 25.10 45.80 Switch-CNN[11] 21.60 33.40 DecideNet[17] 20.75 29.42 Pyramidal CNN[15] 20.10 30.10 SaCNN[14] 16.20 25.80 Liu, X et al.[16] 13.70 21.40 Ours: IDEnet-v1 15.91 22.85 Ours: IDEnet-v1 + GKN 11.32 18.45 D. Analysis
We conduct manual error analysis for UCF50 dataset and ShanghaiTech part A dataset. From the manual error analysis, we figure out that our IDEnet incorrectly estimates count from the given crowd image because of the following reasons:
1. A very small and occluded human figure
2. A crowd image which are totally different with any other crowd image in the dataset
The first reason is the problem with small pattern size. Small pattern size usually gives a lot of false signal because the same exact pattern is likely to appear in many different places with contrasting signals. One potential solution for this problem is to use a switching mechanism to choose different regression unit for different type of region [11]. Another
possible solution is to use multiple regression unit and an attention mechanism to pick the correct regression unit. Some examples of the small pattern problem are shown in Fig. 9.
The second problem is a data distribution problem. This problem occurs when the image distribution of the test set is different from the training set, probably because some images are totally different with most of other images. We could solve this problem by adding more similar data into the dataset and balance the distribution of the training set, validation set, and the test set. Further study for systematic dataset assessment is needed to get deeper insight regarding to the data distribution problem. Some example images with distribution problem are shown in Fig. 10.
Fig. 9. Small pattern size estimation error. The left image is the input, the center is the ground truth, the right is the prediction. The number below the
image represents the ground truth and prediction count respectively.
Fig. 10. Data distribution error. The first row shows images that are totally different from most images on the UCF50 dataset. The other rows show some image groups with similar representation from the UCF50 dataset
CONCLUSIONS
In this paper we propose an inception based deep learning approach to estimate the crowd density from a crowd image, named Inception Dense Estimator Network (IDEnet). Inception based network is very modular so that the network is easily adapted and modified to other image processing task. We evaluated IDEnet in UCF50 and ShanghaiTech dataset and our IDEnet successfully outperformed the current state-of-the-art method in ShanghaiTech part B dataset.
From our experiments and manual error analysis we found 6 key conclusions, which could be used as a consideration for further research. The 6 key conclusions are as follow:
1. Multiple regression loss on inception based network doesn’t give any beneficial impact to the network learning process.
2. Smaller filter size with deeper network works better than bigger filter size with shallower network for crowd counting task.
3. Pooling layer with a combination of average pooling and max pooling works better than pooling layer with only max pooling in crowd counting task.
4. Gaussian Kernel Normalization enables the network to fit the dense map better.
5. Small pattern size and data distribution problems need to be handled in order to achieve a better result. 6. Our IDEnet outperforms the state-of-the-art-method
in ShanghaiTech dataset part B. ACKNOWLEDGEMENTS
The Titan XP used for this research was donated by the NVIDIA Corporation, and this work was also supported by Amazon Web Service (AWS) Educate, and Lembaga Pengembangan Inovasi dan Kewirausahaan Institut Teknologi Bandung (LPIK ITB).
REFERENCES
[1] C. Szegedy, W. Liu, Y. Jia, P. Sermanet, S. Reed, D. Anguelov, D. Erhan, V. Vanhouck, A. Rabinovich, “Going deeper with convolutions,” In 2016 IEEE Conference on Computer Vision and Pattern Recognition (CVPR), 2015
[2] S. Ioffe, C. Szegedy, “Batch normalization: Accelerating deep network training by reducing internal covariate shift,” in ICML, 2015. [3] C. Szegedy, V. Vanhoucke, S. Ioffe, J. Shlens, Z. Wojna, “Rethinking
the inception architecture for computer vision,” In 2016 IEEE Conference on Computer Vision and Pattern Recognition (CVPR), 2016, pp 2818–2826.
[4] C. Szegedy, S. Ioffe, V. Vanhoucke, A. A. Alemi, “Inception-v4, inception-resnet and the impact of residual connections on learning,” in AAAI, 2017.
[5] D. Kong, D. Gray, H. Tao, “Counting pedestrians in crowds using viewpoint invariant training”, in BMVC, 2005.
[6] A.B. Chan, N. Vasconcelos, “Bayesian poisson regression for crowd counting,” in 2009 IEEE 12th International Conference on Computer Vision, 2009, pp.545–551.
[7] A. Bansal, K.S. Venkatesh, “People counting in high density crowds from still images,” July, 2015.
[8] L. Boominathan, S.S.S. Kruthiventi, R.V. Babu , “Crowdnet: A deep convolutional network for dense crowd counting,” in Proceedings of the 2016 ACM on Multimedia Conference. MM ’16, New York, NY, USA, ACM, 2016, pp.640–644.
[9] Y. Zhang, D. Zhou, S. Chen, S. Gao, Y. Ma, “Single-image crowd counting via multi-column convolutional neural network,” in 2016 IEEE Conference on Computer Vision and Pattern Recognition (CVPR), 2016, pp. 589–597.
[10] D. Oñoro-Rubio, R.J. López-Sastre, “Towards perspective-free object counting with deep learning”, in ECCV, 2016.
[11] D.B. Sam, S. Surya, R.V Babu., “Switching convolutional neural network for crowd counting,” in 2017 IEEE Conference on Computer Vision and Pattern Recog- nition (CVPR), 2017, pp.4031–4039 [12] F. Xiong, X. Shi, D.Y. Yeung, “Spatiotemporal modeling for crowd
counting in videos,” in 2017 IEEE International Conference on Computer Vision (ICCV), 2017, pp.5161–51699
[13] W. Liu, K. Lis, M. Salzmann, P. Fua, “Geometric and physical constraints for head plane crowd density estimation in videos,” CoRR abs/1803.08805, 2018.
[14] L. Zhang, M. Shi, Q. Chen, “Crowd counting via scale-adaptive convolutional neural network,” 2018, pp.1113–1121
[15] V.A. Sindagi, V.M. Patel, “Generating high-quality crowd density maps using contextual pyramid cnns,” in 2017 IEEE International Conference on Computer Vision (ICCV), 2017, pp.1879–1888. [16] X. Liu, J. van de Weijer, A.D. Bagdanov, “Leveraging unlabeled data
for crowd counting by learning to rank,” in CVPR, 2018.
[17] J. Liu, C. Gao, D. Meng, A.G. Hauptmann, “Decidenet: Counting varying den- sity crowds through attention guided detection and density estimation,” CoRR abs/1712.06679, 2017.