Full Terms & Conditions of access and use can be found at
https://www.tandfonline.com/action/journalInformation?journalCode=tejr20
European Journal of Remote Sensing
ISSN: (Print) 2279-7254 (Online) Journal homepage: https://www.tandfonline.com/loi/tejr20
DSM-based identification of changes in highly
dynamic urban agglomerations
Gebhard Warth, Andreas Braun, Christian Bödinger, Volker Hochschild &
Felix Bachofer
To cite this article: Gebhard Warth, Andreas Braun, Christian Bödinger, Volker Hochschild & Felix Bachofer (2019) DSM-based identification of changes in highly dynamic urban agglomerations, European Journal of Remote Sensing, 52:1, 322-334, DOI: 10.1080/22797254.2019.1604083
To link to this article: https://doi.org/10.1080/22797254.2019.1604083
© 2019 The Author(s). Published by Informa UK Limited, trading as Taylor & Francis Group.
Published online: 22 Apr 2019.
Submit your article to this journal
DSM-based identi
fi
cation of changes in highly dynamic urban
agglomerations
Gebhard Wartha, Andreas Braun a, Christian Bödingera, Volker Hochschildaand Felix Bachofer b aDepartment of Geography, University of Tübingen, Tübingen, Germany;bGerman Remote Sensing Data Center (DFD), German Aerospace Center (DLR), Oberpfaffenhofen, Germany
ABSTRACT
Rapidly urbanizing areas are challenged by a lack of information on urban growth in many parts of the earth. As the speed of building construction often exceeds traditional surveying methods, remote sensing can serve as a valuable input for the monitoring of urbanization processes. This study investigates changes in DaNang, Vietnam, between 2015 and 2017 identified based on photogrammetric analysis of surface elevations retrieved from Pléiades very high-resolution imagery. In contrast to traditional post-classification change detection approaches, we propose a time-efficient method solely based on digital surface model differencing to identify newly constructed buildings as well as demolitions. It is therefore easy to apply and suitable for the continuation of outdated base data available to local authorities. High importance is addressed to the vertical matching of both surface models to avoid misdetections. After differencing these surface elevations, thresholds based on field measurements are applied to identify areas of change. A total of 10,800 changes were detected between 2015 and 2017, of which 8,531 were to newly constructed buildings. The study proves that changes in rapidly urbanizing agglomerations can be reliably identified by a simple and transparent approach by using elevation changes and expert-based knowledge onfloor numbers and building heights.
ARTICLE HISTORY
Received 15 July 2018 Revised 19 February 2019 Accepted 2 April 2019
KEYWORDS
Change detection; urban areas; photogrammetry; digital surface models; normalized DSM; Da Nang
Introduction
Urban agglomerations are facing several serious chal-lenges, especially in countries of the Global South (Cohen, 2006). Driven by a rapid growth of the urban population, environmental and socio-economic problems arise, amongst others pollution of the air and urban environment (Schell & Denham,
2003), poverty and crime (Satterthwaite & Mitlin,
2012) supply and mobility of the population (Vasconcellos, 2014), leading to uncontrolled growth and limited regulation measures by local authorities (Bhatta,2010; Goodfellow,2013).
Municipalities require reliable and up-to-date information for land-use and infrastructure planning, for creation and continuation of development plans and overall monitoring of changes. Remote sensing can serve as a valuable input for the characterization of urban structures and the identification of dynamics (Jensen & Cowen, 1999; Patino & Duque, 2013; Rashed & Jürgens, 2010; Weng, Quattrochi, & Gamba,2018).
However, the application of geospatial techniques in authorities is constrained in many countries of the global south, especially in many developing and newly industrializing countries due to several reasons: Lack of technical support for a sustainable establish-ment and continuation of public geospatial
infrastructures (Hastings & Clark, 1991; Leiser,
2011), inefficient collaboration between authorities of different sectors and levels (de Vries & Lance,
2011), budgetary constraints (George, 2000) or tech-nical and educational impediments (Jha & Chowdary,
2007). Consequently, applications for the use in urban agglomerations of non-industrial nations must be efficient, affordable, user-friendly, indepen-dent of ancillary base data and of appropriate complexity.
Our study focuses on the development of the city of Da Nang, Vietnam, for which Linh, Erasmi, and Kappas (2009) used Landsat and ASTER satellite images to identify the land use and land cover changes between 1979 and 2009 and found a significant decrease in forest and shrub land while urban areas increased by over 10,000 ha. Like in various other studies using high resolution (HR) satellites, such as Landsat or Sentinel-2, their results are based on post-classification change detection methods, requiring two or more classified image pairs, which together form a difference layer that is interpreted quantitatively and qualitatively (Alphan & Güvensoy,2016; Hegazy & Kaloop,2015; Mundia & Aniya,2005; Shalaby & Tateishi,2007; Yuan, Sawaya, Loeffelholz, & Bauer, 2005). However, images from very high resolution (VHR) satellites, such as
CONTACTGebhard Warth [email protected] Rümelinstraße19-23, Tübingen 72070, Germany 2019, VOL. 52, NO. 1, 322–334
https://doi.org/10.1080/22797254.2019.1604083
© 2019 The Author(s). Published by Informa UK Limited, trading as Taylor & Francis Group.
This is an Open Access article distributed under the terms of the Creative Commons Attribution License (http://creativecommons.org/licenses/by/4.0/), which permits unrestricted use, distribution, and reproduction in any medium, provided the original work is properly cited.
Quickbird, Pléiades or WorldView, need other tech-niques to cope with the degree of information. One of the most popular methods is object-based image ana-lysis (OBIA), which aggregates several pixels into objects that can be characterized by several features, such as mean spectral values, but also texture or neighbourhood characteristics (Blaschke, 2010; Blaschke, Lang, & Hay, 2008). OBIA is applied in particular in various studies focusing on urban envir-onments (De Pinho, Fonseca, Korting, de Almeida, & Kux, 2012; Moskal, Styers, & Halabisky, 2011; Zhou & Troy, 2008), monitoring of construction activities (Durieux, Lagabrielle, & Nelson,2008; Im, Jensen, & Tullis,2008; Wickramasinghe, Vu, & Maul, 2018) or building recognition and classification (Belgiu & Drǎguţ, 2014; Salehi, Zhang, Zhong, & Dey, 2012; Tsai, Stow, & Weeks,2011).
While change detection in VHR imagery is widely used for damage assessments (Dell’Acqua & Gamba,
2012; Lu, Guo, & Corbane, 2013; Olsen, Chen, Hutchinson, & Kuester,2013), only a few approaches exist to identify gradual changes in large cities through uncontrolled building activities, urbanization and densification (Kopecká & Rosina, 2014; Shahtahmassebi, Song, Zheng et al.,2016).
We regard the information of surface elevation change in urban areas as an indicator for change in building stock, which in very high resolution describes change on the single building level. Therefore, in this paper, we present a method applic-able for rapidly growing cities to assess changes in building infrastructure based on measures of eleva-tion change. Because of its robust approach, it brings several advantages to local authorities: a) it can be adapted by non-experts, b) it can be used for the continuation of already existing data, and c) it is, compared to most urban studies using VHR imagery, cost-effective regarding input data and software packages.
The retrieval of height information of buildings can be achieved with various datasets and methods: The pre-sumably most reliable approach is the use of airborne LiDAR measurements (Rottensteiner & Briese,2002; Yu, Liu, Wu, Hu, & Zhang, 2010), due to its high vertical accuracy and high point density. However, due to the individual mission conception for eachflight campaign, these campaigns are comparably expensive and require extensive preparation and post-processing. Studies based on Synthetic Aperture Radar (SAR) are presented by Brunner, Lemoine, Bruzzone, and Greidanus (2010), Soergel, Michaelsen, Thiele, Cadario, and Thoennessen (2009) or Colin-Koeniguer and Trouve (2014). The advantage of interferometric SAR approaches is the rela-tive independency from atmospheric conditions, which offers high flexibility regarding the time and date of acquisition. Yet, many of the SAR-related approaches struggle with very dense build-up patterns because of
the side-looking geometry of the system, which causes shadow and overlay effects in urban areas (Hill, Moate, & Blacknell,2006). Photogrammetric methods provide an ideal trade-offbetween applicability and quality in urban areas (Baltsavias,1999). Their use was demonstrated in numerous studies (Haala & Kada, 2010; Kadhim & Mourshed, 2018; Liu, Huang, Wen et al., 2017; Peng, Gong, Le Wang, & Yang,2016; Poli & Caravaggi,2012). The Pléiades mission is of special value because of its tri-stereoscopic acquisition mode. It is composed of three nearly simultaneously acquired images, one backward looking, one forward looking, plus a third near-nadir image (Gleyzes, Perret, & Kubik,2012; Perko, Raggam, Gutjahr, & Schardt, 2014). Pléiades image triplets have proven their ability in deriving submeter scale elevation and elevation changes (Bagnardi, González, & Hooper,
2016; Zhou, Parsons, Elliott et al.,2015). The tri-stereo-scopic configuration allows to retrieve more detailed Digital Surface Models (DSM) in rough terrain or urban areas (Panagiotakis, Chrysoulakis, Charalampopoulou, & Poursanidis, 2018). Poli, Remondino, Angiuli, and Agugiaro (2015) and Perko et al. (2014) evaluated the DSM processing of Pléidades imagery in the urban context of Trento and Innsbruck. The two studies achieved RMSEz of 0.75 and 2.4 m, respectively. Panagiotakis et al. (2018) achieved an RMSEz of 1.17 m compared to differential GPS measure-ments in Athens. Bachofer (2017) used the height infor-mation derived from a Pléiades triplet to extract building volume information for the Central Business district of Kigali, Rwanda. Lefebvre, Nabucet, Corpetti, Courty, and Hubert-Moy (2016) used a Pléiades derived DSM to extract urban vegetation.
Recent developments include the use of unmanned aerial vehicles (UAVs) for building height estimation (Gal & Doytsher,2014; Kelbe, White, Hardin, Moehl, & Phillips, 2016; Rebelo, Rodrigues, Tenedório, Goncalves, & Marnoto, 2015; Unger, Reich, & Heipke, 2014), or multi-sensor approaches (Geiß et al., 2015; Sportouche, Tupin, & Denise, 2011; Xu, Ma, Ng, & Lin, 2015). UAV data provide obviously higher spatial resolutions, yet can usually cover only small study areas and need enormous processing capabilities.
Data and methods
Study area and data
Extent of the study
The study area is located in Da Nang province in Central Vietnam and covers large parts of Da Nang city. Due to constraints regarding the acquired area, an area of interest (AOI) has been defined for the tasked VHR imagery (Figure 1, red outline). It covers approximately 225 km2 of the urban area and includes the districts Cẩm Lệ, Hải Châu, Liên
Chiểu, Ngũ Hành Sơn, Sơn Trà and Thanh Khê. Since its classification as a Class I city in 1997, Da Nang underwent rapid socio-economic and environ-mental changes (JICA,2010). As a consequence, large shrubland and forest areas were logged down for urban extension areas in many parts of the city (Linh et al.,2009).
Satellite imagery
The two satellites of the Pléiades constellation (1A and 1B) for VHR earth surface observation were launched in 2011 and 2012 respectively. The pan-chromatic sensor provides images with a resolution of 70 cm and 2.8 m for the 4 multispectral bands. The physical resolution is resampled to 50 cm, respec-tively, 2 m, ground sampling distance, and the stereo angle can vary from ~6° to ~28° (GSD) (De Lussy et al.,2012; Gleyzes et al.,2012). Compared to other VHR stereo satellite missions, such as the WorldViews, Pléiades tri-stereo mode offers a third stereoscopic image acquired at an off-nadir angle of 1.6°. Through that, ground areas between high-rise buildings can be captured with a higher probability. Pléiades stereoscopic triplets were acquired of the urban region of Da Nang at 20.10.2015 and 13.08.2017 (Tables 1and2).
Field reference data
To validate the results, reference information of build-ings and the buildbuild-ings structure was collected for 975 buildings in March 2015, March 2016 and December 2017. Amongst other things, the reference data includes information on the location (retrieved by
GPS), building type, height and number offloors. For 405 of these reference buildings, the building height was measured with a handheld laser measure device and the
floor number was collected additionally.
Administrative data
Land-use information of the General Construction Plan of Da Nang City 2030 was used to differentiate between building blocks and other land-use such as natural areas, agriculture, transport infrastructure. By using the geometries of the building plots, the results of this study can be integrated into the planning and development processes of the local administration (Urban Planning Institute (UPI); Department of Construction (DoC)). Additional cadastral data
Figure 1.Study area and extent of Pléiades acquisition.
Table 1.Characteristics of Pléiades-1B panchromatic triplet– 20.10.2015.
Image 1 Image 2 Image 3
Global incidence 13.69 7.08 13.00 Along-track (°) −10.19 2.36 12.21 Across-track (°) 9.34 6.68 4.59 Acquisition time 03:24:32 03:24:52 03:25:09 Solar Azimuth (°) 146.09 146.09 146.50 Solar Elevation (°) 58.89 58.89 59.02
Table 2.Characteristics of Pléiades-1B panchromatic triplet– 13.08.2017.
Image 1 Image 2 Image 3
Global incidence 16.12 11.62 7.76 Along-track (°) −12.26 −7.64 −1.65 Across-track (°) 10.78 8.85 7.59 Acquisition time 03:24:36 03:24:44 03:24:54 Solar Azimuth (°) 90.69 90.58 90.58 Solar Elevation (°) 68.67 68.73 68.73
delineating building parcels was provided for large parts of the districts of Cẩm Lệ, Hải Châu, Liên Chiểu, Ngũ Hành Sơn, Sơn Trà and Thanh Khê, as well as a selection of LIDAR ground elevation points. In some cases, the building blocks were incomplete and had to be extended and attributed manually.
Administrative boundaries of the city districts and wards were retrieved from the GADM database of Global Administrative Areas (GADM,2012).
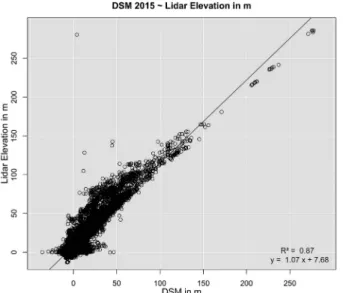
Derivation of surface heights and built-up areas Based on the 2015 and 2017 Pléiades acquisitions, the two DSMs were photogrammetrically processed by means of the panchromatic band (0.5-m resolution) in Erdas IMAGINE© using the Rational Polynomial Coefficients (RPCs) to describe the exterior and inter-ior orientation of each panchromatic image of the Pléiades triplets (Hu, Gao, Li & Li, 2016; Topan, Taskanat, & Cam,2013). Tie points were automatically generated and visually checked for their consistency. The total image RMSE of the triangulation was 0.211 for 2015 and 0.017 for 2017. Enhanced Automatic Terrain Extraction (eATE) was applied, using dense point matching and Normalized Cross-Correlation (NCC) to match images and extract elevation (Mikhail, Bethel, & McGlone, 2001; Straub, Stepper, Seitz, & Waser, 2013). The resulting point cloud was interpolated to a raster surface in CloudCompare (Girardeau-Montaut,2015). The resulting DSM repre-sents surface elevation information for the displayed areas including all anthropogenic structures and vege-tation. To assess the accuracy of the DSM, the point cloud of 2015 was clipped with a ground mask and a digital elevation model (DEM) was derived from the extracted ground surface point information. The DEM contains ground elevation information, artificial struc-tures and vegetation are excluded. A normalized sur-face model (nDSM) was differentiated from DSM and DEM. Positive differences in the nDSM represent vege-tation and artificial structures, such as buildings. To validate the nDSM, its values were compared to the reference information on building heights. Figure 2
shows the elevations of the nDSM related to the avail-able LIDAR points (see chapter“administrative data”), resulting in an R2of 0.87.
For the initial delineation of build-up structures, the panchromatic and multispectral bands of the 2015 Pléiades scene were pansharpened and an object-based image analysis (OBIA) approach was chosen (Blaschke,
2010; Blaschke et al.,2014). The OBIA approach groups neighbouring pixels with similar spectral or thematic values into image segments with spectral, geometric and thematic properties (Benz, Hofmann, Willhauck, Lingenfelder, & Heynen, 2004). To improve the seg-mentation result for build-up structures, a Canny edge operator was applied to the Pléiades scene and included
in the segmentation process (Bachofer, Quénéhervé, Zwiener et al., 2016; Canny, 1986). For the resulting segments, a complex ruleset was developed, which is based on spectral and height values, geometrical fea-tures, as well as spatial relationships between image objects. The properties of the object features were enriched by computing additional raster layers, such as the first three components of a Principal Component Analysis (PCA), the Normalized Differential Vegetation Index (NDVI) (Rouse, Haas, Schell, & Deering, 1973) and the Topographic Position Index (TPI) (Bachofer, 2017; De Reu et al.,
2013; Guisan, Weiss, & Weiss,1999; Weiss,2001). The latter index was computed with the DSM to support the differentiation between elevated objects and ground surface. Remaining artefacts were edited manually. Due to the dense building structure of the city,
identi-fication of single buildings was not automatable. Build-up areas were then intersected with parcel boundaries, where available (see section“administrative data”), and centroids representing single buildings were derived. For areas without parcel data, visual identification of buildings was conducted by digitizing single points.
Identification of changes
As shown inFigure 3, the identification of changes in built-up structures between 2015 and 2017 was con-ducted in a two-step approach. In order to overcome the need for absolute building heights, both DSMs were horizontally adjusted in a first step and a difference image describing the absolute height change between both dates was generated. In the second step, the derived changes were classified on a threshold-based approach to delineate building or demolition activities. This is described at more detail in the following.
Figure 2. Relationship between DSM and LIDAR reference point data.
Vertical adjustment of both images
In order to differentiate the DSMs, both of the surface models have to be finely registered at the vertical dimension. Inaccuracies in vertical registration lead to misclassifications and therefore cause over- or underestimation of change.
To derive a surface that represents regional adapted differences between both DSMs, afirst stratified random point sampling was implemented to generate 76,085 points representing ground elevation. For that, classified built-up areas were used to exclude buildings from the point sampling. To exclude vegetation-caused elevation deviations, areas with NDVI values greater 0.1 were excluded from the sampling as well. The masked-out areas were buffered with a 2.5-m distance to eliminate the influence of buildings and vegetation on the ground elevation. The heights from 2015 and 2017 were extracted at the 76,085 points and differenced in order
to get information about regional differences of both models. To minimize the influence of potential outliers and to avoid overfitting of the differential surface, the points were averaged at a regular 250-m sampling grid (seeFigure 4). Based on this regular point grid a spline interpolation was implemented to generate a smooth and steady differential rectification surface (Franke,1981).
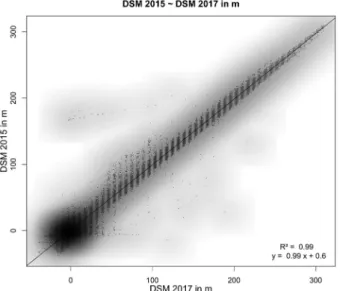
As systematically induced errors are expected to occur in the difference between the 2015 and 2017 models, an approach based on 49 points in a 7 × 7 neighbourhood is chosen to conduct the interpola-tion. Thereby the influence of single values can be reduced to enable a steady interpolation result. To apply the vertical correction, the interpolated diff er-ential rectification surface was applied to the 2017 DSM by subtracting its values. After the vertical adjustment, both elevation models show a very good correlation (R2= 0.99, seeFigure 5).
Figure 3.Workflow to identify building changes.
Changes of existing buildings and in newly constructed areas
On the base of twofinely registered DSMs, the diff er-encing can be conducted with simple subtraction of the corresponding elevation values.
Change surface¼DSM2017DSM2015 (1) The result shows positive differences representing an increase of elevation, whereas negative differences represent a decrease of elevation during the 2-year period. A 5 × 5 majorityfilter reduces outliers in the DSM difference to avoid misclassifications in the following procedure.
In a first approach, the change surface is masked by built-up areas to retrieve a raster representing only changes in 2015 built-up areas. To derive changes in build-up areas, each house is considered based on building centroids (see chapter“Derivation of surface heights and built-up areas”). A 2-m buffer is applied on the building centroid to construct a representative building area without knowledge of its exact orienta-tion. Based on the coverage of the building buffers, the change surface is averaged to derive a statistical andfiltered change value for each building. Ourfield measurements show that the majority of the buildings in DaNang have two or more floors (Table 3) and consist of narrow local-type houses (67% of our reference data). As demonstrated by Downes, Storch, Schmidt, van Nguyen, and Tran (2016), these local-type buildings make up the majority of the building stock (approximately 90% of all build-ings in DaNang), are typically constructed with two or more floors and are preferably used in construc-tion areas. Based on these observaconstruc-tions, we defined thresholds given in Table 3to classify changes.
To determine the changes on 2015 unbuilt-areas, previously mentioned building footprints are used to remove buildings from the change surface,
additionally, areas with NDVI values greater than 0.1 are excluded to avoid vegetation related changes. In this second approach, only positive changes are considered representing the increased building. Negative changes are not expected to be caused by building dynamics. Applying the thresholds given in
Table 4, the area representing the change surface on the unbuilt ground is classified to moderate and severe change. Polygonising the classified patches allows for the application geometrically based refi ne-ment. Classified change patches below 35 m2 are removed from the polygon areas.
Small area water bodies, mining areas (in the Liên Chiểu and Cẩm Lệdistricts), filling zones, container yards close to ports (in Sơn Trà) and planes at the prefield of the airport which show constant elevation changes are hard to be identified by means of auto-matic classification. For this reason, the mentioned areas were visually identified and manually removed from the classified result. Remaining detections represent recent building activities between 2015 and 2017.
Results
Accuracy of the DSM
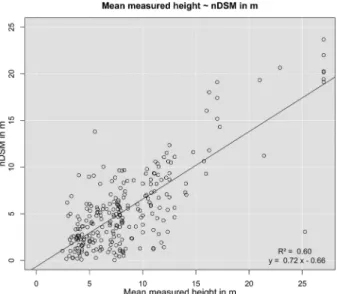
The DSMs were generated with a 0.5-m resolution. Since there is no focus on absolute heights in this approach, but on correct heights, the quality of the derived heights was estimated by comparing the 405 building height measurements with the described nDSM. The coefficient of determination shows with r2 = 0.6 a good conformity of the derived heights with true building heights (see
Figure 6).
Accuracy of the DSM difference
The vertical referencing, which is crucial for correct interpretation of detected changes, resulted in very high accuracies. The validation was performed on the 76,085 ground points, on which the differencing values
Figure 5.Fine vertical registration of DSMs 2015 and 2017.
Table 3.Thresholds for the identification of changes.
Positive changes Negative changes moderate severe moderate severe Built-up areas 4.5 to 10 m > 10 m −6.5 to−10 m >−10 m Unbuilt areas 6 to 10 m > 10 m -
-Table 4.Building change detection 2015–2017.
Number of detected
change Newly built Demolished
Category n % n % n %
Built-up 6,213 61.6 4,714 54.9 1,499 100
Unbuilt 3,867 38.4 3,867 45.1 -
were extracted. Statistical analysis on the points pro-duced an average discrepancy of 0.044 m for the 2015 and the 2017 DSM with a standard deviation of 2.02 m. The low standard deviation symbolizes a veryfine ver-tical registration, especially as it lies below the classifi ca-tion threshold to detect building and demolica-tion activities (Table 4). Consequently, the differences can be used with the given thresholds as indicators to detect building changes.
Considering a small scale, the difference image shows a generally very homogenous distribution of values around the zero value, which represents no change in elevation between both acquisition dates. At the north eastern part of the study area, slight deviations are identifiable (varying between +6.5 m and−11 m) and are to be interpreted as effects of misregistration, as these patches cover steep and densely wooded terrain. Again, no ground points for vertical referencing could be generated in these areas. As a consequence of the locally concentrated mining activities at the western part of the study area and the transition of the terrain into wooded and mountainous terrain, the area is under-represented by valid ground points for the ver-tical registration process as well. The strong differences in the eastern part of the Da Nang bay are caused by landfilling activities to expand development ground.
Regarding the difference raster in more detail reveals spatially high resoluted changes over the given period. On unbuilt areas in 2015, the changes appear very explicitly. In these cases, the shape of the changed building is very accentuated. Especially large-area com-mercially and industrially used buildings are distin-guishable due to the shapes of the changes. Also, apartment and hotel complexes close to the shoreline, which were constructed in the investigated period, are identifiable by the shape of the single detected changes and moreover by their mutual spatial arrangements.
The change raster allows identifying a change in the city centre, where the city initially was already densely built-up in 2015. Changes are characterized by homogeneous values over an entire building foot-print. High-rise buildings can cause false change marks because photogrammetric approaches can struggle with exactly modelling surface and shape characteristics at the same time. This can cause a “bagel effect” in the difference raster when the shape of buildings is estimated slightly different in both DSMs. Homogeneous surfaces such as streets, lawns, water bodies and runways at the airports induce high positive or high negative values in the difference raster, due to the disability of photogram-metric processing to set valid cross-correlations between image sections without sufficient contrast.
Figure 7 gives an overview of the changes in the study area and some selected examples at higher detail.
Changes in the city
Overall changes
The classification of building stock changes resulted in 10,080 detected building changes between 2015 and 2017 in the area covered by both Pléiades acqui-sitions (seeTables 1and2). This total number is split into 8,531 buildings showing an increase in heights above given thresholds and 1,499 buildings have been demolished at the acquisition time in 2017 compared to 2015. In formerly unbuilt areas, building change detections represent newly built houses. Spatial inter-section of detected changes and unbuilt areas shows 3,867 newly constructed buildings in the two-year period. The spatial intersection of detected height increase and built-up areas reveal 4,714 changes in the existing building stock. The numbers can not indicate rebuilding or upgrading of buildings. Based on an assumed total building number of 244,180 buildings in 2015 (based on spectral based building detection–see chapter“Derivation of surface heights and built-up areas”) and 7,082 differenced newly buildings, the building stock in the image covered agglomeration area increased about 1.5% in two years through buildings on the newly built ground. 1.9% of the buildings in the existing building stock in 2015 were extended or rebuilt in the two-year period and 0.6% of the existing building stock has been demolished at the time of the second acquisition compared to the 2015 acquisition.
Regional examination of building changes
The heatmap (see Figure 8) shows the density of changed buildings in a 1 km radius. It visualizes a general regional trend in the building stock dynamics. It reveals two major areas with high change dynamics. The areas east of the airport, which include parts of the districts of Hải Châu,
Figure 6. Relationship between measured building height and nDSM.
Sơn Trà and NgũHành Sơn, show the highest change densities. These areas contain the traditional city centre of Da Nang, which undergoes a steady process of change and renewal. In densely built-up areas, building renovation generally involves demolition of building stock, which is detected by the applied thresholds on the change surface as well. Overlaying detections of demolition verifies the active process of ongoing renewal in the building stock.
In the western part of the Da Nang agglomeration, west of Liên Chiểu, changes are detected in spatially high concentrations. Considering missing detections of building demolitions, these peripheral areas are recently developed areas to extend the Da Nang set-tlement area. These areas were formerly agriculturally used land converted from cropland to development areas. The Cẩm Lệpeninsula shows comparably high change activities, though the change densities do not reach the values of the Liên Chiểu development area. The tip of the peninsula likewise is a transformation area from cropland to development area; however, the development was initialized prior to the first acquisition in 2015, which is why the change densities
do not stand out compared to similar areas. As well, building activities on the Cẩm Lệ peninsula seem to be spread more extensively over the development area, which causes a comparatively lighter change density.
Local examination of building changes
The spatial aggregation of changes by means of reg-ular hexagons with 500-m diameter supplements the change heatmap by enabling assignments of change to smaller scale units. Red colours symbolize highest change dynamics with 100 detected changes or more, whereas blue hexagons are assigned the lowest changes with 1 to 10 detected changes (Figure 9, left). Hexagons without detected changes remain transparent. Hexagons with highest change rate exist 3 times in the city centre, one according to hexagon is located at the western development area near Liên Chiểu. The highest concentration of orange coloured (20–50 changes) and yellow coloured hexagons (10
−20 changes) lies between the airport and the east shoreline. With increasing distance to the city centre the existence of blue coloured hexagons grow,
Figure 7. Change maps of Da Nang. Overview (left) and detailed view on building complexes (upper right), industrial areas (middle right) and city centre (lower right).
Figure 8.Heatmap shows regional trends of building changes over the Da Nang area. Subsets showing dynamic zones without detected demolitions and with detected demolitions.
indicating the lowest numbers of detection. Except from the western development areas near Liên Chiểu, the blue hexagons form a ring structure, which sur-rounds the city centre and forms a transition to the outskirts of Da Nang.
Regarding the hexagons representing demolitions, a value range between 1 and 31 demolitions per polygon is displayed (Figure 9, right). Similar to the total detected changes, the concentration of demoli-tions is located in the city centre, where red, violet and black colours are plotted, representing demoli-tion ranges between 11 and 31 changes. Especially along the western riverbank, the highest demolition numbers are located. These findings indicate starting and ongoing renewal processes in these areas. In peripheral areas environing the city centre, detected demolitions range on a comparably low level. Accuracy assessment
We tested 200 randomly selected change points in regards to correct detection. As the results consist of detected changes only, we had no possibility to cal-culate a true-negative accuracy. 162 out of 200 test points were detected correctly, which is a true-positive rate of 81%.
Discussions
The validation results of the DSM generation, on information content regarding building heights and vertical DSM registration, approve the usage of rela-tive elevation information. Knowledge of existing buildings is the main prerequisite for this approach, as detecting change in initially present building stock is based on the spatial information of single build-ings. The examination of the change raster revealed slight misregistrations on mountainous and wooded terrain because valid ground points to enhance the surface for precise DSM registration cannot be set on the covered ground. This limitation can occur in very
densely built-up areas, wherein addition only very narrow streets and tracks separate building block. Given such cases, it is hardly possible to define valid ground points for ground elevation sampling. Therefore, in such areas, the vertical referencing sur-face can possibly contain raised uncertainties. In our study, the fine registration surface showed a mean difference of 0.04 m and a standard deviation of 2.02 m.
Photogrammetry derived elevation information must be interpreted differently compared spectral remote sensing approaches, as photogrammetric pro-cesses do not exactly reproduce sharp edges or ridges as they occur between houses and streets or between houses with large height differences. This character-istic of photogrammetric processing can cause a “bagel effect”, when building extends got derived more extensive in one DSM, which must not be interpreted as detected change.
By using thresholds on elevation information and on horizontal changed areas, the approach is though very robust and comparably incomplex to implement, as a simple reclassification of elevation difference is applied instead of spectral building classification. Bi-and tri stereoscopic Pléiades data are beneficial in pricing compared to other sources and, after the photogrammetric processing, the differencing has to be referred to present information.
In the case study, the results show a concentration of change at the city centre. Highest rates of change and demolition are detected between the airport and the eastern coastline. Comparing to studies, reporting a strong expansion of the Da Nang urban area (Linh et al. (2009)), our results show the concentration of building changes on the city centre of Da Nang, which are caused by redensification tendencies and renewal of existing building stock. Nevertheless, near Liên Chiểu and on the Cẩm Lệpeninsula, developing areas are under construction. Detected patterns on the southern regions of the eastern shoreline show building activities with complexes of buildings or
hotel areas. These detections confirm perceptions fromfield campaigns in the study area, where upmar-ket building projects are realized close to the shore line.
To distinguish between redensification areas and building development areas, demolitions can be used as a valuable indicator. The detected demolitions can only show demolitions in 2017 respectively at the second acquisition time and therefore must not be interpreted as a total demolition number of the period under consideration.
Conclusion and outlook
The presented results show that the approach on differencing relative DSMs provides a practical tool to monitor change in building stock of urban areas. A true positive rate of 81% of our findings confirms our assumptions.
VHR remote sensing imagery has proven to be a benefit of this study, as not only the dynamic of city growth was detected, but also the type of change in already built-up areas. To detect change at the building level, imagery with spatial resolution below the smallest objects to be detected is necessary. So besides the advan-tages of medium resolution remote sensing imagery, which allow monitoring areal urban changes (Wei, Blaschke, Kazakopoulos, Taubenböck, and Tiede (2017)), our results show that VHR remote sensing imagery enables the identification of local and small-scale urban processes, such as building construction, upgrading and demolition on single building level.
The 2017 image has been acquired in a very active phase with construction in progress, as many areas show spectral characteristics of open ground. A continuous implementation of this approach can reconstruct the steady change of activities. Besides the spatially high-resolution change information, the implementation of satellite imagery in the approach offers the advantage of the availability of imagery and thus can provide temporally high-resolution change information as well for long-term change monitoring. In the continuation, the approach can be adapted more precisely to the local building characteristics, by implementing local knowledge to improve thresh-old definition for height changes and building foot-print area. The improvement of detecting ground areas, so far implemented by NDVI thresholding and buffering of building structures, would benefit in increasing the accuracy of the vertical registration of both input DSMs. This leads to more precise change detection in densely built-up areas.
Disclosure statement
No potential conflict of interest was reported by the authors.
Funding
This study was funded by the German Federal Ministry of Education and Research (BMBF) under the project “RapidPlanning”(grant identifier 01LG1301K).
ORCID
Andreas Braun http://orcid.org/0000-0001-8630-1389
Felix Bachofer http://orcid.org/0000-0001-6181-0187
References
Alphan, H., & Güvensoy, L. (2016). Detecting coastal urbani-zation and land use change in Southern Turkey.Journal of Environmental Engineering and Landscape Management, 24(2), 97–107. doi:10.3846/16486897.2015.1113976
Bachofer, F. (2017). Assessment of building heights from pléiades satellite imagery for the Nyarugenge sector, Kigali, Rwanda. Rwanda Journal, 1(DI). doi:10.4314/rj. v1i2s.6d
Bachofer, F., Quénéhervé, G., Zwiener, T., Maerker, M., & Hochschild, V. (2016). Comparative analysis of edge detection techniques for SAR images.European Journal of Remote Sensing, 49(1), 205–224. doi:10.5721/ EuJRS20164912
Bagnardi, M., González, P.J., & Hooper, A. (2016). High-resolution digital elevation model from tri-stereo Pleiades-1 satellite imagery for lava flow volume esti-mates at Fogo Volcano. Geophysical Research Letters, 43(12), 6267–6275. doi:10.1002/2016GL069457
Baltsavias, E.P. (1999). A comparison between photogram-metry and laser scanning. ISPRS Journal of Photogrammetry and Remote Sensing, 54(2–3), 83–94. doi:10.1016/S0924-2716(99)00014-3
Belgiu, M., & Drǎguţ, L. (2014). Comparing supervised and unsupervised multiresolution segmentation approaches for extracting buildings from very high resolution imagery. ISPRS Journal of Photogrammetry and Remote Sensing, 96, 67–75. doi:10.1016/j. isprsjprs.2014.07.002
Benz, U.C., Hofmann, P., Willhauck, G., Lingenfelder, I., & Heynen, M. (2004). Multi-resolution, object-oriented fuzzy analysis of remote sensing data for GIS-ready information. ISPRS Journal of Photogrammetry and Remote Sensing,58 (3–4), 239–258. doi:10.1016/j.isprsjprs.2003.10.002
Bhatta, B. (2010). Causes and consequences of urban growth and sprawl. In Analysis of urban growth and sprawl from remote sensing data (pp. 17–36). Springer. Berlin, Heidelberg.
Blaschke, T. (2010). Object based image analysis for remote sensing. ISPRS Journal of Photogrammetry and Remote Sensing,65(1), 2–16. doi:10.1016/j.isprsjprs.2009.06.004
Blaschke, T., Hay, G.J., Kelly, M., Lang, S., Hofmann, P., Addink, E., . . . van Coillie, F. (2014). Geographic object-based image analysis–Towards a new paradigm. ISPRS Journal of Photogrammetry and Remote Sensing, 87, 180–191. doi:10.1016/j.isprsjprs.2013.09.014
Blaschke, T., Lang, S., & Hay, G. (2008). Object-based image analysis: Spatial concepts for knowledge-driven remote sensing applications. Springer Science & Business Media. Berlin, Heidelberg.
Brunner, D., Lemoine, G., Bruzzone, L., & Greidanus, H. (2010). Building height retrieval from VHR SAR imagery based on an iterative simulation and matching technique.
IEEE Transactions on Geoscience and Remote Sensing,48 (3), 1487–1504. doi:10.1109/TGRS.2009.2031910
Canny, J. (1986). A computational approach to edge detection. IEEE Transactions on Pattern Analysis & Machine Intelligence, (6), 679–698. doi:10.1109/ TPAMI.1986.4767851
Cohen, B. (2006). Urbanization in developing countries: Current trends, future projections, and key challenges for sustainability.Technology in Society,28(1–2), 63–80. doi:10.1016/j.techsoc.2005.10.005
Colin-Koeniguer, E., & Trouve, N. (2014). Performance of building height estimation using high-resolution PolInSAR images.IEEE Transactions on Geoscience and Remote Sensing, 52(9), 5870–5879. doi:10.1109/ TGRS.2013.2293605
De Lussy, F., Greslou, D., Dechoz, C., Amberg, V., Delvit, J. M., Lebegue, L., . . . Fourest, S. (2012). Pleiades HR in flight geometrical calibration: Location and mapping of the focal plane. Int. Arch. Photogramm. Remote Sens. Spat. Inf. Sci, 39, 519–523. doi: 10.5194/isprsarchives-XXXIX-B1-519-2012
De Pinho, C.M.D., Fonseca, L.M.G., Korting, T.S., de Almeida, C.M., & Kux, H.J.H. (2012). Land-cover classi-fication of an intra-urban environment using high-resolution images and object-based image analysis. International Journal of Remote Sensing, 33 (19), 5973–5995. doi:10.1080/01431161.2012.675451
De Reu, J., Bourgeois, J., Bats, M., Zwertvaegher, A., Gelorini, V., de Smed, P., . . . Finke, P. (2013). Application of the topographic position index to hetero-geneous landscapes. Geomorphology, 186, 39–49. doi:10.1016/j.geomorph.2012.12.015
de Vries, W., & Lance, K. (2011). SDI reality in Uganda: Coordinating between redundancy and efficiency. In Z. Nedovic-Budic, J. Crompvoets, & Y. Georgiadou (Eds.), Spatial data infrastructures in context: North and South(pp. 103–119). CRC press. Boca Raton. Dell‘Acqua, F., & Gamba, P.E. (2012). Remote sensing and
earthquake damage assessment: Experiences, limits, and perspectives. Proceedings of the IEEE, 100(10), 2876–2890. doi:10.1109/JPROC.2012.2196404
Downes, N.K., Storch, H., Schmidt, M., van Nguyen, T.C., & Tran, T.N. (2016). Understanding Ho Chi Minh City’s urban structures for urban land-use monitoring and risk-adapted land-use planning. In Sustainable Ho Chi Minh City: Climate policies for emerging mega cities(pp. 89–116). Springer. Berlin, Heidelberg.
Durieux, L., Lagabrielle, E., & Nelson, A. (2008). A method for monitoring building construction in urban sprawl areas using object-based analysis of Spot 5 images and existing GIS data.ISPRS Journal of Photogrammetry and Remote Sensing, 63(4), 399–408. doi:10.1016/j. isprsjprs.2008.01.005
Franke, R. (1981). Smooth interpolation of scattered data by local thin plate splines. Computers & Mathematics with Applications, 8(4), 273-281. doi:10.1016/0898-1221 (82)90009-8
GADM. (2012). GADM database of global administrative areas: Version 2.0. University of California Berkeley. Retrieved fromhttps://gadm.org
Gal, O., & Doytsher, Y. (2014). Fast and efficient visible trajectories planning for the Dubins UAV model in 3D built-up environments. Robotica, 32(1), 143–163. doi:10.1017/S0263574713000787
Geiß, C., Pelizari, P.A., Marconcini, M., Sengara, W., Edwards, M., Lakes, T., & Taubenböck, H. (2015). Estimation of seismic building structural types using
multi-sensor remote sensing and machine learning techniques. ISPRS Journal of Photogrammetry and Remote Sensing, 104, 175–188. doi:10.1016/j. isprsjprs.2014.07.016
George, H. (2000). Developing countries and remote sen-sing: How intergovernmental factors impede progress. Space Policy, 16(4), 267–273. doi: 10.1016/S0265-9646(00)00042-4
Girardeau-Montaut, D. (2015). CloudCompare version 2.6. 1 user manual. Grenoble
Gleyzes, M.A., Perret, L., & Kubik, P. (2012). Pleiades system architecture and main performances. International Archives of the Photogrammetry, Remote Sensing and Spatial Information Sciences, 39(1), 537–542. doi:10.5194/isprsarchives-XXXIX-B1-537-2012
Goodfellow, T. (2013). Planning and development regula-tion amid rapid urban growth: Explaining divergent trajectories in Africa.Geoforum,48, 83–93. doi:10.1016/ j.geoforum.2013.04.007
Guisan, A., Weiss, S.B., & Weiss, A.D. (1999). GLM versus CCA spatial modeling of plant species distribution.Plant Ecology,143(1), 107–122. doi:10.1023/A:1009841519580
Haala, N., & Kada, M. (2010). An update on automatic 3D building reconstruction. ISPRS Journal of Photogrammetry and Remote Sensing, 65(6), 570–580. doi:10.1016/j.isprsjprs.2010.09.006
Hastings, D.A., & Clark, D.M. (1991). GIS in Africa: Problems, challenges and opportunities for co-operation. International Journal of Geographical Information System, 5(1), 29–39. doi:10.1080/ 02693799108927829
Hegazy, I.R., & Kaloop, M.R. (2015). Monitoring urban growth and land use change detection with GIS and remote sensing techniques in Daqahlia governorate Egypt. International Journal of Sustainable Built Environment, 4(1), 117–124. doi:10.1016/j. ijsbe.2015.02.005
Hill, R.D., Moate, C.P., & Blacknell, D. (2006). Urban scene analysis from SAR image sequences. In E.G. Zelnio & F. D. Garber (Eds..),SPIE proceedings, algorithms for syn-thetic aperture radar imagery XIII, Orlando (Vol. 6237, pp. 623702). SPIE. doi:10.1117/12.664418
Hu, F., Gao, X.M., Li, G.Y., & Li, M. (2016). DEM extrac-tion from WorldView-3 stereo images and accuracy evaluation. International Archives of Photogrammetry Remote Sensing and Spatial Information Sciences, 41. 327-332.
Im, J., Jensen, J.R., & Tullis, J.A. (2008). Object-based change detection using correlation image analysis and image seg-mentation.International Journal of Remote Sensing,29(2), 399–423. doi:10.1080/01431160601075582
Jensen, J.R., & Cowen, D.C. (1999). Remote sensing of urban/suburban infrastructure and socio-economic attributes. Photogrammetric Engineering and Remote Sensing,65, 611–622.
Jha, M.K., & Chowdary, V.M. (2007). Challenges of using remote sensing and GIS in developing nations. Hydrogeology Journal, 15(1), 197–200. doi:10.1007/ s10040-006-0117-1
JICA. (2010).The study on integrated development strategy for da nang city and its neighboring area in the socialist republic of vietnam (DaCRISS): Final Report. December 2010. Tokyo. Retrieved fromhttp://open_jicareport.jica. go.jp/pdf/12014924.pdf
Kadhim, N., & Mourshed, M. (2018). A shadow-overlapping algorithm for estimating building heights from VHR satellite images. IEEE Geoscience
and Remote Sensing Letters, 15(1), 8–12. doi:10.1109/ LGRS.2017.2762424
Kelbe, D., White, D., Hardin, A., Moehl, J., & Phillips, M. (2016). Sensor-agnostic photogrammetric image regis-tration with applications to population modeling. In 2016 IEEE International Geoscience & Remote Sensing Symposium: Proceedings: July 10-15, 2016, Beijing, China (pp. 1831–1834). Piscataway, NJ: IEEE. doi:10.1109/ IGARSS.2016.7729470
Kopecká, M., & Rosina, K. (2014). Identification of changes
in urbanized landscape based on VHR satellite data: Study area of Trnava.GeografickýČasopis. 66. 247-267. Lefebvre, A., Nabucet, J., Corpetti, T., Courty, N., &
Hubert-Moy, L. (2016). Extraction of urban vegetation with Pleiades multiangular images. In T. Erbertseder, T. Esch, & N. Chrysoulakis (Eds.), SPIE proceedings, remote sensing technologies and applications in urban environments.Vol. 10008, pp. 100080H-1. SPIE Remote Sensing, Edinburgh. doi:10.1117/12.2241162
Leiser, S. (2011). Institutionalization does not occur by decree: Institutional obstacles in implementing a land administration system in a developing country. In Z. Nedovic-Budic, J. Crompvoets, & Y. Georgiadou (Eds.), Spatial data infrastructures in context: North and South(pp. 21–48). CRC press. Boca Raton. Linh, N.H.K., Erasmi, S., & Kappas, M. (2009). Quantifying
land use/cover change and landscape fragmentation in Danang City, Vietnam: 1979-2009.Aster,2, 4.
Liu, C., Huang, X., Wen, D., Chen, H., & Gong, J. (2017). Assessing the quality of building height extraction from ZiYuan-3 multi-view imagery.Remote Sensing Letters,8 (9), 907–916. doi:10.1080/2150704X.2017.1335904
Lu, L., Guo, H., & Corbane, C. (2013). Building damage assessment with VHR images and comparative analysis for Yushu Earthquake, China.Disaster Adv,6, 37–44. Mikhail, E.M., Bethel, J.S., & McGlone, J.C. (2001).
Introduction to modern photogrammetry. New York. Moskal, L.M., Styers, D.M., & Halabisky, M. (2011).
Monitoring urban tree cover using object-based image analysis and public domain remotely sensed data. Remote Sensing, 3(10), 2243–2262. doi:10.3390/ rs3102243
Mundia, C.N., & Aniya, M. (2005). Analysis of land use/cover changes and urban expansion of Nairobi city using remote sensing and GIS.International Journal of Remote Sensing, 26(13), 2831–2849. doi:10.1080/01431160500117865
Olsen, M.J., Chen, Z., Hutchinson, T., & Kuester, F. (2013). Optical techniques for multiscale damage assessment. Geomatics, Natural Hazards and Risk, 4(1), 49–70. doi:10.1080/19475705.2012.670668
Panagiotakis, E., Chrysoulakis, N., Charalampopoulou, V., & Poursanidis, D. (2018). Validation of Pleiades Tri-Stereo DSM in urban areas. ISPRS International Journal of Geo-Information, 7(3), 118. doi:10.3390/ ijgi7030118
Patino, J.E., & Duque, J.C. (2013). A review of regional science applications of satellite remote sensing in urban settings. Computers, Environment and Urban Systems, 37, 1–17. doi:10.1016/j.compenvurbsys.2012.06.003
Peng, F., Gong, J., Le Wang, W.H., & Yang, J. (2016). Impact of building heights on 3D urban density estima-tion from spaceborne stereo imagery. International Archives of Photogrammetry Remote Sensing and Spatial Information Sciences,41, 677. doi: 10.5194/isprsarchives-XLI-B3-677-2016
Perko, R., Raggam, H., Gutjahr, K., & Schardt, M. (2014). Assessment of the mapping potential of Pléiades stereo
and triplet data. ISPRS Annals of the Photogrammetry, Remote Sensing and Spatial Information Sciences, 2(3), 103. doi:10.5194/isprsannals-II-3-103-2014
Poli, D., & Caravaggi, I. (2012). Digital surface modelling and 3D information extraction from spaceborne very high resolution stereo pairs. JRC Scientific and Technical Reports, Ispra. doi:10.1094/PDIS-11-11-0999-PDN
Poli, D., Remondino, F., Angiuli, E., & Agugiaro, G. (2015). Radiometric and geometric evaluation of GeoEye-1, WorldView-2 and Pléiades-1A stereo images for 3D information extraction. ISPRS Journal of Photogrammetry and Remote Sensing, 100, 35–47. doi:10.1016/j.isprsjprs.2014.04.007
Rashed, T., & Jürgens, C. (2010).Remote sensing of urban and suburban areas. Springer Science & Business Media. Berlin, Heidelberg.
Rebelo, C., Rodrigues, A.M., Tenedório, J.A., Goncalves, J. A., & Marnoto, J. (2015). Building 3D city models: Testing and comparing Laser scanning and low-cost UAV data using FOSS technologies. In International Conference on Computational Science and Its Applications, Girona(pp. 367–379).
Rottensteiner, F., & Briese, C. (2002). International archives of photogrammetry remote sensing and spatial information sciences. A New Method for Building Extraction in Urban Areas from High-Resolution LIDAR Data,34(3/A), 295–301.
Rouse, J.W., Haas, R.H., Schell, J.A., & Deering, D.W. (1973). Monitoring the vernal advancement and retro-gradation (green wave effect) of natural vegetation. Salehi, B., Zhang, Y., Zhong, M., & Dey, V. (2012).
Object-based classification of urban areas using VHR imagery and height points ancillary data. Remote Sensing, 4(8), 2256–2276. doi:10.3390/rs4082256
Satterthwaite, D., & Mitlin, D. (2012).Urban poverty in the global south: Scale and nature. Routledge. London. Schell, L.M., & Denham, M. (2003). Environmental
pollu-tion in urban environments and human biology.Annual Review of Anthropology, 32(1), 111–134. doi:10.1146/ annurev.anthro.32.061002.093218
Shahtahmassebi, A.R., Song, J., Zheng, Q., Blackburn, G.A., Wang, K., Huang, L.Y., . . . Haghighi, R.S. (2016). Remote sensing of impervious surface growth: A framework for quantifying urban expansion and re-densification mechanisms. International Journal of Applied Earth Observation and Geoinformation, 46, 94–112. doi:10.1016/j.jag.2015.11.007
Shalaby, A., & Tateishi, R. (2007). Remote sensing and GIS for mapping and monitoring land cover and land-use changes in the Northwestern coastal zone of Egypt. Applied Geography, 27(1), 28–41. doi:10.1016/j. apgeog.2006.09.004
Soergel, U., Michaelsen, E., Thiele, A., Cadario, E., & Thoennessen, U. (2009). Stereo analysis of high-resolution SAR images for building height estima-tion in cases of orthogonal aspect direcestima-tions. ISPRS Journal of Photogrammetry and Remote Sensing, 64(5), 490–500. doi:10.1016/j.isprsjprs.2008.10.007
Sportouche, H., Tupin, F., & Denise, L. (2011). Extraction and three-dimensional reconstruction of isolated build-ings in urban scenes from high-resolution optical and SAR spaceborne images. IEEE Transactions on Geoscience and Remote Sensing, 49(10), 3932–3946. doi:10.1109/TGRS.2011.2132727
Straub, C., Stepper, C., Seitz, R., & Waser, L.T. (2013). Potential of UltraCamX stereo images for estimating timber volume and basal area at the plot level in mixed
European forests. Canadian Journal of Forest Research, 43(8), 731–741. doi:10.1139/cjfr-2013-0125
Topan, H., Taskanat, T., & Cam, A. (2013). Georeferencing accuracy assessment of Pléiades 1A images using rational function model. International Archives of the Photogrammetry, Remote Sensing and Spatial Information Sciences,7, W2.
Tsai, Y.H., Stow, D., & Weeks, J. (2011). Comparison of object-based image analysis approaches to mapping new buildings in Accra, Ghana using multi-temporal QuickBird satellite imagery. Remote Sensing, 3(12), 2707–2726. doi:10.3390/rs3122707
Unger, J., Reich, M., & Heipke, C. (2014). UAV-based photogrammetry: Monitoring of a building zone. International Archives of Photogrammetry Remote Sensing and Spatial Information Sciences, 40(5), 601. doi:10.5194/isprsarchives-XL-5-601-2014
Vasconcellos, E.A. (2014). Urban transport environment and equity: The case for developing countries. Routledge. London.
Wei, C., Blaschke, T., Kazakopoulos, P., Taubenböck, H., & Tiede, D. (2017). Is spatial resolution critical in urbani-zation velocity analysis? Investigations in the pearl river delta.Remote Sensing,9(1), 80. doi:10.3390/rs9010080
Weiss, A.D. (2001). Topographic position and landforms analysis: Poster presentation. ESRI User Converence, San Diego, CA.
Weng, Q., Quattrochi, D., & Gamba, P.E. (2018). Urban remote sensing. CRC press. Boca Raton.
Wickramasinghe, D.C., Vu, T.T., & Maul, T. (2018). Satellite remote-sensing monitoring of a railway
construction project. International Journal of Remote Sensing, 39(6), 1754–1769. doi:10.1080/01431161.201 7.1415481
Xu, Y., Ma, P., Ng, E., & Lin, H. (2015). Fusion of worldView-2 stereo and multitemporal TerraSAR-X images for building height extraction in urban areas. IEEE Geoscience and Remote Sensing Letters, 12(8), 1795–1799. doi:10.1109/ LGRS.2015.2427738
Yu, B., Liu, H., Wu, J., Hu, Y., & Zhang, L. (2010). Automated derivation of urban building density information using airborne LiDAR data and object-based method. Landscape and Urban Planning, 98(3–4), 210–219. doi:10.1016/j. landurbplan.2010.08.004
Yuan, F., Sawaya, K.E., Loeffelholz, B.C., & Bauer, M.E. (2005). Land cover classification and change analysis of
the twin cities (Minnesota) metropolitan area by multi-temporal Landsat remote sensing. Remote Sensing of Environment, 98(2–3), 317–328. doi:10.1016/j. rse.2005.08.006
Zhou, W., & Troy, A. (2008). An object-oriented approach for analysing and characterizing urban land-scape at the parcel level. International Journal of Remote Sensing, 29(11), 3119–3135. doi:10.1080/ 01431160701469065
Zhou, Y., Parsons, B., Elliott, J.R., Barisin, I., & Walker, R. T. (2015). Assessing the ability of Pleiades stereo ima-gery to determine height changes in earthquakes: A case study for the El Mayor-Cucapah epicentral area. Journal of Geophysical Research: Solid Earth, 120 (12), 8793–8808.