Submitted version - accepted for publication in Review of Policy Research
State Renewable Energy Governance: Policy Instruments, Markets, or Citizens
2015
Sunjoo Park, PhD
Visiting Assistant Professor and PEER Fellow School of Public and Environmental Affairs Indiana University-Purdue University Indianapolis
parksunj@iupui.edu Phone: 317-274-8709
Key words:policy instrument, policy tool, renewable energy policy, RPS, renewable electricity, electricity market, electricity generation
ABSTRACT
Since the 1990s, state governments in the U.S. have diversified policy instruments to encourage the electric power industry to deploy renewable sources for electricity generation. This study identifies the trends and variations in renewable energy policy governance among states and examines the effectiveness of policy instruments in the deployment of renewable energy sources for electricity production. This study explores 18 state legislative, renewable energy related regulations, programs, or financial incentives existing between 2001 and 2010 in 48 states in the United States. Renewable energy policies were classified into three types of policy approaches: command-and-control, market-based, and information instruments. Results suggest that
authoritative approaches are more likely to be effective in the governmental intervention toward a pre-existing market, and information instruments and citizen participation became important in the power industry in the 2000s. In addition, it gives us some evidence that Federal assistance under the ARRA of 2009 influenced the overall growth of the renewable electricity industry, in addition to state government led policy designs.
Introduction
In the 1990s, a new era of renewable energy began in the United States. While electric power markets lost their taste for the federal level incentives under PURPA of 1978, a number of new renewable energy policies were adopted at the state level in the process of the electricity market restructuring. Examples of state level policies driving renewable energy development include renewable portfolio standards (RPS), state financial incentives, voluntary purchase of green power, and information disclosure. State governments’ renewable energy policy designs vary considerably in magnitude and diversity of the policy instruments adopted.
As the number of state level renewable energy policies has increased, so have policy analyses and evaluations focusing on individual programs (Carley, 2009; Delmas and Montes-Sancho, 2011; Delmas, Montes-Montes-Sancho, and Shimshack, 2010; Menz and Vachon, 2006; Shrimali and Kniefel, 2011; Yin and Powers, 2010). Studies (Carley, 2011) have reviewed the innovation and evolvement of several prominent state renewable energy policies and gave insights of policy effects by putting previous empirical findings together. However, an effort is still needed to synthesize comprehensive trends of renewable energy policies and to analyze what type of government approach works better than others under the current setting of the renewable energy markets. To answer these questions, this study incorporates all ranges of state level policy instruments for renewable energy development and attempts to identify the trends and variations in policy design among states.
In order to trace and understand policy changes over time, categorization of policy instruments has been considered a necessary step in developing an effective indicator (OECD, 2001; Persson, 2006; Richards, 2000). Analyzing the aggregate level policy instruments could provide an overview of the diverse policy mixes, enabling the analysis of the effectiveness of
each policy instrument and thus the development of optimal combinations of policy design (Lascoumes and Le Gales, 2007; Vedung, 1998).
This study collects historical data on 18 types of renewable energy policies that have been adopted in the 50 states and D.C. in the U.S, and groups them based on the tri-fold policy instruments classificatory scheme: command-and-control, market-based, and information instruments. These three categories of policy instruments enable us to at least partially understand if a state mainly appeals to forceful or coercive policy tools, if it offers financial incentives to the industry, or if the state persuades policy targets by educating and informing market suppliers and consumers. The final analysis was conducted to compare the effectiveness of policy instruments on renewable energy deployment in 48 states, excluding Hawaii, Alaska, and D.C. Retrospective examination of the effectiveness of diverse policy instrument can prospectively suggest the government’s future steps regarding better development of renewable energy production. In addition, this study can contribute to the body of knowledge of public policy instrument study by applying previously suggested classificatory schemes to real world cases.
Public Policy Instruments
Public policy instruments are defined as “a set of techniques by which governmental authorities—or proxies acting on behalf of governmental authorities—wield their power in attempting to ensure support and effect social change” (Vedung, 1998). Choosing appropriate policy approaches and instruments is important because “the use of various policy instruments for governance purposes will probably have different consequences on the nature of addressee responses” (Vedung, 1998).
In the contemporary public policy environment of governance, policy instruments have undergone innovation, development, and diversification. However, diversification and
magnification of policy instruments without supportive evidence of their effectiveness through a carefully designed and conducted evaluation of given policy instrument mixes do not guarantee the governments will achieve policy goals. There has been a call for studies on policy
instruments to: 1) evaluate the effectiveness of various policy instruments and 2) analyze the circumstances under which policy instruments can be successfully implemented (Bennear and Stavins, 2007; Howlett, 2004; Bernstein, 1993; Vedung, 1998). Empirical effectiveness
evaluations of governing instruments also contribute to a valid test of classification schemes for policy instruments. This study applies empirical analysis in a quest to answer these crucial research questions.
Categorization of Public Policy Instruments – Typology of Policy Instruments
Classification of policy instruments varies based on differing assumptions. Traditional distinction divides policy instruments into regulatory versus market-based or economic
instruments (Bernstein, 1993; Callan and Thomas, 2004; Harrington, Morgenstern, and Sterner, 2004; Stavins, 1991). Market-based policy instruments were introduced as alternative
environmental policy approaches from the 1980s through the 1990s. Economists argue that market-based instruments allow polluters more flexibility to respond according to their self-interests (Callan and Thomas, 2004; Harrington et al., 2004).
Schneider and Ingram (1990) classify policy tools based on motivational devices embedded in policy tools that empower people. Policies implicitly guide people to take actions that conform to policy goals. Schneider and Ingram (1990) point out five reasons that people do
not take actions: (1) lack of authority of law to direct them, (2) lack of incentives, (3) lack of capacity, (4) disagreement with the implicit value of policy goals, and (5) high level of uncertainty. They then define five policy tools addressing those five reasons—authority, incentive, capacity, symbolic/hortatory, and learning tools—and argue that the policy tools reflect the political culture.
Vedung (1998) and OECD (1994) define policy instruments with a tri-fold classificatory scheme: regulation (the stick), economic means (the carrot), and information (the sermon). Vedung (1998) embodies Etzioni (1975)’s work as a basis of the trifold scheme of policy instruments. Etzioni (1975) claimed three kinds of power which are means of controlling subjects to comply and to achieve organizational purposes. He defines coercive, remunerative, and normative power as means for control purposes.Vedung (1998) attempts to characterize policy instruments with three defining properties: (1) coercion, (2) the use of material resources, and (3) intellectual or moral appeals.
This study applies the three categories of policy instruments proposed by Vedung (1998) to classify state level renewable energy policies: command-and-control, market-based, and information instruments. This study chooses the tri-fold classificatory scheme because it covers recently evolved innovative policy tools such as information disclosure that is not under
consideration within the traditional distinction between regulation and incentives. Another merit of using the tri-fold classification of policy instruments is that the three categories are exclusive and applicable to a variety of issues. Three defining properties of policy instruments suggested by Vedung (1998) are employed to classify renewable energy policies. The three properties look at whether policy/program uses (1) coercion, (2) material resources, and (3) intellectual or moral
appeals to alter people’s behavior. i Figure 1 illustrates the three types of policy instruments that this study refers to for the analysis.
Insert Figure1 here
Command-and-Control Policy Instruments
Policy instruments implemented by governmental units to influence targets through authoritative means are defined as command-and-control (or regulatory) instruments. Under the command-and-control policy, target persons or agents respond to what they are told by the controllers (OECD, 1994; Schneider & Ingram, 1990; Vedung, 1998). The defining property of command-and-control (or regulation) instruments is the authoritative nature of the relationship between controller/government agency and target population (Vedung, 1998).ii Subtypes of command-and-control policy instruments include performance and process standards, licenses/permits, bans, and zoning (Gunningham and Sinclair, 1999; Vedung, 1998).
Market-Based Instruments
In an effort to convince people to find the government-desired behavior more
economically attractive than the undesired one, governments try to alter the market conditions or economic frameworks through economic instruments (Enzensberger, et al., 2002). Underneath the market-based approach lies an assumption that individuals are utility maximizers who take opportunities to make choices in their own best interests. Incentive instruments rely on tangible pay-offs, such as money, life, and liberty, to motivate target people to comply with or utilize policies. Market-based instruments include charges, subsidies, grants, and loans operated with a medium degree of coercion on public units; also, tax expenditures such as tax credits,
deductions, and exemptions are considered relatively less coercive economic incentives (Vedung, 1998; OECD, 1994; Salamon, 2002).
Information Instrument
The third category of policy instruments is information instrumentsiii that influence target people through knowledge transfer, communication, and persuasion. Information instruments assume that lack of knowledge and skills prevents potential targets from making the best decision possible. If target agents are informed, they will choose a preferred alternative policy (Schneider and Ingram, 1990).
There are two types of information regarding policy instruments: information as and information on. One is information as a policy instrument in itself. The other is “metapolicy instrument” that is used to convey the knowledge of other policy instruments’ existence, availability, and meaning (Vedung, 1998). Vedung (1998) calls the latter type of information, “information on policy instruments.” Information instruments are regarded as modern forms of governmental intervention and the least coercive instruments, which is called a sermon or exhortation (Vedung, 1998). This paper includes both types of information—information on and
as policy instruments.
Classification of Renewable Energy Policies
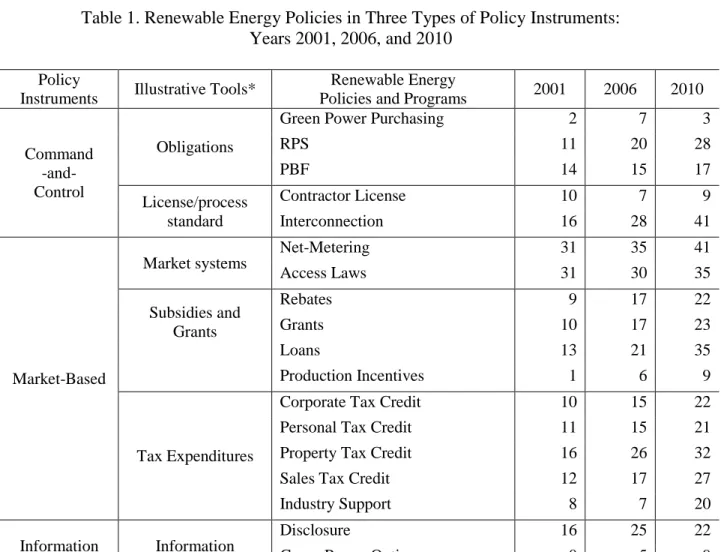
The scope of this study is the entire range of legislative regulations, programs and incentives that the U.S. state governments have adopted to support electricity generation from renewable resources. Table 1 overviews 18 state level policies in support of renewable energy development and classifies those individual policies into three categories—command-and-control, market-based approach, and information instruments. The primary source of the
renewable energy policy data used in this study is the Database of State Incentives for
Renewable and Efficiency (DSIRE).iv Under each policy instrument category, renewable energy
policies and programs are sub-categorized by the virtue of each illustrative tool (Salamon, 2002)v for better understanding of the classification criteria and rationale. Some policies have features that cross the boundaries of the tri-fold classification scheme. This study focuses on the core and primary means of policy through which state governments attempt to increase the deployment of renewable energy in electricity markets. For instance, some studies (Wiser, Namovicz, Gielecki, and Smith, 2007) described Renewable Portfolio Standards as a “market-friendly” policy
instrument, highlighting the renewable energy credits (RECs) trading permits for RPS
enforcement. However, the primary and core function of RPS is to restrict eligible renewable technologies and requires electricity producers to adopt a specific technology to increase supply and/or demand of renewable energy (Delmas and Montes-Sancho, 2011). In regard to the quantity-based obligation set by states, RPS is defined as a command-and-control instrument with a high degree of coerciveness in this study.
This study identified five renewable energy policies and programs as command-and-control instruments: mandatory renewable portfolio standards (RPS), green power purchasing programs, public benefit funds (PBF), contract licenses, and interconnection standards. As of August 2010, 29 states and the D.C. had legally binding RPSs and seven of which had renewable portfolio goals. In the analysis, only mandatory RPS were included. Among these five policy instruments, RPS, PBF, and green power purchasing programs are identified as obligations because state governments use coercive and authoritative tools to achieve compliance.
Interconnection standards and contractor licenses are grouped separately as process standards.
States have diversified market-oriented policy instruments. State governments currently use eleven kinds of policies, programs or financial support designed to motivate electric
producers to deploy renewable energy technologies. This study places net-metering programs and access laws under the market-based policy instrument because they attempt to lower market barriers and assure property rights for the new developers entering the market.
One of the most popular tools adopted by state governments is providing financial assistance to power suppliers. State governments offer various tax expenditures such as sales, property, personal, and corporate tax abatements for the purchase and/or installation of
renewable energy equipment. States also award grants or loans to electric power producers for increasing investment in renewable energy development. Governments can render the electricity market environment more favorable for energy developers by using market approaches.
Increasing numbers of states have adopted a new type of policy instrument; information to alter the behavior of electric power suppliers. Some states require electricity suppliers to inform customers about the sources of energy or the amount of greenhouse gas emission. Another informative instrument that state governments encourage power companies to offer is green power options. Intellectual and moral appeals baseline these two informative instruments.
Insert Table1 here
Trends in Policy Designs and Renewable Energy Development
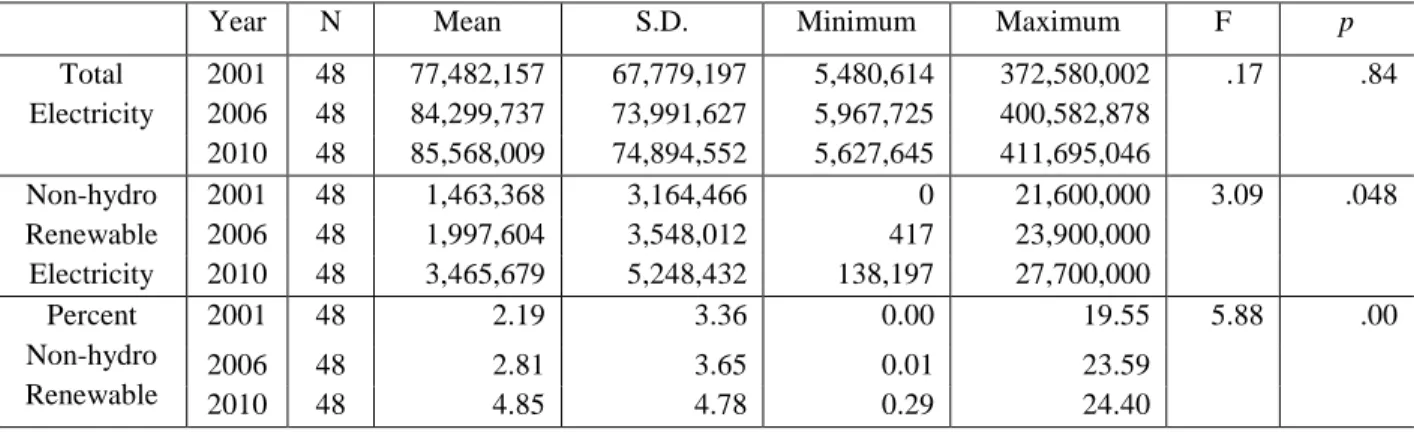
As of 2010, 48 states generated a total of 4,107 TWh electricity, which grew by 10.4% compared to 2001. Meanwhile, the 48 states increased their use of non-hydro renewable sources by 139% between 2001 and 2010. The electricity industry had a rapid growth in the share of
hydro renewable sources in electricity generation from 1.9% in 2001 to 4% in 2010 (see Table 2).
Insert Table2 here
State governments have actively intervened in the renewable energy market during the 2000s. The average number of renewable energy policies adopted by state governments has nearly doubled between 2001 and 2010. The 48 state governments had adopted only one command-and-control type policy instrument, on average, for motivating renewable energy producers in 2001, but in 2010 states, on average, utilized two kinds of command-and-control instruments (Table 1). A massive increase is seen in market-based instruments used by state governments. State governments offered, on average, six types of market-based incentives for the power producers to deploy more renewable energy technologies in 2010. State governments also introduced a new information instrument between 2001 and 2010.
Policy instruments also became diversified in the sense that new policy instruments— mandatory green power purchasing, production incentives, green power options—were
introduced and adopted during the period. In the early 2000s, the most popular policy approaches to the electricity market were net-metering and access laws. These are economic regulations that reduce market barriers and provide assurance of property rights for solar and wind access. State governments began setting up electric power markets favorable to renewable energy developers by using policy instruments characterized by medium level coerciveness, rather than highly coercive command-and-control instruments. During and after the period of electricity
restructuring, however, very coercive command-and-control instruments—RPS, interconnection and PBFs—were adopted in many states. Also information disclosure of power industries had
been mandated in many states during that time period. Financial incentives including various tax expenditures and governmental subsidies and grants have increasingly been adopted as states’ policy instruments supporting renewable energy development. For recent years, new policy instruments such as performance-based or production incentives and green power options have been introduced and adopted at the state level (Table1).
Research Design: Models and Hypotheses
Conceptual and Analytical Models
This study examines the effectiveness of renewable energy policy instruments using cross-sectional time series data: 48 states for the time span between 2001 and 2010. Alaska, Hawaii, and D.C. are excluded due to missing data for some control variables and their
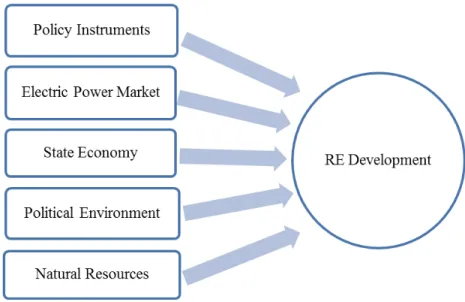
uniqueness of electricity systems. The timeframe 2001-2010 was chosen because this period saw a significant development in non-hydro renewable energy generation, and many states introduced innovative policy instruments during this time. Another reason was that the state policy data for the 18 renewable energy policies and all states were only available since 2001. Longitudinal data gives more information and variability, and more degrees of freedom which allows exploration of more issues than time-series or cross-sectional data (Baltagi, 2001; Kennedy, 2008; Park, 2011). Figure 2 illustrates the postulated causal directions of the dependent and independent variables. It models a directional association of policy instruments and other factors with
renewable energy development. The model enables a statistical isolation of the marginal effect of each policy instrument, holding all other factors constant. At the same time, this study stipulates which other control variables are likely to impact renewable energy (RE) development. With the
context of this model, one can find a mechanism through which factors induce the electric power industry to produce renewable electricity under the given conditions of states.
Insert Figure2 here
This study employs a fixed-effects model to answer the research question on whether the increase in renewable electricity generation is attributable to variation in policy instruments adopted by states, ceteris paribus. Fixed-effects estimate is useful for policy analysis and program evaluation, because it allows investigators to study the causes of change in outcome variables within an entity (Wooldridge, 2012). Model 1 shows the statistical models of this study using fixed-effects estimate. This model allows us to explore the effectiveness of each type of policy instrument on states’ renewable energy deployment. This model also allows us to compare the relative explanatory power of policy instruments.
𝑅𝑅𝑖𝑖𝑖𝑖 = 𝛼𝛼0+ 𝛽𝛽 ∗ 𝐼𝐼𝑖𝑖𝑖𝑖 + 𝛿𝛿 ∗ 𝐶𝐶𝑖𝑖𝑖𝑖+ 𝛾𝛾𝑆𝑆𝑖𝑖 + 𝜃𝜃𝑇𝑇𝑖𝑖 +𝜀𝜀𝑖𝑖𝑖𝑖 Model 1
where “i” denotes a state, and “t” denotes a year of the observation;𝛼𝛼 denotes intercepts; 𝑅𝑅𝑖𝑖𝑖𝑖 denotes the total renewable electricity generation; 𝐼𝐼𝑖𝑖𝑖𝑖 denotes the policy instruments indices (command-and-control, market-based, and information instruments) existing in a state (i) in a certain year (t); 𝐶𝐶𝑖𝑖𝑖𝑖 denotes other control variables; 𝑆𝑆𝑖𝑖 denotes the vector of state dummy variables; 𝑇𝑇𝑖𝑖 denotes the vector of year dummy variables; and 𝜀𝜀𝑖𝑖𝑖𝑖 denotes the error term.
Research Hypotheses on the Effectiveness of Policy Instruments
Three primary research hypotheses are built upon the three types of states renewable energy policy instruments: command-and-control, market-based, and information instruments. This study examines the effectiveness of the state governments’ intervention in the renewable
energy market. Existence of positive effect of a certain policy approach/instrument can be interpreted in a way that the current mechanism of the renewable energy market needs a governments’ policy guide based on the behavioral assumption under the pertaining policy instrument (Schneider and Ingram, 1990; Vedung, 1998).
Command-and-control type policy instruments mainly represented by rules, regulations, and standards, are considered to be effective with respect to the accomplishment of policy goals (Campbell, et al., 2004; Harrington, et al., 2004; Weimer and Vinning, 1999). Without a specific policy goal or standard by the Federal government, the states’ use of coercion as a policy tool encourages the electric industry’s use of renewable electricity and is expected to appropriately and effectively increase the production and share of renewable electricity. Several empirical studies support the positive association between RPS adoption and renewable energy
development (Carley, 2009; Delmas and Montes-Sancho, 2011; Menz and Vachon, 2005; Shrimali and Kniefel, 2011), while a few do not find a significant relationship (Yin and Powers, 2010). This study expects that the introduction of additional command-and-control policy instruments in the given electric markets will show a significant increase in the use of renewables for electricity generation.
H1: The more command-and-control type of policy instruments a state has, the more renewable sources will be deployed in electricity generation in that state.
The next hypothesis is about the effectiveness of market-based policy instruments in the renewable electricity market. Since the 1980s, market-based policy tools have been regarded as important and innovative because of their relative cost effectiveness pertaining to the flexibility given to policy targets in implementation process (Callan and Thomas, 2004; Hammar, 2006;
Harrington et al., 2004). At the same time, however, it is uncertain that market-based policies alone will be effective in altering people’s behavior to accomplish policy goals (Bernstein, 1993; Hammar, 2006). The U.S. federal government has offered financial assistance, including feed-in-tariffs and tax expenditures before state governments began intervening in the electric power industry. Hence, this study questions the possibility that existing electricity industry’s use of renewable sources would significantly increase with additional introduction of economic incentives by state governments. Some previous empirical studies on renewable energy development (Carley, 2009; Delmas and Montes-Sancho, 2011; Shrimali and Kniefel, 2011) suggested a weak association between economic incentive tools and renewable energy capacity or production. Based on these conceptual discussions and insights from previous studies, this study builds its second research hypothesis that holding all others variables constant, additional adoption of state level economic incentives would work effectively in the current renewable energy market.
H2: The more market-based policy instruments a state has, the more renewable sources will be deployed in electricity generation in that state.
The last research hypothesis pertains to the effectiveness of information instruments introduced by state governments. Information instruments are relatively new and emerging policy tools, encompassing direct information or knowledge about the existence and availability of other related policies (Vedung, 1998). It is argued that using information as policy tools increases public awareness about essential policy issues and thus helps both market producers and consumers to be well informed (Stavins, 2003; Stephan, 2002; Weiss, 2002). Recent empirical studies including information disclosure and/or green power option programs show a positive effect of respective programs in the renewable electricity industry (Delmas and Monte,
2011; Shrimali and Kniefel, 2011). This study argues a positive association between a state’s adoption of diverse information instruments and the deployment of renewables in the existing electricity industry.
H3: The more information instruments a state has, the more renewable sources will be deployed in electricity generation in that state.
The following section presents independent and dependent variables, operational definition of variables and data sources that help test the abovementioned three major research hypotheses.
Variables and Data
Dependent Variables
Actual electricity generation using non-hydro renewable sources is used to measure the policy effects. This study excludes conventional hydro power from its definition of renewable energy because recent state policies have aimed at supporting solar, wind, or biomass energy technologies while conventional hydroelectric facilities have recently been considered
environmentally unfriendly. Two operational definitions are employed to measure the renewable energy development in states. Each is modeled as an effect of renewable energy policies. One is the amount of net generation of electricity from non-hydro renewable energy sources; the other is the relative use of renewables in electricity production, which means the share of non-hydro renewables in power generation in states.
The share of non-hydro renewables is used because the relative use of non-hydro
renewables in electric power production is not always proportional to the absolute amount of the
electricity generated from renewable sources in the states. For instance, Maryland and
Massachusetts experienced a decline in the total MWh of electricity production from renewable sources between 2006 and 2010, but the proportion of renewable sources used in electricity generation increased for the same period due to the overall decrease in electricity production in two states.
With two different variables, this study provides compelling evidence of the effectiveness of public policy instruments as well as to examine the determinants of absolute and relative use of renewable energy technologies in electricity markets respectively. Energy Information Administration provides data on annual net generation of electricity by state by source.vi
Renewable Energy Policy Instruments
This study measures the trifold scheme of policy instruments comparable to each other in order to examine the variation of policy effectiveness between policy instruments instead of individual programs. However, there is a lack of empirical studies that classify and measure the entire range of individual programs and incentives in a certain issue into types of policy
instruments in the purpose of comparison of the effectiveness between them. Persson (2006) states, “identifying instruments may involve problems of aggregation, in that it may be unclear what constitutes a single instrument and what measures are sub-components of an instrument. Consistency in the identification exercise is the only way to overcome this problem.”
This study develops aggregate indices to measure the magnitude and diversity of renewable energy policy instruments. First, this study constructs a dummy variable for each of 18 policies and program: equal to one if a state has a renewable energy policy, and equal to zero if the state does not have a program in a given year (Carley, 2009; Delmas and Montes-Sancho,
2011). Each renewable energy program or policy is equally weighted and added up by the type of policy instrument. The command-and-control instrument includes five renewable energy programs, and its index ranges from zero to five. Eleven renewable energy programs and incentives are assigned to the market approach instrument, ranging from zero to eleven. The information instrument contains two programs.vii
This study reviews 18 state level policies and programs supporting renewable energy development across 48 states between 2001 and 2010. The major data sources of renewable energy policies discussed in this study are the Database of State Incentives for Renewable Energy (DSIRE), the National Renewable Energy Laboratory (NREL), and the Energy Efficiency and Renewable Energy (EERE) at the U.S. Department of Energy (DOE).viii
Other Variables
In order to isolate the effects of policy instruments on states’ renewable energy
development, alternative explanations have to be considered and factored in as control variables. This study examines that state specific characteristics including electricity market conditions, economic and political environments, and natural endowments influence the power industry’s decision to deploy renewable sources.
Electricity market conditions
Electric generators’ use of renewable energy sources and technologies should be at least partially determined by the supply and demand equilibrium under the given conditions and characteristics of electricity markets. First of all, the overall size of the electricity market in a state is considered to see if the increase or decrease of electricity demand affects electricity producers’ choice of resources as well as to control the size differences among states in terms of
electricity consumption. Annual total amount of electricity sales (MWh) within a state,
consumed by residential, commercial, and industrial sectors, is used to measure the overall size of the state’s power market. Electricity sales data is available at EIA.
Natural gas price and electricity price are considered to affect the consumption of renewable sources in power generation (Birds, et al., 2005; Carley, 2009; Shrimali and Kniefel, 2011). Some argue that high natural gas prices are positively associated with renewable
electricity generation, because as a substitute of renewable resources, high wholesale prices of natural gas make renewable energy relatively competitive and cause electric producers to shift to use of relative cost competitive alternative energy (Bird, et al., 2005; Shrimali and Kniefel, 2011). It is argued that the higher the price of electricity, the less likely consumers and electric utilities will want further investment in relatively expensive renewable sources for electricity generation. Instead, electric generators may switch the source of power generation from natural gas to cheaper fossil fuel (Carley, 2009; EIA, 2009; Shrimali and Kniefel, 2011). This study includes both the natural gas price and electricity price of states. States’ annual average retail electricity price and wholesale natural gas prices for electricity generation are obtained from
State Electricity Profile, reported by EIA.ix
This study also includes states’ use of nuclear energy. There are conflicting views on the relationship between states’ tendencies to deploy nuclear power and renewable energy
technologies. A country or state may choose nuclear power technology to displace fossil fuel with preference toward more diverse fuel mix or alternative energy sources. When we consider a state’s use of nuclear power as an indicator of the state’s interest in diversification of energy source, we may expect the state also to invest in other renewable sources (Kneifel, 2009).
However, a country or a nation’s nuclear power capacity may also be an impediment, if it is used as a substitute, to deployment of renewable energy technologies.
States’ net import/export of electricity is considered as a possible factor affecting the electricity industry’s use of renewable sources (Yi and Feiock, 2014; 2012; Yin and Powers, 2010). For instance, states that heavily depend on electricity imported from other states may have incentives to search for alternative energy sources available to their states and to increase their energy independency. On the other hand, electricity exporter states may use relatively cheap energy sources to generate electricity exceeding their needs and make profits through electricity transmission and distribution between states. In this case, states would have little advantage in deploying renewable energy technologies which have higher initial cost and longer time to gain returns. This study measures a state’s electricity import/export ratio by net generation of
electricity over total electricity sales within the state. The underlying assumption is that a state exports whatever portion of its electricity production exceeds total demand in the state. An electricity export index bigger than unify indicates a positive net export of electricity of a state; export index smaller than 1 refers positive net import of electricity from other states.
This study includes the mode of electric utility service that influences renewable energy development in states. Private utilities are expected more likely to be responsive to state introduction of various renewable energy policies, compared to publicly owned utilities such as municipal utilities and rural cooperatives which are usually exempted from renewable energy standards (Deyett, et al. 2003).x This study measures the percent of electricity sales (MWh) sold by investor-owned utilities over total electric utility sales in each state.1
1 Energy Information Administration issues Electric Sales, Revenue, and Average Price data by state and utility.EIA, http://www.eia.gov/electricity/sales_revenue_price/index.cfm
20
State economic characteristics
States’ overall economic conditions also play significant roles in the production and consumption of renewable energy. It is hypothesized that a wealthy state can invest more in environmentally friendly projects (Ringquist, 1994; Sapat, 2004). Previous empirical findings show that actual electricity generation from renewable sources is associated with state wealth (Carley, 2009), but not so as with nameplate capacity (Delmas and Monte-Sancho, 2010;
Shrimali and Kniefel, 2011; Yin and Power, 2010). The expectation here would be that the more state wealth increases, the more that renewables will be used for electricity generation. State wealth is measured by per capita gross state product (GSP) in constant 2005 dollar value. Historical GSP data is available at Bureau of Economic Analysis.
Industry-based interest groups are considered to be obstacles to pro-environmental legislation because environmental policies result in an increase in the production cost or the reduction in demand for their products (Sapat, 2004; Vachon and Menz, 2006). The presence of sizable stakeholder groups who view renewable energy policies as negative propositions would detract the governmental support and legislation for renewable energy development and
adversely influence the development of renewable electricity markets (Carley, 2009; Vachon and Menz, 2006). This study examines whether the petroleum and coal product manufacturing and mining industries influence the power industry’s decision to use renewable energy technologies. The relative strength of industry-based interest groups is measured by the percentage of gross state product (GSP) attributable to each industry over total GSP.
Political environment
Public policy literature enables consideration of states’ contextual factors in driving variations in policy instruments choice (Berry and Berry, 1990; Daley and Garand, 2005; Feiock and West, 1993; Howlett, 2004). Policy instrument choice is not politically neutral and is guided by policy activities. A political environment not only affects instrument choice, but also is expected to influence the ultimate policy implementation (Peters, 2002). To evaluate policy instruments, hence, political factors shaping policy instrument choice should be considered.
States’ political environment has been operationalized with a variety of different variables such as the preferences of state legislators and the nature of the constraints in the implementation process (Clark and Whitford, 2011; Daley and Garand, 2005; Bressers 1998; Bressers and O’Toole, 1998; Schneider and Ingram, 1990).xi The presence of a Democratic governor and majority Democratic representatives have been shown to be positively associated with the adoption of renewable energy policies and investment in renewable energy
infrastructure (Delmas and Montes-Sancho, 2011). State legislators’ preferences regarding environmental policy is measured by their voting history on environmental issues, as found in environmental scorecard of the League of Conservation Voters (LCV) (Clark and Whitford, 2011; Carley, 2009; Delmas and Montes-Sancho, 2011; Shrimali and Kneifel, 2011; Vachon and Menz, 2006).xii This study assumes that renewable energy development is a subset of
environmental issues, so that state legislators’ preferences for renewable energy policies moves in the same direction as their commitment to overall environmental policy.
Social interest in environmental issues is considered to facilitate pro-environmental legislation including renewable energy policies. Empirical studies have shown that states with more participants in environmental interest groups are more likely to adopt the renewable energy policies (Vachon and Menz, 2006), and also are likely to deploy more renewable energy
technologies (Delmas and Montes-Sancho, 2011). This study hypothesizes that the level of citizen participation in environmental issues is positively associated with renewabele energy delployment in states. This study measures the degree of social interest in environmental issues by the number of Sierra Club chapter memberships per 1,000 people in each state (Delmas and Montes-Sancho, 2011; Hall and Kerr, 1991; Sapat, 2004).xiii
Once a policy is adopted, policy outcomes are affected depending upon the
administrative capacity of institutions that monitor and enforce the policy (Sapat, 2004). This study considers the relative size of public agencies working for natural resources within states to measure the states’ administrative capacity to implement renewable energy policies (Carley, 2009). This study uses, per million residents, number of state and local governments’ employees, full-time equivalent (FTE), assigned to the government function of natural resources.xiv
Natural endowment
The variation in renewable energy production among states is assumed in part driven by the renewable resource endowment (Bird et al., 2005). Natural potential of renewable energy resources such as solar, wind, and biomass is geographically-oriented, idiographic, and not transportable between states.Different from previous studies (Carley, 2009; Delmas and Montes, 2011; Russo, 2003), a time-variant measure of wind potentials is used to look at the association of natural endowment and renewable energy deployment within states.xv Wind speed is critical to electricity generation because wind power density, the amount of energy in the wind, is
proportional to the cube of wind speed (Center for Sustainable Systems, 2012).
The final control variables are year dummies. To control the heterogeneity attached to years, year dummies with 2001 reference are included. There are some variables which must
have influenced the renewable energy industry, but are hard to allocate to states, such as recent economic downturn and recovery in the U.S. or federal efforts to develop renewable energy under the American Recovery and Reinvestment Act of 2009 (ARRA). This study is especially interested in the year effects of 2009 and 2010 when the Federal government awarded cash grants to renewable electricity developers under ARRA.
Insert Table3 here
Empirical Results
This study conducts a fixed-effects panel analysis with year-fixed dummy variables to analyze the time-series cross-sectional data. Cluster-robust standard errors are used to account for the heteroskedasticity and serial autocorrelation found in the model (Drukker, 2003; Wooldridge, 2003). Table 4 presents the result from two different fixed-effects estimates: one with a dependent variable equal to total amount of electricity generated from non-hydro renewable sources; the other with a dependent variable equal to the share of non-hydro renewable electricity generation.
Insert Table 4 here
The first fixed effect model, Model 1, fits the panel data used in the anaysis well (F = 7.05 and R2 = 0.56). The results of Model 1 show that the number of command-and-control type of policy instruments has a positive and significant association with the amount of electricity generated from non-hydro renewable sources. To interpret the coefficienct, holding all others constant, an additional adoption of regulatory renewable energy policy is associated with a 15.6% increase in renewable electricity generation in a state. However, the market approach index and information instrument index do not have statistically significant associations with the
amount of renewable electricity generation in states. The regression results also indicate other predictors of states’ net generation of renewable electricity. States’ per capita gross product has a positive and significant association with the amount of net renewable electricity generation, as does the total electricity sales within states. A 1% increase in gross state product is associated with a 1.96% increase in net generation of renewable electricity while a 1% increase in total electricity sales within a state would increase net renewable electricity generation by 3.3%. The coefficient of relative size of Sierra Club is positive and significant. A 10% increase of
environmental group memberships would increase deployment of renewable energy by 11%. States’ wind energy potential has a positive and strong association with the amount of non-hydro renewable electricity generation, while wholesale price of natural gas has a positive association at marginal level.
The fixed effect estimates of Model 2 demonstrate determinants of the share of renewable electricity within states (F = 5.0 and R2 = 0.44). The command-and-control policy instrument index has a positive and significant association with the share of renewable electricity
generation. Each additional adoption of command-and-control policy instrument is associated with a 10% increase in the share of renewable electricity. For instance, given the average share of renewable electricity at 3%, additional adoption of a regulatory policy instrument would increase the share of renewable electricity to 3.3%. The coefficient of information instruments index is positive and significant, at the 10% significant level. The growth rate of the share of renewables in electricity generation would be increased by 20% when a state adopts additional information instrument. Market-based instruments have not significantly affected the share of renewables in electricity generation. Per capita GSP and the relative size of a state’s Sierra Club memberships have positive and significant associations with the share of renewable electricity,
so as the natural gas price and wind energy potential. States’ electricity export ratio is negatively and significantly associated with the share of renewable electricity generation. The coefficients of year dummies 2009 and 2010 in both models are consistently significant and positive
compared to year 2001.
Discussion
Both the increases in the amount and share of renewable electricity were attributed to the adoption of more command-and-control policy instruments. This implies that the diversification of authoritative and coercive approaches of state governments’ intervention in electric power industries has effectively altered the power suppliers’ choice of energy sources from
conventional to non-hydro renewables. Even though regulatory approaches have been criticized with respect to cost-effectiveness and flexibility, authoritative and coercive governance tools are effective in achieving policy goals especially in the area where market systems do not generate socially appropriate goods and services (Harrington et al., 2004).
Regarding market-based instruments, results did not find significant evidence of
effectiveness. The results verified the theoretical arguments that market-based policy instruments or economic incentives do not guarantee the achievement of policy goals (Hammar, 2006;
Harrington, et al., 2004). The results are also consistent with prior empirical studies that examined the influence of financial incentives on renewable energy capacity or production (Carley, 2011; Delmas and Montes, 2011). A possible explanation is that these market-based instruments, adopted by states, failed to incentivize or motivate people to use renewable energy technologies in electricity production. While market players in the electric power industry benefited from using given market-based instruments, the renewable energy outcome did not meet state governments’ expectations (Hammar, 2006). In either case, the states’ market-based
policy designs did not seem appropriate or effective as a catalyst for renewable energy production until 2010.
Further, financial incentives including tax expenditures, subsidies or loans may mislead the energy market. Electricity producers may enjoy the economic benefits from purchasing and installing renewable energy equipment offered by the governments to reduce their cost of electricity generation from renewable sources. However, at the same time, electricity producers may want to invest more, as much as they save from governmental support for renewables, in purchasing their conventional sources of electricity such as coal or natural gas. If this is the case, financial incentives can hardly be expected to show the expected short-term outcomes in terms of proportion of renewables of total electricity generation.
This study showed results consistent with prior empirical studies that estimated the effects of individual informative programs (Yin and Power, 2009, Shrimali and Kniefel, 2011, Delmas and Montes-Sancho, 2011). They found a positive and significant impact of green power options on renewable energy capacity. This study showed that the number of information
instruments did not explain the amount of electricity generation from renewable sources, but helped to explain the share of renewables in electricity production. A possible explanation is that information given to consumers does not necessarily translate to new investment in renewable energy systems. Instead, the availability of information influences electric power producers to choose to alter the sources of energy from conventional to renewable sources. This story is moreover supported by the positive and significant influence of citizen interest in environmental issues on the amount and share of renewable electricity in states.
Once policy instruments have been adopted, achievement of policy goals may depend on citizen participation and market conditions rather than political preferences and environments. Put another way, people may or may not be motivated by the same policy instruments, for instance, tax incentives, to alter their behavior depending on their pre-existing interest and preference for the environment and green energy. Citizens with favorable preferences toward environmental issues could either be consumers or producers of renewable electricity, or both. As consumers, they could exercise their pressure on electric power utilities to use clean energy sources. Alternatively, they can generate renewable electricity as independent power producers, or produce combined heat and power using renewable energy equipment.
State wealth measured by per capita GSP was the single most important factor accounting for variation in the increase in electricity production using renewable sources. Such results suggest that wealthy states have more interest and capacity to invest in environmentally friendly projects (Ringquist, 1994; Sapat, 2004), which is consistent results what previous empirical studies found (Carley, 2009; Shrimali and Kniefel, 2011; Delmas and Monte-Sancho, 2010). Even though this study examined the impact of state wealth on renewable electricity production, it is possible that the state wealth induces investment in clean energy industry either from inside or outside state developers.
Electricity market conditions significantly affect the actual use of renewable source for electricity production in a given year. Natural gas price inversely correlates with utilization of renewable energy technologies in electricity production. A huge decline in natural gas prices in the early 90s hindered the growth rate of renewable energy as industry stagnated; the Energy Crisis in California in early 2000s motivated Western states to invest more in alternative power sources. Interestingly, the average retail price of electricity does not seem significant in both
models, while natural gas price consistently seem to serve as an important factor. This implies that electricity suppliers care about the cost-effectiveness or efficiency and consider non-hydro renewables as their alternative resources to reduce the cost of production. On the other hand, the sales price or retail price at which consumers purchase electricity does not seem to influence power suppliers’ choice of energy sources in any ways.
A state’s experience of importing electricity is also an important determinant of the relative use of renewable sources for electricity generation. The more a state imports electricity from other states, the larger the share of renewable electricity. This study assumed that those states that export of a greater proportion of electricity is less likely to replace their conventional sources of electricity production with non-hydro renewables. Conversely, those states that import more electricity from other states for their in-state consumption are likely to use relatively more renewable sources to produce electricity. It is also possible that a state may increase its import of electricity from other states by intention of exporting carbon emissions generated from coal-fired power production, while promoting renewable energy technologies within the state.
The results suggest that both net generation and share of renewable electricity increased significantly in 2009 and 2010. The economic recession between 2008 and 2010 was originally expected to slow the increase in renewable energy sector. However, at least partially due to the heavy investment offered by the Federal Stimulus Package—cash grant in lieu of tax credit to renewable energy project developers under ARRA of 2009—renewable electricity has
increasingly generated during the period of economic recession. In fact, between 2008 and 2010, average annual growth rate of the total amount of renewable electricity, from non-hydro
renewable sources, was 16.7%, more than twice the average annual growth rate of the previous three years (8.2%) in the U.S.xvi The results of this study with significant year dummies 2009 and
2010 give us evidence that Federal assistance under the ARRA of 2009 influenced the overall growth of the renewable electricity industry, in addition to state government led policy designs. Further investigation is required to assess the influence of the Federal Stimulus on renewable energy development—approximately $31 billion has been invested by the Energy Department on clean energy projects since 2009. The analytic models developed by this research can provide a very useful basis for future estimates of state specific impact of the Recovery Act of 2009 on renewable energy markets.
Conclusion
There was significant variation in renewable energy policy designs among states over time. However, some commonalities among these policy instruments also emerged. Without a well-designed policy evaluation, it is hard to say if states have developed and used the policy instruments due to the effectiveness, policy fashion, or diffusion from neighboring states.
To date, command-and-control types of policy instruments such as renewable portfolio standards have been regarded as the dominant and effective tools in the electric power markets for an increase of renewable electricity production. However, it is too early to assume that the authoritative and coercive policy approach is the best instrument. It is only in the recent years that the government has intervened in the electricity market using the command-and-control instruments, which have the possibility to achieve policy goals at a faster rate than other instruments (Harrington et al. 2004).
Similarly, the insignificant effects of market-based instruments revealed by the analysis results do not mean that state governments need to stop financial supports for renewable energy developers. The market-approach may take a longer time to affect the electric power industry.
We may need to wait until the investment in renewable energy technologies and equipment are effectively operating. Another issue stems from the possibility that Federal support for renewable energy industries, under the ARRA of 2009, diminished the impact of states-setting incentive systems for the renewable energy market. In that case, continuing experiments and evaluation of market-based policy instruments are necessary for improvement of policy designs.
Over the long history of the federal government’s support for electric power sectors using fossil fuel and nuclear power, renewable electricity has been at a competitive disadvantage. As long as fossil fuel or nuclear-based electricity is being incentivized and given huge tax breaks, renewable energy policies, especially financial incentives, will experience difficulties in taking immediate effects. In addition, increased availability of oil and gas achieved by recently
permitted shale drilling in the U.S. may put a brake on the recent trend of increasing deployment of renewable energy technologies. As oil and gas extraction businesses boom, the market
equilibrium of supply and demand would move the natural gas price downward, which affects electric power producers’ choice of energy sources, consistent with the analysis results. Therefore, policy makers must have a comprehensive consideration when they make policy designs for renewable energy development.
Analytical results showed that both informative/voluntary instruments and social interest in the environment are important. Together with citizen “Go Green programs,” sermons to the electric industry become important. Under given circumstances, financial and institutional capacity, one of the possible and effective ways that state and local governments can approach deployment of renewable electricity is to educate and enlighten both suppliers and consumers of electricity. Innovative policy instruments such as information, education, and voluntary
agreements are highly recommended to be designed. 31
REFERENCES
Baltagi, B. H. (2001). Econometric Analysis of Panel Data. New York: John Wiley& Sons, Inc. Bennear, L. S. and Stavins, R. N. (2007). Second-Best Theory and the Use of Multiple Policy
Instruments. Environmental Resource Economics, 37: 111-129.
Bernstein, J. D. (1993). Alternative Approaches to Pollution Control and Waste Management: Regulatory and Economic Instruments, The World Bank, Washington, DC.
Berry, F. S. and Berry, W. D. (1990). State Lottery Adoptions as Policy Innovations: An Event History Analysis. The American Political Science Review, 84(2): 395-415.
Bird, L., Bolinger, M., Galiano, T., Wiser, R., Brown, M., and Parsons, B. (2005). Policies and Market Factors Driving Wind Power Development in the United States. Energy Policy, 33:1397-1407.
Bressers, H. (1988). A Comparison of the Effectiveness of Incentives and Directives: The Case of Dutch Water Quality Policy. Policy Studies Review, 7(3): 500-518.
Bressers, H. and O’Toole, L. (1998). The Selection of Policy Instruments: A Network-Based Perspective. Journal of Public Policy, 18(3): 213-239.
Carley, S. (2009). State Renewable Energy Electricity Policies: An Empirical Evaluation of Effectiveness. Energy Policy, 37: 3071-3081.
Carley, S. (2011). The Era of State Energy Policy Innovation: A Review of Policy Instruments.
Review of Policy Research, 20(3): 265-294.
Callan, S. J. and Thomas, J. M. (2004). Environmental Economics and Management: Theory, Policy, and Applications. Mason, Ohio: Thomson South-Western.
Campbell, H. E., Johnson, R. M., and Larson, E. H. (2004). Prices, Devices, People, or Rules: The Relative Effectiveness of Policy Instruments in Water Conservation. Review of Policy Research, 21(5): 637-662.
Center for Sustainable Systems (2012). Wind Energy in the U.S. Factsheet. Pub. No. CSS07-09. University of Michigan.
Clark, B. Y. and Whitford, A. B. (2011). Does More Federal Environmental Funding Increase or Decrease States’ Efforts? Journal of Policy Analysis and Management, 30(1): 136-152. Daley, D. M. and Garand, J. C. (2005). Horizontal Diffusion, Vertical Diffusion, and Internal
Pressure in State Environmental Policymaking, 1989-1998. American Politics Research, 33(5): 615-644.
Delmas, M. and Montes-Sancho, M. R. (2011). US States Policies for Renewable Energy: Context and Effectiveness. Energy Policy, 39(5): 2273-2288.
Delmas, M, Monte-Sancho, M, R., and Shimshack, J. P. (2010). Information Disclosure Policies: Evidence from the Electricity Industry. Economic Inquiry, 48(2): 483-498.
Deyett, J., Clemmer, S., and Donovan, D. (2003). Plugging in Renewable Energy: Grading the States. Union of Concerned Scientists, Cambridge, MA.
Drukker, D. M. (2003). Testing for serial correlation in linear panel-data models. Stata Journal 3
(2), 168–177.
EIA (2009). Short-Term Energy Outlook Supplement: The Implications of Lower Natural Gas Prices for the Electric Generation Mix in the Southeast. Energy Information
Administration.
Enzenberger, N., Wietschel, M., and Rentz, O. (2002). Policy Instruments Fostering Wind Energy Projects: a multi-perspective evaluation approach. Energy Policy, 30: 793-801. Etzioni, A. (1975). A Comparative Analysis of Complex Organizations: On Power, Involvement,
and their Correlates, rev. ed. New York: Free Press.
Feiock, R. C. and West, J. P. (1993). Testing Competing Explanations for Policy Adoption: Municipal Solid Waste Recycling Programs. Political Research Quarterly, 46(2): 399-419.
Gunningham, N. and Sinclair, D. (1999). Regulatory Pluralism: Designing Policy Mixes for Environmental Protection. Law & Policy, 21(1): 49-76.
Hall, B. and Kerr, M. L. (1991). 1991-1992 Green Index: A State-by-State Guide to the Nation’s Environmental Health. Washington, DC: Institute for Southern Studies.
Hammar, H. (2006). Editorial: The Search for Effective Environmental Policy Instruments.
European Environment, 16: 181-183.
Harrington, W., Morgenstern, R. D., and Sterner, T. edt. (2004). Choosing Environmental Policy: Comparing Instruments and Outcomes in the United States and Europe. Resources for the Future. Washington, DC.
Howlett, M. (2004). Beyond Good and Evil in Policy Implementation: Instrument Mixes, Implementation Styles, and Second Generation Theories of Policy Instrument Choice.
Policy and Society, 23(2): 1-17.
Kennedy, P. (2008). A Guide to Econometrics, 6th ed. Malden, MA: Blackwell Publishing. Kneifel, J. D. (2009). Government Policies Promoting the Accelerated Deployment of
Non-Hydro Renewable Electricity Generation Resources. Available at
http://warrington.ufl.edu/purc/purcdocs/papers/0616_Kneifel_Government_Policies_Pro moting.pdf
Lascoumes, P. and Le Gales, P. (2007). Introduction: Understanding Public Policy through Its Instruments—From the Nature of Instruments to the Sociology of Public policy
Instrumentation. Governance: An International Journal of Policy, Administration, and Institutions, 20(1): 1-21.
Menz, F. C. and Vachon, S. (2006). The Effectiveness of Different Policy Regimes for Promoting Wind Power: Experience from the States. Energy Policy, 34: 1786-1796. Organization for Economic Co-operation and Development (OECD) (1994). Managing the
Environment: The Role of Economic Instruments. Paris: OECD. OECD (2001). OECD Environmental Outlook. Paris: OECD.
Park, H. M. (2011). Practical Guides to Panel Data Modeling: A Step-by-step Analysis Using Stata. Tutorial Working Paper. Graduate School of International Relations, International University of Japan.
Persson, Å. (2006). Characterizing the Policy Instrument Mixes for Municipal Waste in Sweden and England. European Environment, 16: 213-231.
Peters, G. B. (2002). The Politics of Tool Choice. In The Tools of Government: A Guide to the New Governance, Salamon, L. M. (ed.). New York: Oxford University Press. 552-564. Richards, K. R. (2000). Framing Environmental Policy Instrument Choice. Duke Environmental
Law & Policy Forum, 5(2): 221-285.
Ringquist, E.J. (1994). Policy influence and policy responsiveness in state pollution control.
Policy Studies Journal, 22 (1): 25–43.
Salamon, L. M. (2002). The New Governance and the Tools of Public Action: An Introduction. In L. M. Salamon (ed.) The Tools of Government: A Guide to the New Governance, pp. 1-47. New York: Oxford University Press.
Sapat, A. (2004). Devolution and innovation: the adoption of state environmental policy
innovations by administrative agencies. Public Administration Review, 64 (2): 141-151. Schneider, A. and Ingram, H. (1990). Behavioral Assumptions of Policy Tools. Journal of
Politics, 52(2): 510-520.
Shrimali, G. and Kniefel, J. (2011). Are Government Policies Effective in Promoting Deployment of Renewable Electricity Resources? Energy Policy, 39: 4726-4741.
Stavins, R. N. ed. (1991). Project 88 – Round II Incentives for Action: Designing Market-Based Environmental Strategies. Washington, DC.
Stephan, M. (2002). Environmental Information disclosure Programs: They Work, but Why?
Social Science Quarterly, 83(1): 190-205.
Vachon, S. and Menz, F. (2006). The Role of Social, Political, and Economic Interests in
Promoting State Green Electricity Policies. Environmental Science & Policy, 9: 652-662. Vedung, E. (1998). Policy Instruments: Typologies and Theories. in M. L. Bemelmans-Videc, R. C. Rist and E. Vedung, eds, Carrots, Sticks, and Sermons: Policy Instruments and Their Evaluation, PP. 21-58. New Jersey: Transaction Publishers.
Weiss, J. A. (2002). Public Information. In L. M. Salamon (ed.) The Tools of Government: A Guide to the New Governance, pp. 217-254. New York: Oxford University Press.
Weimer, D. L. and Vinning, A. R. (1999). Policy Analysis Concepts and Practice. Upper Saddle River, New Jersey: Prentice Hall.
Wiser, R., Namovicz, C., Gielecki, M., and Smith R. (2007). The Experience with Renewable Portfolio Standards in the United States. The Electricity Journal, 20(4): 8-20.
Wooldridge, J. M. (2003). Cluster-sample methods in applied econometrics, American Economic Review Papers and Proceedings, 93(2), 133-138.
Wooldridge, J. M. (2012). Introductory Econometrics: A Modern Approach. 5th ed. South Western Educational Publishing.
Yi, H. and Feiock, R.C. (2012). Policy Tool Interactions and the Adoption of State Renewable Portfolio Standards. Review of Policy Research, 29(2): 193-206.
Yi, H. and Feiock, R.C. (2014). Renewable Energy Politics: Policy Typologies, Policy Tools, and State Deployment of Renewables. Policy Studies Journal, 42(3): 391-415.
Yin, H. and Powers, N. (2010). Do state renewable energy portfolio standards promote in-state renewable generation? Energy Policy, 38:1140-1149.
Figure 1. Basic Trifold Typology of Policy Instruments
Table 1. Renewable Energy Policies in Three Types of Policy Instruments: Years 2001, 2006, and 2010
Policy
Instruments Illustrative Tools*
Renewable Energy
Policies and Programs 2001 2006 2010
Command -and- Control
Obligations
Green Power Purchasing 2 7 3
RPS 11 20 28 PBF 14 15 17 License/process standard Contractor License 10 7 9 Interconnection 16 28 41 Market-Based Market systems Net-Metering 31 35 41 Access Laws 31 30 35 Subsidies and Grants Rebates 9 17 22 Grants 10 17 23 Loans 13 21 35 Production Incentives 1 6 9 Tax Expenditures
Corporate Tax Credit 10 15 22
Personal Tax Credit 11 15 21
Property Tax Credit 16 26 32
Sales Tax Credit 12 17 27
Industry Support 8 7 20
Information Information
Disclosure 16 25 22
Green Power Option 0 5 9
Source: by Author
Note: Salamon (2002) uses the term, “tool” or “instrument” interchangeably at the most descriptive level. He defines a tool of public action as “an identifiable method through which collective action is structured to address a public problem.” Salamon (2002) calls them as “illustrative tools” and groups them together based on various criteria such as degree of coerciveness, directness, automaticity, visibility, etc.
Policy Instruments
Command-and-Control Market-Based Information
Figure 2. Conceptual Framework of Analysis
Table 2. Electricity Generation by Year (MWh, %)
Year N Mean S.D. Minimum Maximum F p
Total Electricity 2001 48 77,482,157 67,779,197 5,480,614 372,580,002 .17 .84 2006 48 84,299,737 73,991,627 5,967,725 400,582,878 2010 48 85,568,009 74,894,552 5,627,645 411,695,046 Non-hydro Renewable Electricity 2001 48 1,463,368 3,164,466 0 21,600,000 3.09 .048 2006 48 1,997,604 3,548,012 417 23,900,000 2010 48 3,465,679 5,248,432 138,197 27,700,000 Percent Non-hydro Renewable 2001 48 2.19 3.36 0.00 19.55 5.88 .00 2006 48 2.81 3.65 0.01 23.59 2010 48 4.85 4.78 0.29 24.40 38
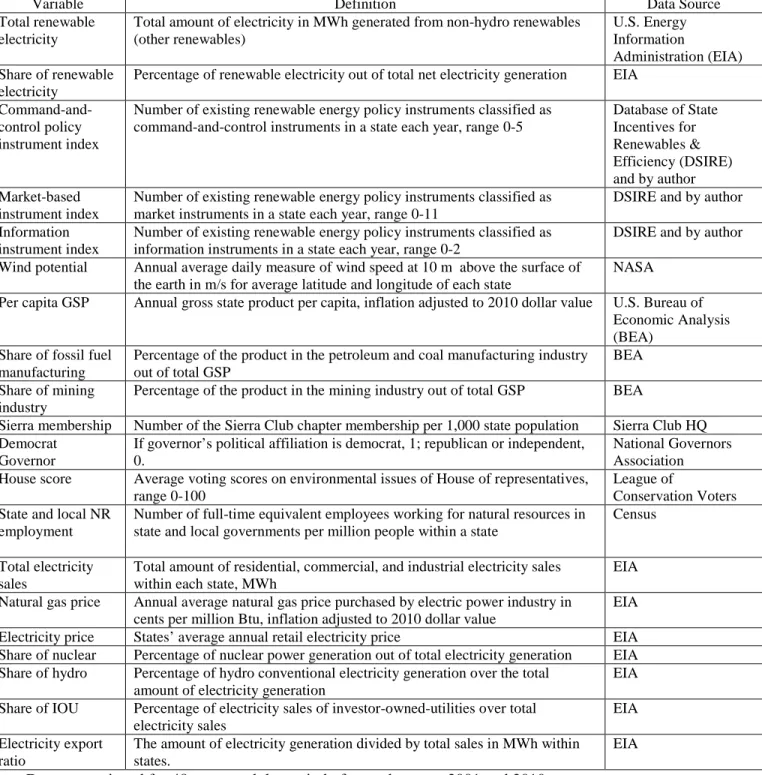
Table 3. Variable definitions and data sources
Variable Definition Data Source
Total renewable electricity
Total amount of electricity in MWh generated from non-hydro renewables (other renewables) U.S. Energy Information Administration (EIA) Share of renewable electricity
Percentage of renewable electricity out of total net electricity generation EIA
Command-and-control policy instrument index
Number of existing renewable energy policy instruments classified as command-and-control instruments in a state each year, range 0-5
Database of State Incentives for Renewables & Efficiency (DSIRE) and by author Market-based instrument index
Number of existing renewable energy policy instruments classified as market instruments in a state each year, range 0-11
DSIRE and by author
Information instrument index
Number of existing renewable energy policy instruments classified as information instruments in a state each year, range 0-2
DSIRE and by author
Wind potential Annual average daily measure of wind speed at 10 m above the surface of the earth in m/s for average latitude and longitude of each state
NASA
Per capita GSP Annual gross state product per capita, inflation adjusted to 2010 dollar value U.S. Bureau of Economic Analysis (BEA)
Share of fossil fuel manufacturing
Percentage of the product in the petroleum and coal manufacturing industry out of total GSP
BEA
Share of mining industry
Percentage of the product in the mining industry out of total GSP BEA
Sierra membership Number of the Sierra Club chapter membership per 1,000 state population Sierra Club HQ Democrat
Governor
If governor’s political affiliation is democrat, 1; republican or independent, 0.
National Governors Association House score Average voting scores on environmental issues of House of representatives,
range 0-100
League of
Conservation Voters State and local NR
employment
Number of full-time equivalent employees working for natural resources in state and local governments per million people within a state
Census
Total electricity sales
Total amount of residential, commercial, and industrial electricity sales within each state, MWh
EIA
Natural gas price Annual average natural gas price purchased by electric power industry in cents per million Btu, inflation adjusted to 2010 dollar value
EIA
Electricity price States’ average annual retail electricity price EIA Share of nuclear Percentage of nuclear power generation out of total electricity generation EIA Share of hydro Percentage of hydro conventional electricity generation over the total
amount of electricity generation
EIA
Share of IOU Percentage of electricity sales of investor-owned-utilities over total electricity sales
EIA
Electricity export ratio
The amount of electricity generation divided by total sales in MWh within states.
EIA
Note: Data are retrieved for 48 states and the period of years between 2001 and 2010.
Table 4. Regression Results Variables Model 1: RE Generation (ln) Model 2: RE Share (ln) Command-and-control 0.156 (0.057)*** 0.102 (0.051)** Market-Based Approach -0.033 (0.026) -0.031 (0.025) Information Instruments 0.139 (0.116) 0.204 (0.114)* Wind potential (ln) 0.559 (0.182)*** 0.577 (0.173)*** Per capita GSP (ln) 1.955 (0.819)** 2.035 (0.834)**
% Fossil Fuel Manufacturing (ln) 0.042 (0.07) 0.054 (0.064)
% Mining (ln) 0.05 (0.049) 0.040 (0.046)
Sierra Membership (per 1,000) (ln) 1.116 (0.4)** 0.950 (0.407)**
Democrat Governor 0.128 (0.09) 0.121 (0.079)
LCV House Score 0.001 (0.002) 0.003 (0.003)
State & Local NR Emp (per million) (ln) -0.123 (0.226) -0.014 (0.252)
Total Electricity Sales (ln) 3.322 (1.382)** 1.545 (1.300)
Natural Gas Price (ln ) 0.589 (0.307)* 0.605 (0.288)**
Electricity Price (ln) -0.048 (0.188) -0.079 (0.212)
% Nuclear Power (ln) 0.289 (0.546) 0.086 (0.522)
% Hydro Power (ln) 0.043 (0.088) -0.007 (0.068)
% IOU (ln) 0.393 (0.357) 0.207 (0.334)
Electricity Export Ratio (ln) 0.201 (0.171) -0.452 (0.169)***
Year 2002a 0.002 (0.091) -0.014 (0.080) Year 2003 -0.113 (0.088) -0.125 (0.079) Year 2004 -0.1 (0.182) -0.166 (0.153) Year 2005 -0.224 (0.209) -0.279 (0.178) Yea