Borillo, GC
and
Tadano, YS
and
Godoi, AFL
and
Santana, SSM
and
Weronka, FM
and
Penteado Neto, RA
and
Rempel, D
and
Yamamoto, CI
and
Potgieter, SS
and
Potgieter, JH
and
Godoi, RHM
(2015)
Effectiveness of
Se-lective Catalytic Reduction (SCR) systems on reducing gaseous emissions
from an engine using Diesel and Biodiesel Blends.
Environmental Science
and Technology, 49 (5). pp. 3246-3251. ISSN 0013-936X
Downloaded from:
http://e-space.mmu.ac.uk/620398/
Publisher:
American Chemical Society
DOI:
https://doi.org/10.1021/es505701r
Please cite the published version
Effectiveness of Selective Catalytic Reduction (SCR) systems on
1reducing gaseous emissions from an engine using Diesel and Biodiesel
2Blends
34
Guilherme C. Borillo1, Yara S. Tadano2 Ana Flavia L. Godoi1; Simone S. M. Santana1;
5
Fernando M. Weronca1; Renato A. Penteado Neto3; Dennis Rempel3; Carlos I.
6
Yamamoto4; Sanja Potgieter-Vermaa5; J. Herman Potgieter6; Ricardo H. M. Godoi1*
7 8
*Corresponding Author: Environmental Engineering Department, Federal University 9
of Parana, 210 Francisco H. dos Santos St., Curitiba, PR, 81531-980 Brazil. Tel.: +55 10
41 3361-3482. E-mail address: [email protected] (R. H. M. Godoi). 11
12
1- Environmental Engineering Department, Federal University of Parana, Curitiba, PR, 13
Brazil. 14
2- Mathematics Department, Federal University of Technology - Parana, Ponta Grossa, 15
PR, Brazil. 16
3- Vehicle Emissions Laboratory, Lactec Institute, Curitiba, PR, Brazil. 17
4- Chemical Engineering Department, Federal University of Parana, Curitiba, PR, 18
Brazil. 19
5- Division of Chemistry and Environmental Science, School of Science and the 20
Environment, Manchester Metropolitan University, Manchester, UK 21
6- School of Chemical and Metallurgical Engineering, University of the Witwatersrand, 22
Johannesburg, South Africa. 23 24 25 26 27 28 29 30 31 ABSTRACT 32
There is an urgent and pressing need to further understand petroleum-based emission 33
control systems. To date, a limited number of emission studies have reported on the 34
effects on automotive emissions when vehicles equipped with Selective Catalytic 35
Reduction (SCR) systems run on a mixture of regular petroleum-based and biodiesel. 36
The aim of this investigation was to quantify organic and inorganic gas emissions from 37
a four-cylinder diesel engine equipped with urea-SCR system. Using a bench 38
dynamometer, the emissions from the following mixtures were evaluated using an 39
FTIR spectrometer: low sulphur diesel (LSD), ultra-low sulphur diesel (ULSD) and a 40
blend of 20 % soybean biodiesel and 80% ULSD (B20). Our results confirmed that the 41
use of the SCR system yields statistically significant (p<0.05) lower NOx emissions in
42
comparison to all the studied fuels. The LSD and ULSD fuels also significantly reduced 43
emissions of compounds with high photochemical ozone creation potential, such as 44
formaldehyde. However, the SCR system produced significantly (p<0.05) higher 45
emissions of N2O comparing the used fuels. In the case of LSD, the NH3 emissions
46
were elevated and in the case of ULSD and B20 fuels, the non-methane hydrocarbon 47
(NMHC) and total hydrocarbon (HCD) emissions were significantly higher. 48
49
Keywords: Selective Catalytic Reduction (SCR); biodiesel; hydrocarbons; diesel; 50
emissions; gaseous pollutants. 51 52 53 54 55 56 57
1.
Introduction 58There is an urgent and pressing need for in-depth understanding of petroleum-59
based emission control systems. Global pressure to meet emission standards lead to the 60
development and use of new engine technologies and as of late also for the use of new 61
fuels and fuel blends, such as ultra-low sulphur diesel and biodiesel blends. 62
Emissions depend on a variety of factors, such as engine technology, 63
maintenance and emission control technology,1 as well as the type and quality of the
64
employed fuel. Besides the greenhouse gas pollutants with global warming potential, it 65
is widely known that engine exhaust systems produce also organic gases that have an 66
impact on photochemical ozone and other secondary pollutants’ formation. Among 67
such different gases emitted by petroleum-based systems, nitrogen oxides (NOx) are
68
one of the major threats to the environment and therefore its emission in diesel engines 69
has been widely investigated.2-5 NO
x suppression strategies consist of combustion
70
controls, such as Selective Catalytic Reduction (SCR) systems, using a urea solution as 71
reducing agent, a well-established technique of stationary diesel engines.6-8 Biodiesel
72
seems to be a promising alternative, as it can be used in diesel engines without major 73
modifications,9 reducing qualitative and quantitatively several pollutant emissions.10-14
74
The use of biofuels and fuel blends, in combination with exhaust aftertreatment systems 75
as a means of mitigating emissions, are promising and therefore the topic of this 76
investigation. 77
New standard guidelines are being established worldwide concerning heavy-78
duty diesel engine emissions, aiming mostly at the simultaneous reduction of particles 79
and NOx (Euro V and Euro VI regulations in Europe and 40 Code of Federal
80
Regulations 86.007-11).15 In Brazil, the ruling legislation is equivalent to the Euro V 81
emission standards and it was established on January 1st, 2012, as a result of the seventh 82
stage of the Program to Control Vehicular Air Pollution (PROCONVE, in Portuguese).
83
In order to achieve the Brazilian air quality guidelines, the sulphur content of diesel 84
fuels was reduced and new aftertreatment systems have been implemented, with the 85
urea-SCR (Selective Catalytic Reduction) system being mostly utilized.4,5,16
86
To date, a limited number of emission studies have reported on the effects of 87
biodiesel additions to regular petroleum-based diesel on emissions from vehicles 88
equipped with Selective Catalytic Reduction (SCR) systems. 89
In order to fill the gap, the aim of this investigation was to quantify organic and 90
inorganic gas emissions (gas- and particle-phase) from a four-cylinder diesel engine 91
equipped with an urea-SCR system using Diesel or Biodiesel blends. 92
2.
Materials and methods 9495
In this study, we used an engine dynamometer following the European Steady 96
Cycle (ESC) testing cycle, in agreement with the Directive 1999/96/EC of the European 97
Parliament and the Directive of the December 13th, 1999 Council,17 which establishes
98
engine and dynamometer settings, and also NOx and other pollutants emission limits.
99
The dynamometer used in this study has a power output of 440 kW at 6000 rpm and a 100
torque of 2334 Nm. The engine employed is in accordance with the Euro V standards, 101
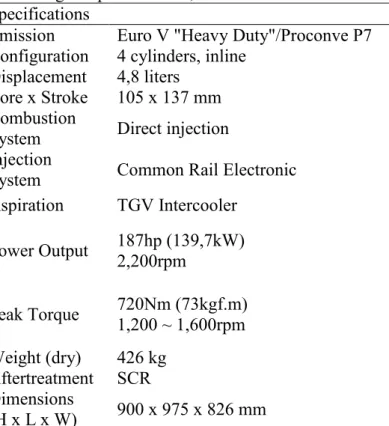
using an urea-SCR after-treatment system. Table 1 specifies the engine details. 102
103
Table 1. Engine specifications, BR- model 2012. 104
Specifications
Emission Euro V "Heavy Duty"/Proconve P7 Configuration 4 cylinders, inline
Displacement 4,8 liters Bore x Stroke 105 x 137 mm Combustion
System Direct injection Injection
System Common Rail Electronic Aspiration TGV Intercooler Power Output 187hp (139,7kW) 2,200rpm Peak Torque 720Nm (73kgf.m) 1,200 ~ 1,600rpm Weight (dry) 426 kg Aftertreatment SCR Dimensions (H x L x W) 900 x 975 x 826 mm 105
The emission data were sampled in the laboratory of vehicular emissions of the 106
Federal University of Parana –Curitiba/Brazil, employing an engine dynamometer 107
driving cycle using LSD (Low Sulphur Diesel - 50 ppm sulphur content), ULSD (Ultra 108
Low Sulphur Diesel - 10 ppm sulphur content) and B20 (soybean biodiesel blended 109
(20%) with ULSD). The main difference between LSD and ULSD is their sulphur 110
content, which may affect SO2 and particulate emissions. However, the cetane number
111
also differs and is considered a key fuel property comprising NMHC and CO 112
emissions.9,18
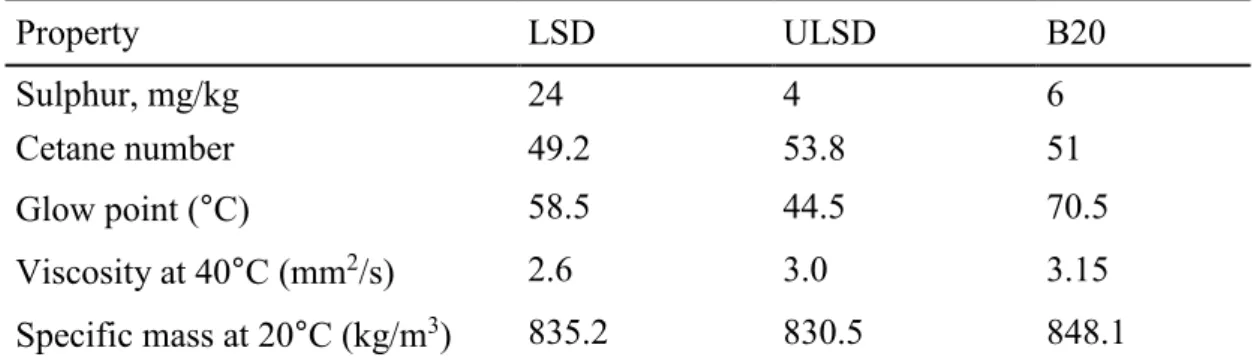
Table 2 shows the quality parameters of the reference diesel fuels and the biodiesel 114
blend used in this research. The Standard Test Methods established by ASTM were 115
followed. The main properties having an influence on exhaust emissions are sulphur 116
content and cetane number, as will be discussed in the results section. 117
118
Table 2. Fuel Properties of LSD and ULSD diesel and B20 biodiesel. 119 Property LSD ULSD B20 Sulphur, mg/kg 24 4 6 Cetane number 49.2 53.8 51 Glow point (°C) 58.5 44.5 70.5 Viscosity at 40°C (mm2/s) 2.6 3.0 3.15 Specific mass at 20°C (kg/m3) 835.2 830.5 848.1 120
The gas emission data were obtained by a SESAM i60 FT, a Fourier Transform 121
InfraRed (FTIR) multi-component measurement system from AVL. Table 3 presents 122
some important technical characteristics of the FTIR analysis. The FTIR was calibrated 123
to detect specific hydrocarbons (HC), nitrogen compounds (NO, NO2, N2O and NH3)
124
and other pollutants. It also calculates NOx, total (HCD) and non-methane
125
hydrocarbons (NMHC) concentrations. The HCD is the sum of all hydrocarbons that 126
FTIR can analyse using a method for diesel fuel (HCD = CH4, C2H2, C2H4, C2H6, C3H6,
127
C3H8, C4H6, nC8 and AHC-aromatic hydrocarbons). The HCD expresses the total
128
hydrocarbons (HC) for diesel emission analysis. The NMHC comprises the HCD 129
concentration, except for the methane fraction. 130
131
Table 3. FTIR settings. 132
FTIR Spectrometer Data
Sampling Rate 1 scan per second (1 Hz)
Data Rate All measured gas components at 1 Hz Spectral Resolution 0.5 cm-1
Measurement Cell Gas cell heated to 191 °C (375.8 °F) Response Time t10 to t90 within 1 s
Sample Flow Rate 10 l/min per stream Detector Cooling Liquid nitrogen, 50 ml/h
Zero/Purge Gas Nitrogen / Synthetic Air, 0.6 – 1.5 l/min Compressed Air 5 – 6 bar and max. 100 l/min per FTIR stream 133
3.
Results and discussions 134 135 3.1 Nitrogen Compounds 136 137Analysis of Variance (ANOVA), normal probability plot of residuals and Bartlett’s 138
test of homogeneity of variances were applied to the studied compounds. The statistical 139
analysis were performed using R software.19 A preliminary analysis showed that the
140
residuals have a normal distribution and a parametric behaviour. The Bartlett’s test 141
presented, for almost all samples, p-values less than the significance level of 0.05, 142
confirming the homogeneity of sample variances. In conclusion, the analysis of 143
variance results are valid, except for C2H2 and C2H6.
144
According to the analysis of variance results the means differ due to fuel and after-145
treatment system choice. To analyse the interactions between fuel and after-treatment 146
system, we applied the Tukey significant difference test. Differences between mean 147
values at a level of p < 0.05 (95% confidence level) were considered statistically 148
significant.20
149
Our results, presented in Table 4, have shown that, for all studied fuels the use of 150
the SCR system presented statistically significant different means of nitrogen oxides 151
(NOx), nitrogen monoxide (NO) and nitrogen dioxide (NO2) emissions, compared to
152
results when the SCR system was not used. Quantitatively, the use of the SCR system 153
decreased NOx, NO and NO2 concentrations.
154
According to Chin et al.1, some biodiesel blends may reduce emissions of regulated
155
pollutants, such as PM, CO, NMHC and CO2. However, it usually increases fuel
156
consumption and NOx emissions.
157
Only NO2 emission means showed statistically significant differences between
158
LSD and ULSD fuels when the engine was not equipped with the SCR system. 159
However this trend was not observed between the ULSD and the B20 fuels. In contrast, 160
the use of different fuels statistically affected NOx, NO and NO2 emission means when
161
the engine was equipped with the SCR system, where the highest emissions were 162
observed for the ULSD and B20 fuels. 163
According to Chin et al.1 and Agarwal and Das21, a NO
x emission increase due to
164
biodiesel blend fuels use, is a result of some fuel properties, such as viscosity, and also 165
is a result of the advance in injection timing, temperature rise and abundance of oxygen 166
available in the combustion chamber.1,21 Viscosity interfere in the fuel nebulization
generating different sizes of droplets in the combustion chamber. The burning 168
efficiency is higher with small droplets, due to a lower viscosity, leading a lower NOx
169
emission. 170
Despite the fact that the WHO22 has reported that sulphur content of fuels can
171
increase NOx emissions, as it reduces catalyst efficiency, our results showed similar
172
concentrations to all tested fuels (scenarios without SCR system), although higher 173
concentrations using ULSD in comparison to LSD with the use of SCR system were 174
observed. 175
176
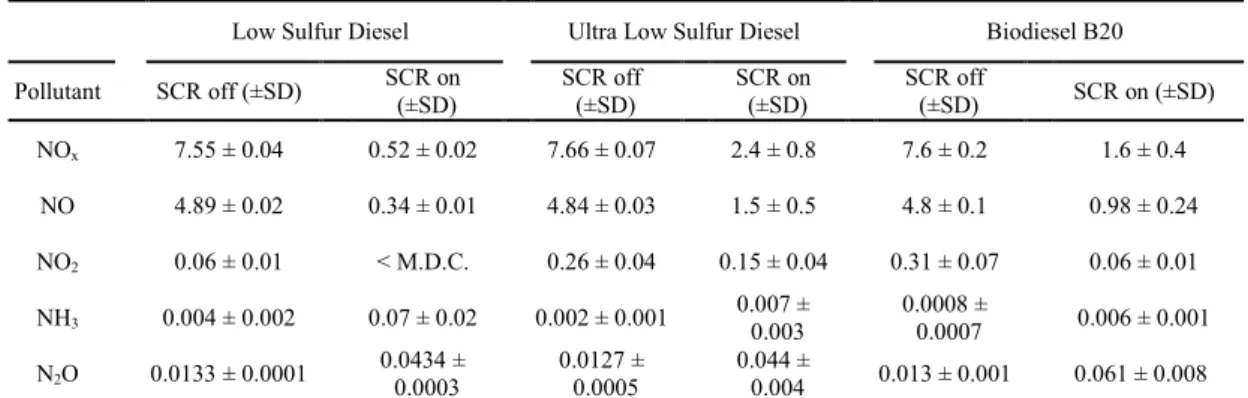
Table 4. Average and standard deviation of exhaust emissions for nitrogen compounds 177
(g/kWh) using SCR system on and off. 178
Low Sulfur Diesel Ultra Low Sulfur Diesel Biodiesel B20
Pollutant SCR off (±SD) SCR on (±SD) SCR off (±SD) SCR on (±SD) SCR off (±SD) SCR on (±SD)
NOx 7.55 ± 0.04 0.52 ± 0.02 7.66 ± 0.07 2.4 ± 0.8 7.6 ± 0.2 1.6 ± 0.4
NO 4.89 ± 0.02 0.34 ± 0.01 4.84 ± 0.03 1.5 ± 0.5 4.8 ± 0.1 0.98 ± 0.24
NO2 0.06 ± 0.01 < M.D.C. 0.26 ± 0.04 0.15 ± 0.04 0.31 ± 0.07 0.06 ± 0.01
NH3 0.004 ± 0.002 0.07 ± 0.02 0.002 ± 0.001 0.007 ± 0.003 0.0008 ± 0.0007 0.006 ± 0.001
N2O 0.0133 ± 0.0001 0.0434 ± 0.0003 0.0127 ± 0.0005 0.044 ± 0.004 0.013 ± 0.001 0.061 ± 0.008
NOx - Nitrogen Oxides, NO- Nitrogen Monoxide, NO2- Nitrogen Dioxide, NH3- Ammonia, N2O-
179
Nitrous Oxide.
180
* MDC (Minimal Detectable Concentration) is the detection limit of each gas component, determined as
181
two times the standard deviation σ of zero gas measurement over 60 seconds.
182
Inferior to MDC: NO2 – Nitrogen dioxide (MDC = 0,011 g/kWh).
183 184 185
While designed to reduce NOx emissions, the SCR system may increase other
186
pollutants’ emissions. As demonstrated in our study, the SCR system satisfies its 187
purpose of reducing NOx emissions. However, it brings forth new problems, such as
188
higher emissions of N2O, NH3 and some hydrocarbons.
189
Table4 shows an increase in ammonia emissions due to SCR system use. The only 190
increase considered statistically significant (p<0.05) was for LSD. 191
On the other hand, while the engine was equipped with the SCR system, there is a 192
statistically significant difference between NH3 emission means from LSD to B20 and
193
from LSD to ULSD. The NH3 emission means for ULSD and B20 could not be
194
considered significantly different at a 95% confidence level. 195
Koebel et al.6 reported that the SCR system uses continuous urea injections
196
(ammonia content) to neutralize NOx emissions, which may lead to an excess of urea,
called ammonia slip. It is therefore not unreasonable to assume that the ammonia slip 198
may be responsible for the higher NH3 emissions observed.
199
When the injected urea solution fails to be completely decomposed below 200°C, 200
it can produce ammonium nitrate (NH4NO3), cyanuric acid ((HNCO)3), and other
201
compounds as sub-products.8 As a consequence, ammonia and ammonium salts have a
202
relevant impact on the ecosystem, accounting for the modification of the atmosphere 203
global radioactive balance, the reduction of atmospheric visibility, the acidification and 204
eutrophication of the environment.23
205
As has been reported by European Environment Agency24, road transport contributes
206
only 2% of total ammonia (NH3) emissions, though it is a significant source from a
207
local perspective in urban areas. Many studies25-29 reported that an increase in NH 3
208
emission has occurred due to introduction of vehicles equipped with catalytic 209
converters and adoption of urea-SCR system. 210
The main source of anthropogenic N2O is agriculture,30 but some concern has
211
arisen due to new diesel exhaust after-treatment systems being responsible for N2O
212
production, for example, the chemical reactions in urea-SCR system.31
213
In our experiment, the use of the SCR system increased N2O concentrations for all
214
studied fuels. With 95% confidence level, these increases can be considered statistically 215
significant, with the highest increase observed for the B20 biodiesel blend (about 216
361%) and the lowest for the ULSD (about 83%). These results can be explained by 217
the undesirable processes that may occur in the SCR systems, including several 218
competitive, non selective reactions with oxygen that can produce secondary 219
emission.31
220
While the engine was equipped with the SCR system, a statistically significant 221
increase of N2O emission due to B20 biodiesel use was verified, in comparison with
222
ULSD and LSD fuels (p<0.05). 223
3.2 Hydrocarbons 224
225
The FTIR equipment is also able to detect the non-methane hydrocarbons (NMHC) 226
and hydrocarbons of diesel (HCD). The results are shown in Table 5. 227
228
Table 5. Average exhaust emissions for hydrocarbons compounds (g/kWh). 229
Pollutant SCR off (±SD) SCR on (±SD) SCR off (±SD) SCR on (±SD) SCR off (±SD) SCR on (±SD) NMHC 0.1888 ± 0.0002 0.1857 ± 0.0004 0.135 ± 0.003 0.159 ± 0.003 0.136 ± 0.007 0.164 ± 0.006 HCD 0.1917 ± 0.0004 0.1878 ± 0.0004 0.137 ± 0.003 0.161 ± 0.003 0.137 ± 0.007 0.166 ± 0.006 C3H6 0.0233 ± 0.0009 0.0236 ± 0.0002 0.012 ± 0.002 0.006 ± 0.001 0.0138 ± 0.0004 0.013 ± 0.003 C2H2 0.0142 ± 0.0003 0.0120 ± 0.0003 0.0125 ± 0.0008 0.0122 ± 0.0004 0.0104 ± 0.0006 0.0124 ± 0.0008 C2H6 0.0653 ± 0.0006 0.0673 ± 0.0007 0.064 ± 0.002 0.089 ± 0.003 0.068 ± 0.004 0.087 ± 0.002 C3H8 0.030 ± 0.001 0.0169 ± 0.0007 0.0276± 0.002 0.0281 ± 0.0008 0.0168 ± 0.0007 0.025 ± 0.005 CH4 0.0028± 0.0003 0.00213 ± 0.00003 0.0021 ± 0.0002 0.0023 ± 0.0001 0.00165 ± 0.00007 0.0022 ± 0.0004 HCHO 0.0285 ± 0.0007 0.0063 ± 0.0005 0.011 ± 0.002 0.0037 ± 0.0002 0.010 ± 0.004 0.006 ± 0.002 nC8 0.056 ± 0.001 0.0659 ± 0.0002 0.0204 ± 0.0005 0.024 ± 0.002 0.027 ± 0.002 0.027 ± 0.004
NMHC- Non-Methane Hydrocarbons, HCD- Hydrocarbons of Diesel, C3H6-Propylene, C2H2-
230
Acetylene, C2H6- Ethane, C3H8-Propane, CH4 - Methane, HCHO- Formaldehyde and nC8- N-Octane.
231 232
Inferior to MDC: C2H4- Ethene (MDC = 0,0173 g/kWh), C4H6- 1, 3 Butadiene (MDC = 0,0666 g/kWh)
233
and AHC- Aromatic hydrocarbon (MDC = 0,0134 g/kWh).
234 235
The NMHC emission means were statistically different between LSD and ULSD 236
for both situations, SCR-on and SCR-off, showing a reduction of 30% for SCR off and 237
15% for SCR on. The influence of the SCR system in NMHC emissions means was 238
statistically significant only for ULSD and B20. The means increased by nearly 20% 239
using ULSD and B20 (p<0.05). Diesel hydrocarbons emissions (HCD) showed a 240
similar trend to that observed for NMHC emissions described previously. 241
Fuels with a smaller cetane number has a higher ignition delay time, which “along 242
with the combustion of a partially premixed charge results in excessive emissions from 243
incomplete combustion, specifically total hydrocarbons (THC) and CO”.18
244
Regarding recent changes on fuel properties, such as lower sulphur content in 245
diesel and the use of biodiesel blends, considering measures of each hydrocarbon to 246
engine not equipped with SCR system, the use of ULSD showed statistically significant 247
difference on means in comparison to LSD to all hydrocarbons, with exception of 248
ethane and acetylene (analysis of variance invalid). However, the only hydrocarbons 249
showing significant differences on means (p<0.05) from ULSD to B20 were propane 250
and n-octane, with decrease of propane and increase of n-octane. 251
Statistical treatment of data indicates that formaldehyde emissions were 252
significantly (p<0.05) lower (78%) with LSD and (59%) with ULSD due to SCR system 253
use. It also indicates that n-octane emissions were significantly (p<0.05) higher (18%) 254
with LSD due to SCR system use. 255
Besides the toxicity of some organic compounds like BTEX and HPA’s, well 256
known as potential carcinogenic compounds, Atkinson32 pointed out that a variety of
257
hydrocarbons may lead to ozone production in low latitudes, through their reaction to 258
OH radicals in the presence of NOx and SO2.
259
The ground-level ozone is a well-known atmospheric pollutant, which can cause 260
several deleterious impacts on the environment and human health. In high 261
concentrations, the tropospheric O3 can interfere with photosynthesis and the growing
262
of some plant species.33,22 The latest European directive 2002/3/CE recommends that
263
at least 30 NMHCs (saturated, unsaturated or aromatic) should be measured.34 As far
264
as ozone formation due to high NMHCs and SOx emissions are concerned, the critical
265
situation in our study was that of LSD, which presented elevated NMHC and SO2
266
emissions. 267
In this context, it is widely known that organic compounds participated in the 268
formation of secondary pollutants that may contribute to some of the undesirable 269
environmental effects associated with photochemical smog episodes. 270
Essentially, each compound has a different contribution due to the amount emitted 271
and some properties that affect the secondary pollutants production during 272
photochemical reactions. Some of these compounds are said to be more reactive than 273
others. Consequently, the most reactive organic compounds should be addressed 274
towards a strategy to reduce ozone and PAN (Peroxyacetylnitrate) exposure levels.35
275
A ranking of most reactive organic compounds, based on ozone formation under 276
specific atmospheric conditions has been developed, the so-called reactivity scale. 277
Derwent et al.35created a reactivity scale for Northwestern Europe. They estimated the
278
Photochemical Ozone Creation Potentials (POCPs) and Photochemical PAN Creation 279
Potentials (PPCPs) for 120 organic compounds and their sensitivity to NOx emissions
280
taking ethylene (POCP = 100) and propylene (PPCP = 100), respectively, as the 281
reference compound. Table 6 presents the values calculated by Derwent et al. (1998).35
282
Table 6. Photochemical Ozone Creation Potential POCP and Photochemical PAN 283
Creation Potential 284
Organic Compounds POCP PPCP
Propylene 112.3 100
Formaldehyde 51.9 14.8
Propane 17.6 13.7
Ethane 12.3 17.3
Acetylene 8.5 2.2
Methane 0.6 0.9
Source: Derwent et al.35 285
286
Relating the results of Table 6 with our study, n-octane POCP is only 13% lower 287
than formaldehyde’s one, while its PPCP is 65% higher than the formaldehyde one. 288
With regards to ozone and PAN formation, LSD fuel presented the higher 289
concentrations for the compounds with the higher POCP and PPCP values: propylene, 290
formaldehyde and n-octane. 291
Considering only the LSD fuel, it was statistically verified (p<0.05) an increase in 292
n-octane emission and a decrease in formaldehyde when the SCR system was used. 293
These results indicate a beneficial effect in ozone photochemical creation, as the 294
formaldehyde POCP is higher than n-octane one. In addition, as reported by WHO22,
295
formaldehyde was classified as a carcinogenic compound. 296
The SCR system combined with ULSD or B20 has increased alkanes emissions, 297
however their POCP and PPCP are lower than those of formaldehyde, propylene and 298
n-octane. Therefore, the ULSD and B20 fuels are, apparently, a better alternative than 299
LSD, considering the hydrocarbons emissions and their photochemical potentials. 300
Recently Derwent et al.36 developed a similar study applying the same models to
301
create an activity scale for different emission sources of organic compounds. They 302
indicated road transport-exhaust as the major contributor to POCP levels. Furthermore, 303
Derwent et al.37 made the same conclusion for secondary organic aerosol formation
304
from organic compounds. 305
The POCP and PPCP analysis applied in our study is interesting since the 306
combination of megacities, atmospheric conditions and significant emissions of ozone 307
and PAN precursors can favour photochemical reactions in smog systems, creating 308
serious pollution episodes. 309
Regarding the use of the SCR system scenarios, the results are of similar magnitude 310
for all tested fuels. However, when the engine was not equipped with the SCR system, 311
the LSD showed higher emissions, with differences over 60% in comparison to ULSD, 312
with little difference between ULSD and B20. 313
Open literature describes decreases in aldehyde emissions from some biodiesel 314
fuels, in comparison to diesel.38-40 However, specifically with regard to formaldehyde,
315
some researchers observed an increase or no alteration in its emission.41-43,9 Tan et al.44
316
showed an increase of formaldehyde emissions mainly for pure biodiesel fuel in 317
comparison to diesel, and showed little difference between diesel and B20 blend. 318
Taken together, this study showed that the emissions of NO and NO2 while the
319
engine was equipped with the SCR system using the ESC cycle were lower and 320
statistically significant (p<0.05). However, the use of the SCR system produced 321
significantly increased concentrations of: N2O for all studied fuels; NH3 just for LSD;
322
and non-methane hydrocarbons (NMHC) and hydrocarbons of diesel (HCD) for ULSD 323
and B20. On the other hand, the use of SCR system significantly (p<0.05) supressed 324
formaldehyde emissions for LSD and ULSD fuels, having a beneficial impact since it 325
has a huge POCP and PPCP and is considered as a carcinogenic compound. 326
Soybean biodiesel blend used, in combination with the SCR system, can 327
successfully reduce harmful pollutant emissions such as NOx, however, increases the
328 HCD production. 329 330 331
4.
Acknowledgement 332 333This work was supported financially by the National Council for Scientific and 334 Technological Development (CNPq). 335 336
5.
References 337 338(1) Chin, J.; Batterman, S. A.; Northrop, W. F.; Bohac, S. V.; Assanis, D. N. Gaseous
339
and Particulate Emissions from Diesel Engines at Idle and under Load: Comparison of
340
Biodiesel Blend and Ultralow Sulfur Diesel Fuels. Energy & Fuels. 2012, 26, 6737–6748;
341
DOI 10.1021/ef300421h.
342
(2) U.S. EPA. United States Environmental Protection Agency Technical Bulletin:
343
Nitrogen oxides (NOx) why and how they are controlled. Clean Air Technology Center
344
(MD-12), 57pp, 1999.
345
(3) Alkemade, U.; Schumann, B. Engines and exhaust after treatment systems for future
346
automotive applications. Solid State Ionics. 2006, 177, 2291–2296; DOI
347
10.1016/j.ssi.2006.05.051
348
(4) Furfori, S.; Russo, N.; Fino, D.; Saracco, G.; Specchia, V. NO SCR reduction by
349
hydrogen generated in line on perovskite-type catalysts for automotive diesel exhaust gas
treatment. Chemical Engineering Science. 2010, 65, 120–127; DOI
351
10.1016/j.ces.2009.01.065.
352
(5) Miquel, P.; Granger, P.; Jagtap, N.; Umbarkar, S.; Dongare, M.; Dujardin, C. NO
353
reduction under diesel exhaust conditions over Au/Al2O3 prepared by
deposition-354
precipitation method. Journal of Molecular Catalysis A: Chemical. 2010, 322, 90-97; DOI
355
10.1016/j.molcata.2010.02.024.
356
(6) Koebel, M.; Elsener, M.; Kleemann, M. Urea-SCR: a promising technique to reduce
357
NOx emissions from automotive diesel engines. Catalysis Today. 2000, 59, 335–345; DOI
358
10.1016/S0920-5861(00)00299-6.
359
(7) Hu, Y.; Griffiths, K.; Norton, P.R. Surface science studies of selective catalytic
360
reduction of NO: Progress in the last ten years. Surface Science. 2009, 603, 1740–1750;
361
DOI 10.1016/j.susc.2008.09.051.
362
(8) Jiang, L.; Ge, Y.; Shah, A. N.; He, C.; Liu, Z. Unregulated emissions from a diesel
363
engine equipped with vanadium-based urea-SCR catalyst. Journal of Environmental
364
Sciences.2010, 22, 575–581; DOI 10.1016/S1001-0742(09)60148-0.
365
(9) Turrio-Baldassarri, L.; Battistelli, C. L.; Conti, L.; Crebelli, R.; De Berardis, B.;
366
Iamiceli, A. L.; Gambino, M.; Iannaccone, S. Emission comparison of urban bus engine
367
fueled with diesel oil and “biodiesel” blend. The Science of the Total Environment.2004,
368
327, 147–62; DOI 10.1016/j.scitotenv.2003.10.033.
369
(10) Lobo, F. A.; Goveia, D.; Oliveira, A. P.; Romão, L. P. C.; Fraceto, L. F.; Dias Filho,
370
N. L.; Rosa, A. H. Development of a method to determine Ni and Cd in biodiesel by graphite
371
furnace atomic absorption spectrometry. Fuel. 2011, 90, 142-146; DOI
372
10.1016/j.fuel.2010.09.009.
373
(11) Karavalakis, G.; Bakeas, E.; Stournas, S. Influence of oxidized biodiesel blends on
374
regulated and unregulated emissions from a diesel passenger car. Environmental Science
375
and Technology.2010, 44, 5306-5312; DOI 10.1021/es100831j.
376
(12) Bakeas, E.; Karavalakis, G.; Stournas, S. Biodiesel emissions profile in modern diesel
377
vehicles. Part 1: Effect of biodiesel origin on the criteria emissions. The Science of the Total
378
Environment.2011, 409, 1670–1676; DOI 10.1016/j.scitotenv.2011.01.024.
379
(13) Bermúdez, V.; Lujan, J. M.; Pla, B.; Linares, W. G. Comparative study of regulated
380
and unregulated gaseous emissions during NEDC in a light-duty diesel engine fuelled with
381
Fischer Tropsch and biodiesel fuels. Biomass and Bioenergy. 2011, 35, 789–798; DOI
382
10.1016/j.biombioe.2010.10.034.
383
(14) Demirbas, A. Biodiesel from oilgae, biofixation of carbon dioxide by microalgae: A
384
solution to pollution problems. Applied Energy. 2011, 88, 3541–3547; DOI
385
10.1016/j.apenergy.2010.12.050.
386
(15) U.S. EPA. United States Environmental Protection Agency, 2013. Website
387
http://www.epa.gov/otaq/standards/heavy-duty/hdci-exhaust.htm.
388
(16) Koebel, M.; Madia, G.; Elsener, M. Selective catalytic reduction of NO and NO2 at
389
low temperatures. Catalysis Today. 2002, 73, 239–247; DOI
10.1016/S0920-390
5861(02)00006-8.
391
(17) EC (European Commission). European Commission Report from the Commission to
392
the European Parliament and the Council: Quality of petrol and diesel fuel used for road
393
transport in the European Union: Sixth annual report (Reporting year 2007), 15pp.
394
(18) Lilik, G. K.; Boehman, L. Advanced Diesel Combustion of a High Cetane Number
395
Fuel with Low Hydrocarbon and Carbon Monoxide Emissions. Energy & Fuels.2011, 25,
396
1444–1456; DOI 10.1021/ef101653h.
397
(19) R Core Team. 2014. R: A language and environment for statistical computing. R
398
Foundation for Statistical Computing, Vienna, Austria. Website http://www.R-project.org/.
399
(20) Montgomery, D. C. Design and Analysis of Experiments. 5th Edition. John Willey &
400
Sons, INC. 699 pp, 2011.
401
(21) Agarwal, A. K.; Das, L. M. Biodiesel development and characterization for use as a
402
fuel in compression ignition engines. Journal of Engineering for Gas Turbines and Power.
403
2001, 123, 440-447; DOI 10.1115/1.1364522.
(22) WHO. World Health Organization. Health effects of transport-related air pollution.
405
Copenhagen: WHO Regional Office for Europe, 205p, 2005.
406
(23) Reche, C.; Viana, M.; Pandolfi, M.; Alastuey, A.; Moreno, T.; Amato, F.; Ripoll,
407
A.; Querol, X. Urban NH3 levels and sources in a Mediterranean environment. Atmospheric
408
Environment. 2012, 57, 153–164; DOI 10.1016/j.atmosenv.2012.04.021.
409
(24) EEA (European Environment Agency). European Union Emission Inventory Report
410
1990 e 2009 under the UNECE convention on long-range transboundary air pollution. EEA
411
Technical Report 9, 2011. Website
http://www.eea.europa.eu/publications/eu-emission-412
inventory-report-lrtap.
413
(25) Sutton, M. A.; Dragosits, U.; Tang, Y. S.; Fowler, D. Ammonia emissions from
non-414
agricultural sources in the UK. Atmospheric Environment. 2000, 34, 855–869; DOI
415
10.1016/S1352-2310(99)00362-3.
416
(26) Perrino, C.; Catrambone, M.; Menno, A. Di; Bucchianico, D.; Allegrini, I. Gaseous
417
ammonia in the urban area of Rome, Italy and its relationship with traffic emissions.
418
Atmospheric Environment. 2002, 36, 5385–5394; DOI 10.1016/S1352-2310(02)00469-7.
419
(27) Cape, J. N.; Tang, Y. S.; van Dijk, N.; Love, L.; Sutton, M.; Palmer, S. C. F.
420
Concentrations of ammonia and nitrogen dioxide at roadside verges, and their contribution
421
to nitrogen deposition. Environmental Pollution. 2004, 132, 469–478; DOI
422
10.1016/j.envpol.2004.05.009.
423
(28) Burgard, D. A.; Bishop, G.; Stedman, D. H. Remote sensing of ammonia and sulfur
424
dioxide from on-road light duty vehicles. Environmental Science & Technology. 2006, 40,
425
7018–22; DOI 10.1021/es061161r.
426
(29) Kean, A. J.; Littlejohn, D.; Ban-Weiss, G. A.; Harley, R. A.; Kirchstetter, T. W.;
427
Lunden, M. M. Trends in on-road vehicle emissions of ammonia. Atmospheric Environment.
428
2009, 43, 1565–1570; DOI 10.1016/j.atmosenv.2008.09.085.
429
(30) Wang, Z.; Zheng, H.; Luo, Y.; Deng, X.; Herbert, S.; Xing, B. Characterization and
430
influence of biochars on nitrous oxide emission from agricultural soil. Environmental
431
Pollution. 2013, 174, 289-296; DOI 10.1016/j.envpol.2012.12.003.
432
(31) Majewski, W. A. 2005. Selective catalytic reduction. Website
433
<http://www.dieselnet.com/tech/cat_scr.php>.
434
(32) Atkinson, R. Atmospheric chemistry of VOCs and NOx. Atmospheric Environment.
435
2000, 34, 2063-2101; DOI 10.1016/S1352-2310(99)00460-4.
436
(33) Susaya, J.; Kim, K.; Shon, Z. Demonstration of long-term increases in tropospheric
437
O3 levels: Causes and potential impacts. Atmospheric Environment.2013, 92 (11), 1520–
438
1528; DOI 10.1016/j.chemosphere.2013.04.01.
439
(34) Arsene, C.; Bougiatioti, A.; Mihalopoulos, N. Sources and variability of non-methane
440
hydrocarbons in the eastern Mediterranean. Global Nest Journal.2009, 11 (3), 333-340;
441
DOI 10.1007/978-1-4020-6429-6_14.
442
(35) Derwent, R. G.; Jenkin, M. E.; Saunders, S. M.; Pilling, M. J. Photochemical ozone
443
creation potentials for organic compounds in northwest Europe calculated with a master
444
chemical mechanism. Atmospheric Environment. 1998, 32, 2429–2441; DOI
445
10.1016/S1352-2310(98)00053-3.
446
(36) Derwent, R. G.; Jenkin, M. E.; Passant, N. R.; Pilling, M. J. Photochemical ozone
447
creation potentials (POCPs) for different emission sources of organic compounds under
448
European conditions estimated with a Master Chemical Mechanism. Atmospheric
449
Environment.2007, 41, 2570–2579; DOI 10.1016/j.atmosenv.2006.11.019.
450
(37) Derwent, R. G.; Jenkin, M. E.; Utembe, S. R.; Shallcross, D. E.; Murrells, T. P.; 451
Passant, N. R. Secondary organic aerosol formation from a large number of reactive man-452
made organic compounds. Science of the Total Environment. 2010, 408, 3374–3381; DOI 453
10.1016/j.scitotenv.2010.04.013. 454
(38) Sharp, C. A.; Howell, S. A.; Jobe, J. Effect of Biodiesel Fuels on Transient Emissions
455
from Modern Diesel Engines, Part II, Unregulated Emissions and Chemical
456
Characterization. SAE Technical.2000, 01-1968, DOI: 10.4271/2000-01-1968.
(39) Peng, C.; Yang, H.; Lan, C.; Chien, S. Effects of the biodiesel blend fuel on aldehyde
458
emissions from diesel engine exhaust. Atmospheric Environment.2008, 42, 906–915; DOI
459
10.1016/j.atmosenv.2007.10.016.
460
(40) Ratcliff, M. A.; Dane, A. J.; Williams, A; Ireland, J.; Luecke, J.; McCormick, R. L.;
461
Voorhees, K. J. Diesel Particle Filter and Fuel Effects on Heavy-Duty Diesel Engine
462
Emissions. Environmental Science & Technology. 2010, 44, 8343–8349; DOI
463
10.1021/es1008032.
464
(41) Corkwell, K. C.; Jackson, M. M.; Daly, D. T. Review of Exhaust Emissions of
465
Compression Ignition Engines Operating on E Diesel Fuel Blends. SAE Technical. 2003,
466
01-3283; DOI 10.4271/2003-01-3283.
467
(42) He, B. Q.; Wang, J. X.; Yan, X. G.; Tian, X.; Chen, H. Study on Combustion and
468
Emission Characteristics of Diesel Engines Using Ethanol Blended Diesel Fuels. SAE
469
Technical.2003, 01-0762; DOI 10.4271/2003-01-0762.
470
(43) Correa, S. M.; Arbilla, G. Carbonyl emissions in diesel and biodiesel exhaust.
471
Atmospheric Environment.2008, 42 (4), 769-775; DOI 10.1016/j.atmosenv.2007.09.073.
472
(44) Tan, P. Q.; Hu, Z. Y.; Lou, D. M. FTIR detection of unregulated emissions from a
473
diesel engine with biodiesel fuel. Spectroscopy and Spectral Analysis. 2012, 32 (2), 360–
474 363; DOI 10.3964/j.issn.1000-0593(2012)02-0360-04 475 476 477 478 479 480 481 482 483 484 485 486 487 488 489 490 491