No. 06/07
_____________________________________________________________________
Aid Loans Versus Aid Grants:
Are The Effects Different?
by
Oliver Morrissey, Olaf Islei and Daniel M’Amanja
_____________________________________________________________________
Centre for Research in Economic Development and International Trade, University of Nottingham
by
Oliver Morrissey, Olaf Islei and Daniel M’Amanja
Abstract
There is some debate regarding whether aid to poor recipients should be given in the
form of loans or grants. This paper concentrates on whether the form of aid influences
the effects on recipient fiscal behaviour. The main part of this paper investigates the
recipient tax revenue response to inflows of aid and whether the composition of aid,
i.e. loans or grants, induces a significantly different response. The relationship
between aid and tax revenue is investigated for a sample of up to 55 low and
middle-income countries over the period 1975-2000. The results indicate that there is no
consistent and robust relationship between aid, the composition of aid, and the tax to
GDP ratio in developing countries. This cross-country analysis is complemented by a
time series study for 1964-2002 of the effect of fiscal variables (government
expenditure and revenue) and aid on growth in Kenya. Two measures of aid are used;
external grants and loans, and both yield different results. Aid loans are found to have
a negative impact on long run growth, while grants have a positive, albeit weak,
impact on growth. The paper concludes that, at least for poor recipients, grants are to
be preferred to loans because they create no future repayment burden and appear not to
have adverse fiscal effects.
JEL codes: F35, O23
Keywords: Aid, Grants, Loans, Fiscal Effects of Aid
Outline
1.
Introduction
2.
Cross-Country Analysis of Aid and Tax Revenue
3.
A Digression on Time Series Evidence
4.
Conclusions
References
Appendix
The Authors
The authors are respectively Director of CREDIT and Professor in Development
Economics, School of Economics, University of Nottingham; ODI Fellow with the
Ministry of Finance in Zanzibar, and Deputy Director of Research in the Economics
Department, Central Bank of Kenya.
Corresponding author:
oliver.morrissey@nottingham.ac.uk
.
Acknowledgements
This paper was prepared for the WIDER Conference on Aid: Principles, Policies and
Performance, Helsinki, 16-17 June 2006. At the time of writing, Dr M’Amanja was a
research student at Nottingham and Mr Islei was a Masters student
1 Introduction
There is some debate in the literature regarding whether aid to developing countries should be given in the form of grants (‘free’ money with no obligation to repay) or loans (an obligation to repay, albeit on concessional terms). In financial terms the difference relates to the degree of concessionality of the transfer relative to market terms – for aid the important feature is that the grant element or concessionality is at least 25% although it tends to be far higher, especially for the poorest countries (Morrissey and White, 1996). Cordella and Ulku (2005) argue that higher concessionality is more likely to be growth promoting in poor countries with heavy debt obligations because it does less to add to the debt burden and so does not increase the likelihood of default. As grants are fully concessional they should be favoured for indebted poor countries. Others argue that because loans imply future obligations they encourage better fiscal management, in particular greater tax effort, as compared to grants (Bräutigam, 2000; US Treasury Department, 2000). The purpose of this paper is to investigate the evidence on grants and loans having different fiscal impacts. The ‘grants versus loans’ debate re-emerged with calls to increase the grant component of aid in the Report of the International Financial Institution Advisory Commission (IFIAC, 2000). Amongst other things the report recommends that the World Bank should replace its loan programme with a grant programme aimed at poverty alleviation, focusing on the provision of healthcare, education and physical infrastructure. The report argues that ‘loans are not a realistic vehicle for poverty alleviation [as] poverty is most entrenched in those countries with corrupt and inefficient governments where loans are likely to be squandered’ (IFIAC, 2000: 85). The United States administration also called on the World Bank to provide up to 50% of their IDA funding for social sector investment in the form of grants rather than loans, on the basis of three arguments (Sandford, 2002). First, increased grants would not add to heavy debt burdens in poor countries. Second, loans are inappropriate for financing social sector programs, such as education, as the benefits are realised over a long time period and do not generate financial returns to service a loan (Salazar, 2002). Third, as grants do not burden recipients with the need for repayment they allow greater political scope for donors to require recipient commitment to ‘development goals’, i.e. to impose conditions (Sandford, 2002).
Britain was among those who opposed the US IDA grants proposal (DFID, 2001), arguing that the current system made effective use of the limited resources available. As 38% of IDA’s resources come from reflows on previous loans (US Treasury Department, 2000), the US proposals would result in a funding shortfall of $30 million per year for the first ten years, rising thereafter (World Bank, 2003). Unless donors were willing to increase their allocations to IDA, which seemed unlikely, the proposals would result in either a reduction of IDA lending or transfers from those middle-income countries who borrow from IBRD. Britain also disputed the claim that IDA’s current terms are inappropriate for investment in health or education: the loans are highly concessional, with a ten-year grace period, repayments over the following 20-30 years, no interest and only a small service charge of 0.75 percent. Moreover investments in social sector interventions, such as education, can produce very high rates of return.
However, the most common argument, dating back to Schmidt (1964), is that loans are used more ‘effectively’ than grants. This argument relates to the fiscal behaviour of the recipient governments – because they have to be repaid, loans encourage better fiscal management and greater tax effort than do grants (which may substitute for domestic revenue efforts). Two approaches investigate the effect of aid, which may include the form of aid, on tax revenue – cross-country
studies of the determinants of tax effort including aid variables, and country-specific time series studies of the fiscal effects of aid. Gupta et al (2004), in a cross-country analysis, find that loans are positively correlated with tax revenue whereas grants are negatively correlated with tax revenue, and infer that grants induce lower tax effort. A core part of this paper reinvestigates this relationship, arguing that the correlation is only observed over the short-run so one should be very cautious in drawing causal inferences from cross-country evidence. The fiscal response literature explicitly seeks to model the impact of aid on government revenue and expenditure (McGillivray and Morrissey, 2004) and is amenable to capturing the long-run and dynamic nature of the relationships (Osei et al, 2005). As most fiscal response studies are country specific and as few distinguish between loans and grants, it is difficult to make any generalisations from the existing literature. This paper is a contribution to the evidence, corroborating the basic results of Gupta et al (2004) but questioning their interpretation.
The paper is organised as follows. Section 2 addresses cross-country evidence of aid (composition) and tax effort (the tax/GDP ratio), presenting estimates to show that the robust relationship appears in the short-run and may reflect a correlation rather than implying causation. Section 3 provides some time series evidence on the fiscal effects of aid loans and grants in Kenya, suggesting that the effects are rather different. Section 4 concludes by assessing the evidence and argues that grants are preferable to loans on a variety of grounds, especially given the absence of robust evidence that grants have adverse fiscal effects.
2 Cross-Country Analysis of Aid and Tax Revenue
1Gupta et al (2004), with data from 107 low and middle-income countries pooled over the period 1970-2000, and Odedokun (2003), with data for 72 low-income countries pooled over the period 1970-99, use cross-country regression analysis to investigate the response of recipient government revenue effort to aid. Specifically, they test whether the tax/GDP ratio differs in response to aid grants and loans. Both find evidence to support the hypothesis that grant aid reduces recipient government tax effort, and that concessional loans increase recipient tax effort. As they carry out a more sophisticated econometric analysis, Gupta et al (2004) is the focus of our discussion.
The empirical approach of Gupta et al (2004) follows Lotz and Morss (1967) to model the tax to GDP ratio as determined by variables chosen to proxy for the tax base structure of the economy. Coefficients from a cross-country regression are interpreted as the ‘average’ effective tax rate for each tax base, which can be used to construct an index of ‘taxable capacity’ for each country which, when compared to actual tax ratios, provides an indicator of tax effort (Stotsky and WoldeMariam, 1997). Gupta el al (2004) augment a ‘typical’ regression equation for tax effort, adding both grants (G) and net concessional loans (L) as a percentage of GDP. Their baseline regression equation takes the form:
[
]
t i t i t i t iL
G
INCOME
TRADE
IND
AGR
GDP
Tax
, 6 5 4 3 , 2 , 1 0 ,ln
ε
β
β
β
β
β
β
β
+
+
+
+
+
+
+
=
(1)They control for four determinants of taxable capacity. Agricultural (AGR) and industrial (IND) value added as a percentage of GDP are included as the sector composition of value added is viewed as a key determinant of the tax base. A large agricultural sector reduces taxable capacity (β1 < 0) as agriculture is largely a subsistence activity in most low-income countries, which is difficult to tax directly. A large industrial sector is easier to monitor and tax (β2 > 0). Openness (TRADE, the sum of exports and imports as a percentage of GDP), is included as trade taxes are relatively easy to collect (β3 > 0) and are a major share of tax revenue in low-income countries (Greenaway and Milner, 1991; Ghura, 1998). GDP per capita (INCOME) is included as a proxy for the level of economic development (β4 > 0), to capture increased tax buoyancy and collection efficiency. However, empirical evidence on the relationship between the tax to GDP ratio and per capita GDP, controlling for economic structure, is inconclusive (Tanzi, 1992). As the dependent variable is nonnegative and skewed, the log transformation is used to provide a normal distribution. Nonlinearities in the relationship between aid and the tax ratio are allowed for by the inclusion of squared aid variables.
Equation (1) is estimated using alternative techniques and specifications (including other explanatory variables), and the results are found to be quite robust. The coefficient on Agriculture is negative and significant while the coefficients on Industry and Trade are positive and significant. The coefficient on GDP per capita, however, is consistently negative and significant. The coefficient on Loans is positive and that on Grants is negative, including when lagged values are used, and are almost always significant. These results are interpreted as implying that ‘a doubling of grants from an average of 4 per cent of GDP to 8 per cent of GDP could decrease revenues by just 0.4 percentage point of GDP’ (Gupta et al 2004: 402). There is evidence that grants have an adverse impact on tax effort, but it is acknowledged that the effect is modest. Our aim in this section is to simply test if the results are robust to two minor changes – using a balanced rather than unbalanced panel (i.e. omitting countries with missing observations) and treating imports and exports separately (as the revenue implications should differ). Specifically, the following specification is used:
[
]
t i t i t i t i t i t i t i t i t i t i t iL
L
G
G
INCOME
EXP
IMP
IND
AGR
GDP
Tax
, 2 , 9 , 7 2 , 7 , 6 , 5 , 4 , 3 , 2 , 1 0 ,ln
ε
β
β
β
β
β
β
β
β
β
β
+
+
+
+
+
+
+
+
+
+
=
(2)The only difference with (1) is that the measure of trade distinguishes between exports (EXP) and imports (IMP). Details on the data sources and definitions are provided in the Appendix. Although the dataset covered 107 countries over the period 1975-2000, there are many missing observations (especially on tax/GDP, missing in over 40 percent of the 2675 country-year observations) so the number of countries in the balanced panel is much smaller.
We begin by estimating the determinants of the tax/GDP ratio using a balanced panel of annual data for 46 countries over the period 1980-1990. The results for a variety of specifications of equation (2) estimated using fixed and random-effects estimators are presented in Tables 1 and 2 respectively. The fixed-effects specification has the advantage of eliminating any unobserved country specific characteristics that do not change over time. If the unobserved effects are correlated with the other explanatory variables, failing to take them into account will bias the results. However, it may be the case that any unobserved effects are uncorrelated with all explanatory variables in any time period, in which case the
random-effects specification will produce more efficient estimators. If there is a correlation, the random-effects estimators will be inconsistent.
Table 1: Determinants of Tax Ratio: Panel of 46 Countries, Annual Data
1980-1990 using Fixed Effects
Variables 1.1 1.2 1.3 1.4 Aid 0.007 (0.007) Aid² -0.019 (0.022) Loan 0.043** (0.019) 0.046**(0.019) Loan² -0.192 (0.201) (0.202)-0.120 Grant -0.012 (0.009) -0.024***(0.009) Grant² 0.026 (0.032) (0.031)0.052* INCOME 0.000009 (0.000009) 0.00001 (0.000009) 0.000007 (0.00001) 0.00001 (0.000009) Agriculture -0.014*** (0.003) -0.014***(0.003) -0.014***(0.003) -0.013***(0.003) Industry 0.006** (0.003) 0.005** (0.003) 0.007*** (0.003) 0.005** (0.003) Imports 0.003*** (0.001) 0.003**(0.001) 0.004***(0.002) 0.004**(0.001) Exports 0.002 (0.002) (0.001)0.002 (0.002)0.001 (0.001)0.001 R² 0.0358 0.0354 0.0306 0.0269 Wald chi² 10.62 12.87 10.85 11.32 P-value 0 0 0 0 N 46 46 46 46 Obs 506 506 506 506
Notes: Standard errors in parentheses; significance levels are * (10% level), ** (5% level) and *** (1% level). The Wald statistic is the F-Value for joint significance (given by the P-value). N is the number of countries and Obs the number of observations.
Despite using a different sample the results are broadly consistent with those of Gupta et al (2004), although the coefficient on INCOME is mostly insignificant (when it is significant it is negative). The results for the fixed and random-effects
specifications are almost identical. The coefficient on Agriculture is negative and significant while the coefficient on Industry is positive and significant. Of the trade variables the coefficient on imports is positive and significant, but that on Exports is insignificant, or weakly significant (perhaps reflecting the tendency of countries to eliminate export taxes as part of conditionality during this period). For the aid variables we find that total net aid is a negative determinant of the tax to GDP ratio (but only significant under RE). When both net loans and grants are included in the regression, loans are positively related, and grants negatively related to the tax to GDP ratio (but usually insignificant). Results for grants are not robust.
Table 2: Determinants of Tax Ratio: Panel of 46 Countries, Annual Data
1980-1990 using Random Effects
Variables 2.1 2.2 2.3 2.4 Aid 0.016** (0.006) Aid² -0.036** (0.014) Loan 0.046*** (0.012) 0.053***(0.011) Loan² -0.201*** (0.058) -0.226***(0.059) Grant -0.002 (0.008) (0.008)-0.010 Grant² -0.005 (0.024) (0.008)0.005 INCOME -0.00001 (0.000009) (0.000009)-0.00001 (0.000009)-0.00002* (0.000009)-0.00002* Agriculture -0.011*** (0.003) -0.012*** (0.003) -0.010*** (0.003) -0.011*** (0.003) Industry 0.005* (0.003) (0.002)0.004* (0.003)0.006* (0.002)0.005* Imports 0.003** (0.001) 0.003** (0.001) 0.004*** (0.001) 0.004*** (0.001) Exports 0.002 (0.001) (0.001)0.002 (0.002)0.001 (0.002)0.001 R² 0.121 0.134 0.103 0.136 Wald chi² 71.13 84.94 64.44 89.78 P-value 0 0 0 0 N 46 46 46 46 Obs 506 506 506 506
Table 3: Determinants of Tax Ratio: Panel of 46 Countries, Annual Data 1980-1990 using Random Effects and lagged Aid
Variables 3.1 3. 2 3.3 3.4 Aid 0.016** (0.006) Aid² -0.036** (0.014) Loan 0.046*** (0.011) 0.053*** (0.011) Loan² -0.201*** (0.058) -0.226***(0.060) Grant -0.002 (0.008) -0.010 (0.008) Grant² -0.005 (0.024) (0.008)0.005 INCOME -0.00001 (0.000009) (0.000009)-0.00001 (0.000009)-0.00002* (0.000009)-0.00002* Agriculture -0.011*** (0.003) -0.012***(0.003) -0.010***(0.003) -0.012***(0.003) Industry 0.005* (0.003) (0.002)0.004* (0.003)0.006* 0.005**(0.002) Imports 0.003** (0.001) 0.003**(0.001) 0.004***(0.001) 0.004***(0.001) Exports 0.002* (0.001) (0.001)0.002* (0.002)0.001 (0.002)0.001 R² 0.121 0.134 0.103 0.136 Wald chi² 71.13 84.94 64.44 89.78 P-value 0 0 0 0 N 46 46 46 46 Obs 506 506 506 506
Notes: As for Table 1.
Gupta et al (2004) control for the possibility of endogeneity bias, that donors give more aid in the form of grants to fiscally constrained countries, by using aid variables lagged for one period, as the current tax/GDP ratio will not influence the magnitude or composition of previous period aid flows. Our results using lagged aid variables are given in Table 3. The Hausman test-statistic suggests the random-effects specification will be more efficient, therefore only these results
are reported. The results suggest that lagged total net aid is positive and significantly related to the current period tax to GDP ratio. Taken at face value these results can be interpreted as suggesting that while the contemporaneous impact of aid is at best weakly significant, over time the impact of aid on the tax base is positive. With regard to loans and grants, the former remains positively related to the tax/GDP ratio but the latter is no longer significant.
Table 4: Determinants of Tax Ratio: Panel of 55 Countries over 1975-95
Variables FE1 RE1 FE2 RE2
Aid -0.005 (0.011) (0.011)0.003 Aid² 0.022 (0.027) 0.005 (0.028) Loan 0.072*** (0.026) 0.066**(0.028) Loan² -0.394* (0.176) -0.346* (0.192) Grant -0.039** (0.015) (0.016)-0.025 Grant² 0.119** (0.046) (0.048)0.077 GDP per Capita 0.000005 (0.00002) -0.00006***(0.00001) (0.00002)0.000006 -0.00005***(0.00001) Agriculture -0.006 (0.005) -0.011***(0.004) (0.005)-0.005 -0.010**(0.004) Industry 0.015*** (0.005) (0.004)0.003 0.017***(0.005) (0.004)0.004 Imports -0.005 (0.003) (0.003)-0.001 (0.003)-0.005 (0.003)-0.004 Exports 0.006* (0.003) (0.003)0.006* (0.003)0.005* (0.003)0.005* R² 0.0092 0.2831 0.0115 0.2429 Wald chi² 6.53 35.86 6.61 41.87 P-value 0 0 0 0 N 55 55 55 55 Obs 220 220 220 220
Notes: As for Table 1. Data are averaged over four 5 year periods (1976-80/81-85/86-90/91-95). Fixed effects (FE) and Random effects (RE) estimation reported.
To smooth annual variability and expand our sample a (balanced) panel with four observations for each country was created by taking five year averages of the data over the period 1976-1995. Using five-year averages removes the year-on-year noise in the data, especially for the aid variables that are quite volatile (Bulíř
and Hamann, 2003). It also increases the sample size, extending the period covered and allowing the inclusion of countries that have observations missing for some years. Finally using the sub-period averaged panel captures something of the dynamic relationship between aid inflows and the tax ratio (it is now previous period rather than previous year aid that can impact on tax effort).
Table 5: Determinants of Tax Ratio: Panel of 55 Countries over 1975-95 with
Lagged Aid
Variables FE1 FE 2 FE 3 FE4
Aid 0.003 (0.013) Aid² 0.0002 (0.045) Loan 0.009 (0.025) (0.027)0.008 Loan² 0.012 (0.247) (0.261)0.027 Grant 0.0008 (0.017) (0.018)-0.003 Grant² 0.006 (0.065) (0.067)0.018 GDP per Capita 0.000009 (0.00002) (0.00002)0.000009 (0.00002)0.000007 (0.00002)0.000008 Agriculture -0.004 (0.005) -0.004 (0.005) -0.005 (0.005) -0.005 (0.005) Industry 0.016*** (0.005) 0.016***(0.005) 0.016***(0.005) 0.015***(0.005) Imports -0.005* (0.003) -0.005* (0.003) -0.005* (0.003) -0.005* (0.003) Exports 0.006* (0.003) (0.003)0.005* (0.003)0.005* (0.003)0.006* R² 0.0103 0.0117 0.0094 0.0114 Wald chi² 6.37 6.44 6.32 4.96 P-value 0 0 0 0 N 55 55 55 55 Obs 220 220 220 220
Table 4 presents the results using both fixed and random effects estimators (the Hausman test supports fixed-effects). The results are broadly similar to those reported above: the coefficient on Loans is positive and significant while the coefficient on Grants is negative when significant. However, when we allow for lagged aid in this panel, the aid variables are all insignificant (Table 5), and in fact the ‘tax performance’ equation overall performs poorly. There is no evidence that aid or the composition of aid affects tax effort in a dynamic context. This suggests that one should exercise extreme caution in interpreting the earlier results and those of Gupta et al (2004) as evidence that aid composition has a ‘causal’ effect on tax effort.
If, on average over time, donors give more aid in the form of grants to recipients with relatively lower tax ratios, one would observe a negative contemporaneous relationship between grants and the tax ratio. This is what we tend to observe. To the extent that tax ratios change slowly over time relative to aid, especially in the context of aid tending to trend down, this negative relationship would also be observed using aid lagged one year (i.e. a one year lag may not adequately account for endogeneity). However, if the composition of aid has a systematic causal impact on the tax ratio, period lagged aid variables should have a significant effect on the tax ratio. This does not appear to be the case, i.e. there is no evidence that over the medium term grants appear to discourage tax effort. In fact, over the medium term tax effort seems to be independent of aid.
Changing from a panel based on annual observations to one based on period averages noticeably affects the results, and the model performance deteriorates dramatically. This may be because the revenue performance equation is essentially a contemporaneous relationship: current tax/GDP ratios are explained by current values of the economic structure (tax base) variables, and one-year lags are appropriate. The annual panels in Tables 1-3 are appropriate to estimate this. Once aid variables are added one is including an implicit behavioural relationship (as aid composition is not part of the structural tax base). This renders interpretation of coefficients on aid variables difficult as they appear to capture a ‘reduced form behavioural response’ and implies one must consider what lags are appropriate for the response. The results in Table 5 suggest that there is no effect over the medium term, so what types of behaviour may be reflected in the results?
The tax revenue equation (excluding aid variables) is a revenue performance equation. As it is estimated across countries over time, it captures the relationship that holds on average. Given the values of the economic (tax base) variables, countries with ‘good’ revenue performance would have positive residuals and countries with ‘bad’ performance would have negative residuals. When aid variables are introduced and found to be significant, they are explaining or correlated with some of the residual (the variation in performance). The negative coefficient on grants suggests that such aid is associated with weak performance (a negative residual), while the positive coefficient on loans suggests that such aid is associated with strong performance. The specification and estimation does not permit the inference that aid causes such revenue performance. The correlation found is consistent with other interpretations. In particular, is it recipient behaviour (tax effort) or donor behaviour (aid allocation)?
Gupta et al (2004) infer that it is recipient behaviour, but this is not the only possibility. The finding that on average over time countries with a low tax to GDP ratio tend to receive a greater proportion of aid in the form of grants than do countries with a higher tax to GDP ratio is consistent with a number of possible explanations. It may be the case that on average, over time, donors give a greater proportion of aid in the form of grants to countries that are fiscally constrained. This will be the case if donors provide aid to finance the ‘fiscal gap’
and do not wish to burden low-income countries with unsustainable levels of debt. This would yield the negative relationship observed: ‘shortfalls in aid tend to coincide with shortfalls in domestic revenue [and] countries that suffer from revenue volatility also exhibit higher volatility in aid receipts, perhaps because both revenue and aid fluctuations are driven by domestic policy instability’ (Bulíř
and Hamann, 2003: 83).
It may also be that aid inflows directly and negatively affect the economy’s tax base, and that countries that are more aid dependent receive a greater proportion of aid in the form of grants. Aid can affect tax bases, and indeed it is likely that the policy reforms associated with aid conditions will affect the tax base. For example, trade policy reform is a major component of conditional lending – the conditions attached to aid (but not necessarily the level of aid) could affect both the tax base (the volume of trade) and effective tax rate (policies included reducing tariffs and eliminating export taxes). It is possible, but less likely, that aid could affect other tax base variables. Such complex effects are not captured in the estimation we have considered, and are beyond the scope of this paper (especially as such effects will be heterogeneous across countries). However, if conditions related to ‘tax base policies’ such as trade liberalization are more pronounced in low-income countries that are more likely to receive grants, there may be some tendency for grants to be provided to compensate for conditions that reduce tax revenue (at least in the short term). Country-specific fiscal response studies may shed some light on this issue.
3
A Digression on Time Series Evidence
The literature on the fiscal impact of aid (e.g. McGillivray and Morrissey, 2004) demonstrates that one is essentially estimating a form of simultaneous relationship in addressing the impact of aid on fiscal variables. In the traditional approach, a reduced form equation is estimated. In using the vector autoregression (VAR) approach, this reduced form representation is achieved by assuming one cointegrating vector linking the fiscal variables, using theory to guide any restrictions in interpreting the VAR (see Osei et al, 2005). Most studies restrict attention to the fiscal variables only; therefore one cointegrating vector is justified. Our analysis for Kenya goes a step further, in also considering the additional link to growth. This suggests the possibility of more than one cointegrating vector, as in principal one has a simultaneous equation system with one relationship between the fiscal variables, and then a relationship between the fiscal variables and growth.
The analysis is based on five variables (full details on the analysis can be found in M’Amanja, Lloyd and Morrissey, 2005): total government expenditure (TEXP), total tax revenue (TAX), output is real per capita income (Yp) and there are two measures of foreign aid, external grants (GRANT) and net external loans (LOAN). On average, the level of total government expenditure excluding debt repayments for the period 1964-2002 is 25% of GDP while tax revenue accounts for 21% of GDP on average. Grants and loans constitute only about 1% and 2% of GDP respectively as a period average. This is much lower than what is reported in donor aid statistics. We use the Kenyan data because this is the data upon which financial and economic planning is based by Kenyan policy makers (i.e. as revealed by the government’s own budget data), it allows us to distinguish grants and loans, and much of the aid reported by donors does not actually go to the government (much technical assistance, for example, is not even spent in Kenya).
Following Osei et al (2005) we start by formulating a general VAR model of the relationship between fiscal aggregates, aid and economic growth. All variables are
found to be non-stationary so we test for cointegration in a multivariate framework. The results allow us to accept that there are two cointegrating relationships. For the growth relation in the first cointegrating vector, we normalise on output and put a zero restriction on tax revenue. For the fiscal relation represented by the second cointegrating vector, we may exclude output as our interest is to investigate the relationship between aid, taxes and expenditure. In this case, normalisation is on aid loans and a zero restriction is imposed on output.
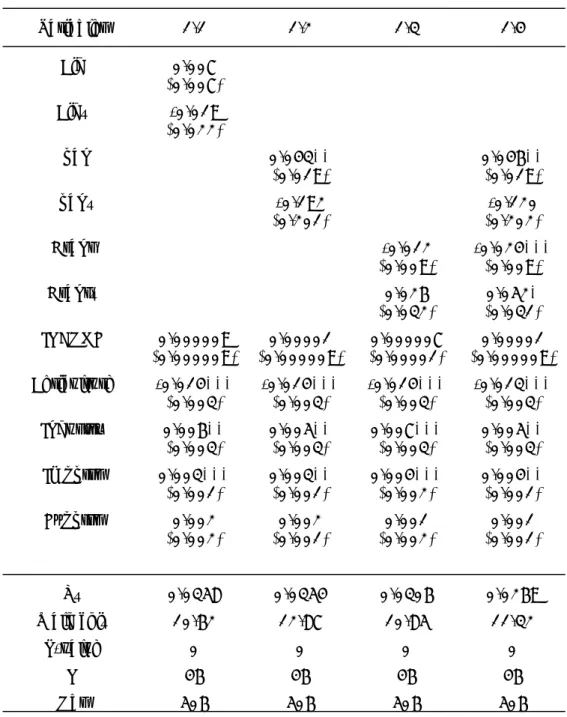
The results for the just-identified model are reported in Table 6 below. Aid loans exhibit a negative correlation with output in the long-run, although expenditure and aid grants have significant positive effects (the significance of grants is weak). We conjecture that the government seeks aid loans in the face of a fiscal deficit, so this is consistent with observing a negative effect of deficits on long-run income. The results for the fiscal vector support the conjecture as expenditure has a positive effect on loans while tax revenue has a negative effect. Furthermore, the coefficient on TEXP is much higher than that on TAX, implying that the responsiveness of loans to spending is greater than the responsiveness to tax revenue. Aid grants have an insignificant relationship with aid loans. Note that the normalisation on loans for the fiscal vector is somewhat arbitrary, but the insignificance of grants implies that they are not a significant determinant of tax revenue, i.e. there is no evidence in this case for an adverse effect of grants on tax effort.
Table 6: Long-Run Estimates for Fiscal Model
Output Vector Fiscal Vector Variable coefficient t-stat coefficient t-stat Output (Yp)
Expenditure (TEXP) Revenue (TAX) Aid grants (GRANT) Aid loans (LOAN)
---0.39 0.02 -0.10 ---6.15 2.19 -6.40 3.98 -2.29 -0.04 ---7.92 -5.95 -0.45 ---Note: The Output vector is normalised on Yp and excludes TAX; the Fiscal
vector is normalised on LOANS and excludes Yp.
Government spending appears to contribute to growth in the long-run whereas tests justify excluding tax from the long-run output model, implying that taxes have no negative impact on per capita income (i.e. no adverse effect of tax-induced distortions). The results for aid depend on the measure used. Grants appear beneficial, as they have a positive effect on income (output). The weak significance of grants may reflect their low value throughout the period. The results suggest that loans are sought to finance an ‘unanticipated’ fiscal deficit, and are therefore negatively associated with output. If tax revenue is lower than expected and/or spending is higher than planned, loans are required. There is an inverse relationship between aid loans and grants, so a shortfall in grant income also appears to encourage increased loans. M’Amanja et al (2005) corroborate these results with estimates of the short-run dynamics and impulse response analysis of shocks in aid loans on fiscal variables. There is a rise in output in the first three years of the shock in loans but output falls thereafter. In contrast, shocks in grants have an overall positive effect on per capita output.
The results indicate that the effect of aid depends on the type of aid. Grants appear to contribute to growth by financing public spending in a non-distortionary
manner. However, the positive impact is very weak, perhaps because grants have been relatively small. Aid loans, on the other hand, appear negatively associated with growth. Our inference is that this is because loans are sought to finance unanticipated deficits, and it is these deficits rather than adverse effects of aid that reduce growth (income). Government spending appears to have beneficial effects on growth in Kenya, whereas tax revenue is neutral. There is no evidence that grants induce reduced tax effort. In fact, the overall results suggest that Kenya has limited ability to alter tax revenue or to affect the level of grants; loans, because the government can choose whether or not to seek them, appear to be the more discretionary component of aid. In the context of the literature discussed in the previous section, it may be that loans, or the grant/loan mix in aid, are more of a policy variable than the tax ratio.
4 Conclusion
This paper investigates the recipient tax revenue response to inflows of aid and whether the composition of aid, i.e. loans or grants, induces a significantly different response. The core of the paper examines the relationship between the composition of aid and tax revenue using two different panel data sets. The first panel consisted of a sample of 46 countries with annual data over 1980-1990 and the results were broadly consistent with Gupta et al (2004): loans are positively related and grants negatively (but weakly) related to the tax to GDP ratio. We argued that the panel with annual data was appropriate to capture the structural revenue performance relationship, but may not be appropriate to capture the behavioural effect of aid on tax effort. To allow for the possibility that the effect of aid on tax revenue was a medium term behavioural response a four period panel was created, taking five-year averages of data for 55 countries over the period 1976-1995. In this period panel when lagged aid variables are used the relationship between the aid variables and the tax ratio disappears.
While we corroborated the results of Gupta et al (2004) regarding the essentially contemporaneous relationship between aid and tax effort, positive for loans and negative for grants, we found the results for grants to be non-robust and questioned the inference they drew. The results do not justify a clear inference that grants induce reduced tax effort, and there is also no evidence for a medium term impact on tax effort (which one could expect if the relationship reflected fiscal behaviour), a finding supported by the time series study for Kenya. The negative relationship between grants and the tax ratio is equally consistent with the possibility that on average, over time, donors give more aid in the form of grants to those countries which are fiscally constrained. This is especially relevant as the poorer countries that receive a greater share of aid in the form of grants are more likely to be fiscally constrained.
The revenue response to aid remains an important issue. Governments in developing countries face a formidable challenge creating an effective and efficient tax system (Tanzi and Zee, 2000). If it can be demonstrated that aid flows systematically reduce government revenue efforts, then this can be viewed as reducing the effectiveness of aid. Gupta et al (2004) argue that this is the case for aid in the form of grants but we question this: the evidence for a negative coefficient on grants in the tax ratio equation is not very robust and is consistent with alternative explanations. In particular, the structural tax performance equation used for the estimation is not particularly appropriate to capture the behavioural nature of effects of the composition of aid.
The fiscal response literature is more appropriate to address the behavioural effects of aid on tax effort, but by its nature tends to involve country time series
studies (which rarely distinguish grants and loans). We presented some illustrative results for Kenya, suggesting that tax revenue was not responsive to grants while the government sought loans when it had a deficit to finance, i.e. tax effort was not responsive to aid, but the composition of aid may respond to tax revenue relative to spending. Furthermore, loans (because they tend to be a response to unanticipated budget deficits) appeared to have an adverse impact on growth whereas grants (because they finance beneficial spending without creating a debt obligation) appear to impact positively on growth. It is interesting that in a very different context for cross-country growth regressions, Cordella and Ulku (2005) find that more concessional aid has a greater impact on growth on poorer countries with weak policies and high debt. For the most vulnerable countries, this suggests that at the margin grants are preferable to loans.
We noted in the introduction that much of the debate between grants and loans revolves around their effect on tax effort and/or growth. We have concentrated on the effect on tax effort, and argued that the evidence for grants discouraging tax effort is at best weak. There are many reasons why it is very difficult for poor countries to increase tax/GDP ratios so an observed negative relationship between grants and tax effort is unlikely to be causal. In fact, there is some evidence that grants may be more conducive to growth than loans, because they do not add to indebtedness and therefore support stable fiscal policy. For the poorest countries most in need of aid the case for giving this in the form of grants remains strong.
References
Bräutigam, D. (2000) ‘Aid Dependence and Governance’, (Stockholm: Almqvist and Wiksell) Accessed 2005 at: www.egdi.gov.se/pdf/20001pdf/2000_1.pdf Bulir, A. and A. Hamann (2003), ‘Aid Volatility: An Empirical Assessment’, IMF
Staff Papers, 50, 64-89.
Cordella, T. and H. Ulku (2005), ‘Grants Versus Loans’, IMF and IDPM, mimeo. DFID (2001), ‘Loans or Grants: IDA’s Concessional Lending Role’, statement
issued by Department for International Development (DFID).
Ghura, D. (1998) ‘Tax Revenue in Sub-Saharan Africa: Effects of Economic Policies and Corruption’ IMF Working Paper, No. 98/135, Washington DC: International Monetary Fund.
Greenaway, D. and C. Milner (1991) ‘Fiscal Dependence on Trade Taxes and Trade Policy Reform’ Journal of Development Studies, 27, 95-132.
Gupta, S., B. Clements, A. Pivovarsky and E. Tiongson (2004), ‘Foreign Aid and Revenue Response: Does the Composition of Aid Matter?’, chapter 14 in S. Gupta, B. Clements and G. Inchauste (eds), Helping Countries Develop: The Role of Fiscal Policy, Washington DC: International Monetary Fund, pp. 385-406.
IFIAC (2000) ‘Report of the International Financial Institution Advisory Commission’, Washington DC: U.S. Congress. Accessed June 2005 at www.house.gov/jec/imf/meltzer.pdf
Lotz, J. and E. Morss (1967) ‘Measuring ‘Tax Effort’ in Developing Countries’, IMF Staff Papers, 14, 478-99.
McGillivray, M. and O. Morrissey (2004), ‘Fiscal Effects of Aid’ in T. Addison and A. Roe (eds), Fiscal Policy for Development, Basingstoke: Palgrave/WIDER, pp. 72-96.
M’Amanja, D., T. Lloyd and O. Morrissey (2005), ‘Fiscal Aggregates, Aid and Growth in Kenya: A Vector Autoregressive (VAR) Analysis’, School of Economics, University of Nottingham: CREDIT Research Paper 05/07 (under Research Papers at www.nottingham.ac.uk/econmics/credit).
Morrissey, O. and H. White (1996), ‘Evaluating the Concessionality of Tied Aid’, The Manchester School, LXIV: 2, 208-226.
Odedokun, M (2003) ‘Economics and Politics of Official Loans versus Grants’, WIDER Discussion Paper No. 2003/04, Helsinki: World Institute for Development Economics Research.
Osei, R., O. Morrissey and T. Lloyd (2005), ‘The Fiscal Effects of Aid in Ghana’, Journal of International Development, 17:8, 1037-1054.
Salazar, V. (2002) ‘Taken for granted? US proposal to reform IDA’ Available at http://www.brettonwoodsproject.org/article.shtml?cmd[126]=x-126-16169 Sandford, J. E. (2002) ‘World Bank: IDA Loans or IDA Grants?’, World
Development, 30: 5, 741-762
Schmidt, W. (1964) ‘The Economics of Charity: Loans versus grants’, The Journal of Political Economy, 72: 4, 387-395
Stotsky, J. and A. WoldeMariam (1997) ‘Tax Effort in Sub-Saharan Africa’, IMF Working Paper No. 97/107, Washington DC: International Monetary Fund. Tanzi, V. (1992) ‘Structural Factors and Tax Revenue in Developing Countries: A
Decade of Evidence’, in I. Goldin and A. Winters (eds.) Open Economies: Structural Adjustment and Agriculture, Cambridge: Cambridge University Press, pp. 267-81
Tanzi, V. and H. Zee (2000) ‘Tax Policy for Emerging Markets - Developing Countries’, IMF Working Paper No. 00/35, Washington DC: International Monetary Fund.
US Treasury Department (2000) ‘Response to the report of the International Financial Institution Advisory Commission’ Available at http://www.ustreas.gov/press/releases/reports/response.pdf
World Bank (2001) ‘IDA Eligibility, Terms and Graduation Policies’, Available at http://www.worldbank.org/ida/ida13docs.html.
World Bank (2003). ‘Compensating IDA for the Cost of IDA 13 Grants’, Available at http://www.worldbank.org/ida/ida13docs.html.
World Bank (2004) World Development Indicators 2004, Washington DC: The World Bank.
Appendix: Data Sources and Summary Statistics
The full dataset covered 106 countries over 1975-2000 with data from World Development Indicators (World Bank), World Economic Outlook (IMF) and Geographical Distribution of Financial Flows to Developing Countries (OECD). Net Aid (OECD) - total Official Development Assistance (ODA) including Technical Co-operation but excluding rants, loans and credits for military purposes. Data reported in Current US$ is converted to share of GDP.
Net Loans (OECD) - ODA loans with maturities of over one year and meeting the criteria set out for ODA, extended by governments or official agencies, and for which repayment is required in convertible currencies or in kind. The net data are reported after deduction of amortisation payments and the impact of other measures reducing debt (e.g. forgiveness). Data reported in Current US$ is converted to share of GDP.
Grants (OECD) - ODA transfers, in money or in kind, for which no repayment is required. Data reported in Current US$ is converted to share of GDP.
Tax Revenue as % of GDP (World Bank) - Tax revenue comprises compulsory, unrequited, non-repayable receipts for public purposes collected by central governments.
Per Capita GDP (Current US $ per person) (IMF) - derived by first converting GDP in national currency to US dollars and then dividing by total population. Agricultural Value Added as % of GDP (World Bank) - measures the output of the agricultural sector less the value of intermediate inputs. Agriculture comprises value added from forestry, hunting, and fishing as well as cultivation of crops and livestock production.
Industrial Value Added as % of GDP (World Bank) - comprises value added in mining, manufacturing, construction, electricity, water, and gas. Value added is the net out put of a sector after adding up all outputs and subtracting intermediate inputs.
Imports of Goods and Services as % of GDP (World Bank) - represents the cif value of all goods and other market services procured from the world.
Exports of Goods and Services as % of GDP (World Bank) - value of all goods and other market services provided to the world.
Table A1 provides a summary of the key variables. The table was constructed using the mean of each variable for the entire sample of 106 countries over the period 1975-2000. This information was further aggregated according to the average tax to GDP ratio, and the mean taken for each tax to GDP group. We can see that 65 percent of the countries have an average tax ratio of between 10-20%, while 16 percent have tax ratios below, and 19 percent of the sample have tax ratios above, this bracket. Note that 25 percent of those countries with a tax ratio below 10 percent are major oil exporters. It is often the case that these countries do not report significant oil revenues as tax revenue (World Bank, 2004).
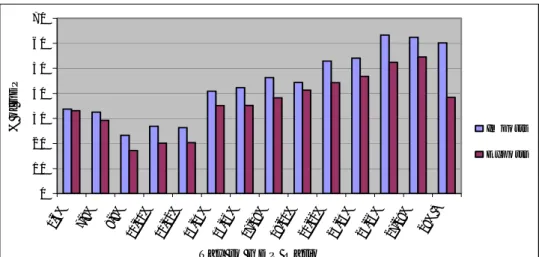
Figures A1-A3 summarise the information in Table A1. There is no clear relationship between the tax ratio and either the quantity or composition of aid inflows (Figure A1). Export and import shares (Figure A2) are positively related to
the tax ratio, whereas the agricultural share of GDP (Figure A3) appears to be negatively related to tax ratio.
Table A1: Summary Statistics for Sample of 106 Countries over 1975-2000
Tax % GDP Aid % GDP Loans % GDP Grants % GDP Imports % GDP Exports % GDP Agric. % GDP Industry % GDP Country Freq. 0-6% 0.055 0.017 0.038 26.57 25.95 25.61 34.59 4 7-8% 0.124 0.033 0.091 43.86 37.88 30.57 32.17 6 8-9% 0.044 0.017 0.027 23.49 15.98 32.59 23.48 7 10-11% 0.087 0.029 0.058 27.37 21.98 29.34 26.69 15 11-12% 0.042 0.018 0.024 30.75 21.99 24.51 26.55 14 13-14% 0.131 0.038 0.093 39.58 25.33 34.23 22.62 8 15-16% 0.074 0.024 0.050 50.38 43.98 20.48 30.45 10 17-18% 0.084 0.022 0.062 55.94 49.53 22.33 26.98 11 19-20% 0.053 0.018 0.035 40.47 37.04 15.03 34.27 11 21-22% 0.069 0.021 0.048 52.54 41.09 13.43 29.76 5 23-24% 0.056 0.026 0.030 59.02 50.42 15.21 25.41 5 25-26% 0.052 0.016 0.037 88.59 76.71 13.29 36.51 2 27-28% 0.025 0.004 0.021 42.21 39.03 11.10 41.68 2 29% + 0.067 0.021 0.046 59.62 40.23 17.66 29.05 6 Mean 0.072 0.023 0.049 41.82 34.01 23.44 28.62 Total St. Dev 0.075 0.023 0.056 23.80 23.08 14.36 11.27 106
Source: Various. See Appendix 1.
Figure A1: Aid and Tax/GDP ratios Averaged 1975-2000
0 1 2 3 4 5 6 7 8 9 1 0 0-6 % 7-8 % 8-9 % 10-1 1% 11-1 2% 13-1 4% 15-1 6% 17-1 8% 19-2 0% 21-2 2% 23-2 4% 25-2 6% 27-2 8% 29% + T a x to G D P R a tio % o f G D P T o ta l A id G ra n ts L o a n s
Figure A2: Exports and Imports and Tax/GDP ratios Averaged 1975-2000
Figure A3: Agricultural Value Added and Tax/GDP ratios Averaged 1975-2000
0 5 1 0 1 5 2 0 2 5 3 0 3 5 4 0 0-6 % 7-8 % 8-9 % 10 -11 % 11 -12 % 13 -14 % 15 -16 % 17 -18 % 19 -20 % 21 -22 % 23 -24 % 25 -26 % 27 -28 % 29 % + T a x t o G D P R a t i o % of G D P A g r ic u lt u r a l V a lu e A d d e d 0 1 0 2 0 3 0 4 0 5 0 6 0 7 0 0-6 % 7-8 % 8-9 % 10-1 1% 11-1 2% 13-1 4% 15-1 6% 17-1 8% 19-2 0% 21-2 2% 23-2 4% 25-2 6% 27-2 8% 29% + T a x t o G D P R a t io % o f G D P Im p o r ts E x p o r ts