MODELING SUPPLY CHAIN PERFORMANCE VARIABLES
Ashish Agarwal and Ravi Shankar
Department of Management Studies, Indian Institute of Technology, Delhi Hauz Khas, New Delhi – 110 016, India
Corresponding author: [email protected]
ABSTRACT
In order to understand the dynamic behavior of the variables that can play a major role in the performance improvement in a supply chain, a System Dynamics-based model is proposed. The model provides an effective framework for analyzing different variables affecting supply chain performance. Among different variables, a causal relationship among different variables has been identified. Variables emanating from performance measures such as gaps in customer satisfaction, cost minimization, lead-time reduction, service level improvement and quality improvement have been identified as goal-seeking loops. The proposed System Dynamics-based model analyzes the affect of dynamic behavior of variables for a period of 10 years on performance of case supply chain in auto business.
Keywords: Supply chain management,system dynamics, supply chain performance
INTRODUCTION
A supply chain (SC) is the connected series of value activities concerned with the planning and controlling of raw materials, components and finished products from suppliers to the final customers (Stevens, 1989). Supply chain management (SCM) provides an opportunity to the firms to look beyond their own organization and collaborate with the value chain partners for the mutual benefits. The traditional view of SCM is to leverage the SC to achieve the cost minimization while assuring quality and service level throughout the SC. The difficulties in designing and analyzing a SC are mainly due to its processes that have complex relationships among themselves and offer impact differently on the performance measures. Performance of a SC is characterized by its ability to remain responsive without losing the integration through its chain. Typical characteristics of a SC include multiple partners; partner evaluations based on purchase price; cost-based information bases; arm's-length negotiations; formal short-term contracts; and centralized purchasing. Such characteristics of SC lead to weak integration and poor responsiveness. World-class business organizations are now begun to realize that integrated manufacturing processes, non-integrated distribution processes and poor relationships with suppliers and
customers are the recipes of disaster in the management of SC. Before implementation of any policy towards integration of SC, management of case SC would like to have some information about impact of policy implementation on other performance variables. It is realized that the impact of any policy on the supply chain performance (SCP) improvement cannot be predicted with desired confidence before its execution. System dynamics (SD) considers the causal relationships among variables and through simulation permits the evaluation of such impact on the operating performance of whole SC. In the practical application of this concept, development of the SD model for analyzing the SCP would be a prerequisite.
LITERATURE REVIEW
In the literature different measures for SCP are suggested. For example, Stevens (1990) suggests the performance measure of SC in terms of inventory level, service level, throughput efficiency, supplier performance and cost. Neely et al. (1995) in his work suggests quality, time, flexibility and cost as a few categories of performance measures and also points out need of a generally applicable systematic approach to performance measurement. New (1996) presents taxonomy for the classification of SC improvement. Different researchers have attempted to assess SCP in different ways, but most performance measures up to now be more oriented towards economic performance than to other aspects of performance such as customer satisfaction (Harland, 1996). Narasimhan and Jayaram (1998) use the customer responsiveness and manufacturing performance as the measure for SCP. Spekman, Kamauff, and Myhr (1998) use cost reduction and customer satisfaction as the SC measures. Beamon (1998) identifies several qualitative SCP measures: customer satisfaction, flexibility, information and material flow integration, effective risk management, and supplier performance. Van Hoek (1998) proposes a framework at the firm's level of integration in the SC and the strategy adopted. Beamon (1999) develops a performance evaluation framework for manufacturing SCs, where resources, output and flexibility are considered necessary components for SCP. Shah and Singh (2001) provide a framework for benchmarking internal SCP. The supply chain operations reference model (SCOR) developed by the Supply Chain Council (Stewart, 1997) provides a useful framework that considers the performance requirements of member firms in a SC. The SCOR model views activities in the SC as a series of interlocking inter organizational processes with each individual organization comprising four components: plan, source, make and deliver. The SCOR model provides an indication as to how effective a firm uses resources in creating customer value. It considers the performance expectations of member firms on both input and output sides of SC activities (Lai, Ip, & Lee, 2001). In spite of the recognition of the importance of the measures of SCP, organizations often lack
the insight for the development of effective performance measures and metrics needed to achieve a fully integrated SC. While many firms recognize both aspects of performance, they fail to understand them from a perspective of a balanced framework for performance measurement (Brewer & Speh, 2000). The differences in the views of SCP would lead to inconsistency in the performance measures used across member firms in a SC and consequently suboptimize supply chain-wide performance (Gunasekaran, Patel, & Tirtiroglu, 2001). It can be seen that each of above researchers, more or less, has addressed some dimensions of SCP measures, but not all. Among all measures, customer responsiveness/satisfaction receives the most recognition. Therefore, there is need to develop generally applicable performance measurement system for SC, which is capable of addressing these questions and also captures dynamic impact of variables on the SCP. In the literature on SC, there are research papers having simulation models to analyze SC behavior and performance. For example, Forrester (1961) has analyzed simulation issues evolving around SCM using system dynamics. Wikner, Towill, and Naim (1991) uses a three-echelon production system as a SC reference model for comparing various methods of improving total dynamic performance. Towill (1996) in his paper presents various ways in which industrial dynamics (ID) may be built and exploited in SC re-engineering. He has used people-based, observation-based and system-knowledge-based sources to develop a real life model for an electronics-products SC. Hafeez et al. (1996) applies SD approach in analyzing and modeling of a two-echelon steel industry SC. Swaminathan, Smith, and Sadeh (1998) describes a SC modeling framework and used approach in which SC models are composed of software components that represent types of SC agents like retailers, manufacturers, transporters, their constituent control elements and their interaction protocols. De Souza, Zice, and Chaoyang (2000) investigate the dynamics of the SC both quantitatively and qualitatively. Their observations provide some guidelines for SC re-engineering. Angerhofer and Angelides (2000) propose taxonomy of research work and related development in System Dinamics (SD) modeling in SCM. Lai et al. (2001) argues that SD is a practical approach to identify the relationship between the different service processes and improve the operation efficiency. Persson and Olhager (2002) evaluate alternative SC designs with respect to key performance parameters like quality, lead-times and cost. They also analyze the interrelationships among these key variables. Literature on SD modeling of SC generally analyzes the effect of key performance variables on demand amplification and on inventory level.
In order to analyze the variables that provide the route of performance improvement in a SC, SD approach-based model is proposed in this paper. The paper discusses the variables involved in the SD modeling of SCP. The objective of SD model is to capture the dynamic interaction among different variables that the system has and to analyze the policy decision over a long-term horizon. For
this a system boundary is defined and a model of the system is developed. The purpose is to understand the implication of these variables so that proactive measures are taken that can result into long-term advantage of the SC.
The paper is further organized as follows: first variables involved in determining the supply chain performance index (SP Index) is discussed. These variables are then used to develop the causal loop diagrams. Subsequently, SD modeling and simulation experiments are conducted and influence of variables on performance of Indian auto supply chain is analyzed.
Variables of the SD Model for Case Supply Chain
The case of SC is a network of auto manufacturer, suppliers of raw material, components, tools and machinery, transporters and dealers. Due to emergence of new competitors in the auto market, business of the case SC is declining. Other major competitors are focusing on their SC integration and are able to cut the cost of the product. Decrease in the cost of the product has attracted large number of customers from economy segment. They also brought a model for executive segment of high quality. Customers from both segments are inclining towards the competitors of the case SC. Top management involved in the case SC is willing to improve the present situation to survive in the market. Key variables of SCM system and their time, response or reference mode are identified to define the problem dynamically. Key variables have been identified on the basis of group discussion with experts from trading partners of the case SC and review of SCM literature. Five variables are identified as outcomes or results. Results are emphasized for the improvement of SCP. Inhibitors reduce the effect of enablers and results on SCP. All these SP variables are defined in Table 1.
TABLE 1
DEFINITION OF VARIABLES FOR ENABLERS, RESULTS AND INHIBITORS Variables for
SCP enablers References Remarks
Market sensitiveness (MS)
Christopher (2000)
Agarwal & Shankar (2002a) Ability of SC to quickly respond to the market demand and makes the SC agile.
Delivery speed
(DS) Jayaram et al. (1999), Christopher & Towill (2001) Power et al. (2001)
Incorporates meeting long-term and short-term goals based on customer and market expectations.
TABLE 1. (Continued) Variables for SCP
enablers References Remarks
Process integration (PI)
Christopher (2000) Means collaborative working between buyers and suppliers, joint product development, common systems and shared information.
Centralized and collaborative planning (CCP)
Christopher & Towill (2001) Maximize opportunities for all trading partners to secure full use of potential of each partner. New product
introduction (NPI)
Jayaram, Vickery, & Droge (1999),
Christopher & Towill (2001)
Helps to acquire market share by being first in the market
Data accuracy
(DA) Yu, Yan, & Edwin Cheng (2001) Synchronizes the demand side information with supply side information.
Use of IT tools (UIT)
Yu, Yan, & Edwin Cheng (2001)
Helps in effective information flow along the SC which further initiates process integration. SCP Variables for Results
Lead time reduction (LTR)
Towill (1996)
Jayaram, Vickery, & Droge (1999)
A major order winning criteria which is essential for lean and agile SC.
Service level improvement (SLI)
Mason-Jones, Naylor, & Towill (2000)
Ensure availability of products and services in right place and at right time.
Cost minimization (COM)
Mason-Jones, Naylor, & Towill (2000)
An important market qualifier and is usually reduced by leanness. Customer
satisfaction (CUS)
Naylor, Naim, & Berry (1999)
Jayaram, Vickery, & Droge (1999)
Improvement in customer
satisfaction level is effected by the impact of other performance variables.
Quality
improvement (QI)
Christopher & Towill (2001), Naylor, Naim, & Berry (1999),
Person & Olhager (2000)
Enables SC to provide quality products and better services to the customers.
TABLE 1. (Continued) Variables for SCP
enablers References Remarks
SCP Variables for Inhibitors
Uncertainty (U) Prater, Biehl, & Smith (2001) Resulting from volatile market and SC complexity.
Lack of trust
(LOT) Handfield & Bechtel (2002) Agarwal & Shankar (2003) Presents among the trading partners of the SC which prevents smooth flow material and
information. Resistance to
change (RTC)
Fawcett & Magnan (2002) Exists among the trading partners and employees to resist any change in the policy.
Supply chain performance improvement index (SP Index) and other variables are listed in Table 2.
TABLE 2
DEFINITION OF OTHER VARIABLES
Other variables Remarks
Supply chain performance index (SP Index)
Aggregate results of SCP variable enablers, results and inhibitors Gap in customer satisfaction
(GCUS)
Difference between desired and actual customer satisfaction Gap in lead time reduction
(GLTR) Difference between desired and actual lead-time reduction Gap in service level improvement
(GSLI) Difference between desired and actual service level improvement Gap in cost minimization
(GCOM)
Difference between desired and actual cost minimization Gap in quality improvement
(GQI)
Difference between desired and actual quality improvement Actual customer satisfaction
(ACUS) Customer satisfaction achieved by the organization
TABLE 2. (continued)
Other variables Remarks
Actual lead time reduction (ALTR)
Lead-time reduction achieved by the organization
Actual service level improvement
(ASLI) Service level improvement achieved by the organization Actual cost minimization
(ACOM) Cost minimization achieved by the organization Actual quality improvement
(AQUI)
Quality improvement achieved by the organization
Desired lead time reduction (DLTR)
Desired target for lead-time reduction set by the organization
Desired customer satisfaction
(DCUS) Desired target for customer satisfaction for competitive advantage set by the organization
Desired service level improvement (DSLI)
Desired target for service level improvement to sustain and grow and become competitive set by the organization
Desired cost minimization (DCOM)
Desired cost minimization target set by the organization
Desired quality improvement
(DQUI) Desired quality improvement target set by the organization
Weighting of SP Variables for Effective SCM
Weightage of SP variables for effective SCM in organizations based on automobile sector perception have been identified and are indicated in Table 3. Experts have been asked to judge the level of SCP variables (in the scale of 0 to 100) of the case SC in 1999 with compare to their business competitors. For this, trading partners of case SC are required to self-assess their performance against each variable. The purpose of the modeling using SD methodology is to understand the strengths and weaknesses against each variable and to analyze the impact of variables on the SCP.
Developing Causal Loop Diagram for SP Index
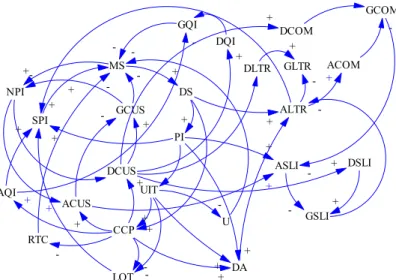
SD focuses on the structure and behavior of the system composed of interacting feedback loops. Causal loop diagramming is an important tool, which helps the modeler to conceptualize the real world system in terms of feedback loops. In a causal loop diagram, the arrows indicate the direction of influence with the plus or minus sign depending upon the type of influence. All other things being equal, if a change in one variable generates a change in the same direction in the second variable, relative to its prior value, the relationships between the two variables is referred to as positive. If the change in the second variable takes place in the opposite direction the relationship is negative (Goodman, 1983; Mohapatra, Mandal, & Bora, 1994). Causal Loop Diagrams for SP Index and its variables is shown from Figures 1 to 5.
In causal loop diagram there are a number of loops among enablers, results, inhibitors and SP index. For illustration, we are discussing few of them. According to auto-sector experts, the effective market sensitiveness modulates the implementation of SCM and thus enhances SP Index. Thus the increase in market sensitiveness causes an increase in SP index in auto sector. A decrease in market sensitiveness has opposite effect(Agarwal & Shankar, 2002b). Thus feed back loop between market sensitiveness and SP Index variables are positive (Figure 1).
An increase in market sensitiveness rate in the auto sector will increase new product introduction (Christopher, 2000; Jayaram, Vickery, & Droge, 1999). Customers are the final judge of how well the organization performs, and what they say counts. It is their perception that will determine whether they remain loyal or seek better providers. An increase in market sensitiveness will drive employees to listen to the customers and act quickly on what they say. Dissatisfied customers must be heeded closely, for they often deliver the most valuable information (Christopher, 2000). An increase in new product introduction will increase the organization to set high desired customer satisfaction goal (Jayaram, Vickery, & Droge, 1999) which in turn will increase
gap in customer satisfaction. Gap in customer satisfaction is the result of difference between desired customer satisfaction and actual customer satisfaction. As gap in customer satisfaction increases it will have a negative effect on market sensitiveness. Thus feedback loop between market sensitiveness, new product introduction, desired customer satisfaction and gap in customer satisfaction variables are negative. As gap in customer satisfaction increases it will also have a negative effect on new product introduction. Thus feedback loop between new product introduction, desired customer satisfaction and gap in customer satisfaction variables are also negative (Figure 1).
MS DS NPI DA CCP PI UIT ASLI ALTR ACUS AQI ACOM DSLI DLTR DCUS DCOM DQI U RTC LOT GSLI GLTR GCUS GCOM GQI SPI + -+ + + -+ -+ + + + + + -+ - + + + -+ + -+ -+ + + -+ -+ + + +
Figure 1. Causal relationship among SCP variables
An increase in market sensitiveness causes an increase in delivery speed. An increase in delivery speed causes increase in centralized and collaborative planning, which in turn will increase use of information technology (IT) tools
(Christopher, 2001). An increase in the level of market sensitiveness implies that capability of SC in responding the customer demand is increased. In order to maintain the level of market sensitiveness, delivery speed will increase to ensure the timely delivery of product to the customer. Delivery speed can be enhanced if the SC is well integrated and the trading partners of the SC take decision collaboratively. Use of IT tools will be increased when there is more requirement for centralized and collaborative planning. Effective management by fact is cornerstone for effective planning, improved decision-making and better market sensitiveness. People make decisions everyday. Without information, however, the basis for decision-making is intuition or gut feeling. People routinely make decisions of enormous consequence about customers, strategies, goals and employees with little or no data. This is detrimental to SCM philosophy. Effective centralized and collaborative planning reduces resistance to change offered by employees and lack of trust among trading partners. The reason for reduction in the level of resistance to change and lack of trust is increase in interaction among trading partners. After having business transaction for certain period of time, trading partners develop trust among themselves, which also help in reducing the resistance to change. Experts in this case consider use of IT tools as one of the important factors, which positively influences SP Index. Effective measures should be designed to quantify results (and targets) in process improvement. An increase in use of IT tools will tend to minimize uncertainty, which in turn will further reinforce market sensitiveness. Thus feedback loop
between market sensitiveness, delivery speed, centralized and collaborative planning, use of IT tools and SP Index variables are positive (Figure 1).
An increase in market sensitiveness will tend to increase delivery speed which in turn, will increase process integration and which will further increase use of IT tools. Increase the use of IT tools also initiates process integration. An increase in delivery speed and use of IT tools will tend to increase market sensitiveness. An increase in market sensitiveness will help organizations to set desired service level improvement goal which in turn will decrease gap in customer satisfaction. An increase in gap in customer satisfaction will have negative effect on market sensitiveness. Also increase in gap in customer satisfaction will have negative effect on quality improvement. Thus feedback loop between market sensitiveness, delivery speed, process integration, use of IT tools, quality improvement, desired customer satisfaction and gap in customer satisfaction variables are negative (Figure 1).
Increase in process integration will tend to increase SP Index, which in turn will increase market sensitiveness rate in auto sector. Thus feed back loop between market sensitiveness, delivery speed, process integration and SP Index variables are positive.
An increase in market sensitiveness rate will tend to increase delivery speed, which in turn will increase centralized and collaborative planning. Increase in centralized and collaborative planning will tend to increase actual quality improvement in auto sector. Quality improvement is very important for the success of any auto organization. Increase in actual quality improvement will tend to increase SP index, which will have positive effect on market sensitiveness. Increase in actual quality improvement will reduce gap in quality improvement, which in turn will have positive effect on centralized and collaborative planning. Also increase in gap in quality improvement will tend to reduce market sensitiveness. Thus feedback loops between market sensitiveness, delivery speed, centralized and collaborative planning, actual quality improvement and SP Index variables are positive. Feedback loop between centralized and collaborative planning, actual quality improvement and gap in quality improvement variables are positive. Feedback loop between market sensitiveness, delivery speed, centralized and collaborative planning, actual quality improvement and gap in quality improvement variables are positive. Similarly feedback loop between market sensitiveness, delivery speed, centralized and collaborative planning, desired quality improvement and gap in quality improvement variables are negative (Figure 1).
An increase in delivery speed will tend to increase SP Index in auto sector, which in turn will further increase delivery speed. Thus feedback loop between delivery
speed and SP Index is positive. Similarly all feedback loops between delivery speed, centralized and collaborative planning, actual cost minimization, actual quality improvement, actual customer satisfaction, actual lead-time reduction, actual service level improvement, new product introduction, use of IT tools and SP Index variables are positive.
The SD model is developed on the basis of causal relationship among SP variables. Using ithink 7.0.2 software, SD equations have been generated in the model that represents the dynamics of the systems encapsulating the rate of changes with each interaction.
Supply Chain Performance Index (SP Index)
SP Index indicates the effect of enablers and results on the business processes within the SC of automobile sector. This model recognizes the fact that there has to be good enablers for better results. SP Index of any automobile SC can be improved provided enablers improve. These improvements are essential for better results. Strategically, organizations are required to focus on improving enablers and then only organizations can expect better results. For illustration purpose, few representations of associated SD equations are represented below. Here, A denotes auxiliary equations and K denotes System State at a time K. For example, first equation in the following set implies that SP Index at time K is the sum of enablers, results and inhibitors at time K.
A SP INDEX.K = ENB.K + RES.K- INH.K
A ENB.K = MS.K + UIT.K + DS.K + DA.K + NPI.K + PI.K + CCP.K A RES.K = LTR.K + SLI.K + CUS.K + COM.K + QUI.K
A INH.K = LOT.K + RTC.K + U.K
In this paper, the development of equation for market sensitiveness is discussed as an illustrative case. Similar, logics are needed for all variables to develop the related SD-equations for all the variables. Market sensitiveness provides clear picture of customer demand that improves the performance of other variables like delivery speed, data accuracy, new product introduction, centralized and collaborative planning, use of IT tools and process integration (Christopher, 2000). Thus for the success of any business developing market sensitiveness should be on top of the agenda of the management. Each level equation requires base year for the initial value. Base year for initial value of market sensitiveness is considered as 1999 based on actual feedback from one of the auto organization. The initial level of market sensitiveness is considered 4 on the basis of self-assessment by experts for case SC. Using ithink 7.0.2 software, the SD equations for market sensitiveness are represented in the following set. Here, L denotes level equations and N denotes initial value.
L MS.K = MS.J + (DT) (RMS.JK)
N MS = 4
MS Market sensitiveness (Numbers)
RMS Market sensitiveness Rate (Numbers/Year)
For the SC case, we have taken market sensitiveness level accumulates up to maximum level of 40. The maximum values of variables are obtained from the SC case and its trading partners, which reflect business performance of the SC during 1999 and 2002. Market sensitiveness can be presented as a closed loop. It is also assumed that the market sensitiveness rate depends entirely on the level of market sensitiveness, gap in lead time reduction results, gap in customer satisfaction, gap in service level improvement, gap in cost minimization and gap in quality improvement. Increase in market sensitiveness entirely depends on the commitment of trading partners of the SC. All trading partners of SC are required to assess the gap in the result performance and decide increase in market sensitiveness rate to steer the business to greater heights of growth and progress. While deciding increase in market sensitiveness rate, trading partners are also required to benchmark their processes with best of the organization to arrive at realistic rates. The rate of market sensitiveness (RMS) during time interval KL depends on level of market sensitiveness, gap in lead time reduction result, gap in customer satisfaction, gap in service level improvement, gap in cost minimization and gap in quality improvement. In the following set of SD equations R denotes a rate variables equation. Similarly other equations have been developed for other variables.
Model Results
Figure 2 shows the relationship among enabler, result, inhibitors and SP Index. The base year for the model is taken as 1999 when scores are captured for different variables from the trading partners of the SC case. The simulation time period is 10 years. Rate of improvement for enablers and results is slow during first and fifth year. From sixth year onwards their rate of improvement increases. Value of inhibitors is quite high in the beginning but gradually decreases. The reduction in the value of inhibitors is due to improved process integration, centralized and collaborative planning and better uses of IT tools. SP Index does not increase during first and third year due to high value of inhibitors and poor performance of enablers. As the impact of inhibitors reduces and influence of enablers and results increases, SP Index gradually improves. Increase in SP Index indicates the performance improvement of the SC.
4 4 4 4 3 3 3 3 2 2 2 2 1 1 1 1 400 1: ENB 700 105 200 400 80 1: 2: 3: 4: 1: 2: 3: 4: 1: 2: 3: 4: 1.00 0 100 55 2:55 PM Wed, Apr 30, 2003 10.00 7.75
Relationship among SP Index, enabler, result and inhibitor variables 5.50
Years 3.25
2: RST 3: SPI 4: INH
Figure 2. Relationship between enabler, result, inhibitor variables and SP Index
The trend charts of result variables and enabler variables are shown in Figures 3, 4 and 5. 5 5 5 5 4 4 4 4 3 3 3 3 2 2 2 2 1 1 1 1 50 45 1: ACOM 100 80 100 25 25 55 45 55 1.00 0 5 10 10 10
Relationship among SCP result variables 5.50 Years 3.25 2:55 PM Wed, Apr 30, 2003 10.00 7.75
2: ACUS 3: ALTR 4: AQI 5: ASLI
1: 2: 3: 4: 5: 1: 2: 3: 4: 5: 1: 2: 3: 4: 5:
1: DA 2: DS 3: CCP 4: MS 5: NPI 5 5 5 5 4 4 4 4 3 3 3 3 2 2 2 2 1 1 1 1 50 30 110 40 7 30 15 60 20 4 10 0 10 0 1 5.50 Years 3.25 1.00 2:55 PM Wed, Apr 30, 2003 10.00 7.75 1: 2: 3: 4: 5: 1: 2: 3: 4: 5: 1: 2: 3: 4: 5:
Relationship among SCP enabler variables
Figure 4. Relationship among enabler variables for improving the SP Index
1: PI 2 2 2 2 1 1 1 1 70 45 40 25 5.50 Years 3.25 1.00 10 5 2:55 PM Wed, Apr 30, 2003 10.00 7.75 2: UIW 1: 2: 1: 2: 1: 2:
Relationship among SCP enabler variables
Model Validation
Validation of the system dynamic model is necessitated to establish sufficient confidence in a model on some chosen criteria suitable for the SC under study. The proposed model results are validated through the case study of a SC, which has a network of auto manufacturer, suppliers and distributors. The case SC was doing well up in 1999 but it was not able to meet the customer demand and gain its market share. When the top management of the company planned to integrate their whole SC, they had realized a number of barriers. Their trading partners did not have significant level of trust among themselves. Resistance to change was offered by their employees in implementing any new policy to improve the performance of the SC. They were unable to predict the influence of uncertainty on SCP. Therefore, they opted for SD modeling approach for their SC so that the expected picture of their efforts might be predicted and they should be able to analyze the impact of variables on the performance of SC. Through literature survey and interviews with experts from the trading partners, 15 variables are identified. Seven variables, which help in improving the SCP, are termed as enablers. Five variables, which reflect the improvement in enablers, are stated as results. Three variables, which act as barriers, are mentioned as inhibitors. Causal loop diagrams are prepared on the basis of feedback received through discussion with the experts from case SC. System dynamics model is developed from the causal relationship among SCP variables. The average values of the variables to gauge the performance of SC for the year 1999 and 2002 are obtained from the SC of Indian auto sector. The values of the SCP variables are obtained through SD modeling using ithink 7.0.2 software. The little variation in these two values observed in Table 3 validates the proposed SD model.
TABLE 3
VALIDATION OF RESULTS BASED ON QUESTIONNAIRE AND SD-BASED MODEL IN THE FOURTH YEAR
Score of variables in the fourth year Enablers Initial values of levels based on experts' opinion Level based on experts' opinion Results based on SD-based model % Deviation from SD-based model Delivery speed 5 20 20.57 2.9 Data accuracy 10 40 43.41 8.5 Centralized and collaborative planning 12 90 94.61 5.1
TABLE 3. (Continued)
Score of variables in the fourth year Enablers Initial values of levels based on experts' opinion Level based on experts' opinion Results based on SD-based model % Deviation from SD-based model Market sensitiveness 4 25 26.62 6.5 New product introduction 1 4 4.44 11.0 Process integration 10 60 66.02 10.0 Use of IT tools 8 48 38.72 –19.3 Total score of enablers 50 287 294.39 2.6 Results Cost minimization 4 17 17.04 0.2 Customer satisfaction 7 16 17.06 6.6 Lead time reduction 15 60 57.98 –3.4 Quality improvement 10 40 37.9 -5.3 Service level improvement 14 60 51.72 –13.8 Total score of results 50 193 181.7 –5.9 Inhibitors Lack of trust 18 17 15.69 7.7 Uncertainty 51 48 46.65 2.8 Resistance to change 31 29 27.02 6.8 Total score of inhibitors 100 94 89.36 4.9 SP Index 0 386 386.73 0.2 DISCUSSION
The results of the SD simulation show that the SP Index improves with the increasing the influence of market sensitiveness, data accuracy, delivery speed, new product introduction, centralized and collaborative planning, process integration and use of IT tools. The advantages of using simulation to validate the
proposed model are to test different values and obtain different scenarios. The management group can easily predict the behavior of the decision and policy for SCP. One of the main purposes of SD is to model the ways in which its information, action and consequences components interact to generate dynamic behavior. Hence it can diagnose the causes of faulty behavior and tune its feedback loops to obtain better behavior. The relationship among enablers, results, inhibitors and SP Index is illustrated in Figure 3. From the graph, it has been observed that the SP Index, enablers and results of the SC initially improves during first and third year. This improvement is as a result of company policy towards SC integration. In integrated SC all trading partners work with common goal (Christopher, 2000) and interact with each other. Increase interaction among them reduces the influence of inhibitors like lack of trust and uncertainty. Trading partners are involved at planning stage of product development. There is increase in centralized and collaborative planning and use of IT tools. Clear picture of customer demand is available to all trading partner therefore they act on the same data set. These in turn enhance the market sensitiveness and delivery speed, which results into reduction in lead-time, improvement in service level and customer satisfaction. During third and fifth year rate of improvement in enablers and result is slower than previous years. This retardation in improvement is due to arrival of new competitors and enhanced desired value of customer satisfaction. During sixth and tenth year the rate of improvement in the values of enablers, results and SP Index get stabilized which indicates that the case SC should review its SC policy to meet the customer satisfaction level in the future. The values of inhibitors reduce during first and seventh year and then get stabilized. As desired values of results increase, impact of enablers reduces and does not minimize the impact of inhibitors. Relationship among result variables for improving SP Index is illustrated in Figure 3. The graph provides an observation that with desired value of results and enablers improve during first and fifth year. Beyond fifth year all the results values get stabilized. Results variables like service level improvement and lead-time reduction attain their desired value. Lead-time reduction indicates the minimization of all types waste including wastage in time. Lead-time reduction improves the service level. Desired value of cost minimization could not be achieved within 10 years because of increase in expenditure towards technology up-gradation to meet the desired value of quality and customer satisfaction. Similarly desired value of customer satisfaction could not be achieved because of unpredictable nature of customers. Figures 4 and 5 provide relationships among enablers. Rate of improvement in enablers is fast during first and third year. This is due to impact of SC integration (Towill, 1997), which in result minimizes the influence of uncertainty, lack of trust and resistance to change. The values of enablers except new product introduction, get stabilized after fourth year, which recommends review of existing SC policy and up-gradation of obsolete technology. Gap in customer satisfaction increases as desired customer satisfaction improves.
Increase in gap in customer satisfaction results in improvement in new product introduction.
Limitations of the Present Work
For the proposed SD model, 15 SCP variables are identified to develop a SD model. These performance variables are intangible in nature and the experts' help have been sought to quantify the variables. These values may differ from case to case. Result from SD model based on more number of variables can be more helpful in precisely formulating policy towards SCP improvement.
CONCLUSION
The understanding of dynamic behavior of variables is important to analyze its impact on SCP. These variables have causal relationships among themselves. One of the variables, data accuracy would affected by other variables such as use of IT tools, centralized and collaborative planning, process integration, minimizing uncertainty, reducing resistance to change, and development of trust. However, it helps in quickly responding to the market demand. Strategy to cope up with resistance to change among trading partners helps to improve market sensitiveness, which improves SCP. Ability to introduce new product in the market is governed by capability to visualize and manage the uncertainties. Uncertainty could be better managed if SC has centralized and collaborative planning which need to be supported by the effective use of IT tools. Trust among trading partners could be developed by process integration and centralized and collaborative planning. Trust development among trading partners helps to generate reliable data at each stage of the SC.
Lead-time reduction is considered as one of the most important variables for improving SCP. Lead-time reduction helps to make delivery fast, which further improves service level. New product introduction and service level improvement enhance the customer satisfaction level. Increase customer satisfaction level would help to improve the market share of SC business. Lead-time reduction would also help to improve quality level by reducing different types of waste. Customer satisfaction improves with better quality level. Quality improvement is captured in the present model by considering the customer satisfaction level, which is also necessary to gain market share. SD-based model developed in this paper acts as a tool for top management to understand the behavior of variables of a SC. Though SD-based model is developed on the basis of opinion of experts of a case SC, the results are quite generic and helpful for the top management to drive the efforts towards improving SCP. SD-based model developed in this paper is specific to the auto-sector and may differ slightly if one models it for
other sectors such as FMCG or consumer durables goods. According to Lalonde and Masters (1994), a SC can only succeed if all the members of the SC have the same goal and the same focus of serving customers. Establishing the same goal and the same focus among SC members is a form of policy integration. For improving performance, trading partners of the chain should share their information and assist each other in their strategic planning to achieve the desired business goal. Therefore, proposed SD model helps management to understand the implication of interdependence of performance variables on SCP, which is the goal of every member in the SC. The model focuses on creating value for the ultimate customer through improving integration between trading partners and enhancing the responsiveness capability. However, nothing substantial can emerge if the actions are not effectively implemented.
REFERENCES
Agarwal, A., and Shankar, R. (2002a). Analyzing alternatives for improvement in supply chain performance. Work-Study,51(1), 32–37.
. (2002b), Modeling integration and responsiveness on a supply chain performance: A system dynamics approach. International Journal System Dynamics and Policy-Making,14(1&2), 61–83.
. (2003). On-line trust building in e-enabled supply chain. Supply Chain Management: An International Journal,8(4), 324–334.
Angerhofer, B. J., and Angelides, M. C. (2000). System dynamics modeling in supply chain management: Research review. In Joines, J. A., Barton, R. R., Kang, K., and Fishwick, P. A. (Eds.). Proceedings of the 2000 Winter Simulation Conference, Wyndham Palace Resort & Spa, Orlando, FL, USA, December 10–13,342–351.
Beamon, B. M. (1998). Supply chain design and analysis: Models and methods.
International Journal of Production Economics,55(3), 281–294.
. (1999). Measuring supply chain performance. International Journal of Operations and Production Management, 19(3), 275–292.
Brewer, P. C., and Speh, T. H. (2000). Using the balanced scorecard to measure supply chain performance. Journal of Business Logistics,21(1), 75–93. Christopher, M. (2000). The agile supply chain, competing in volatile markets.
Christopher, M., and Towill, D. (2001). An integrated model for the design of agile supply chains. International Journal of Physical Distribution and Logistics, 31(4), 235–246.
De Souza, R., Zice, S., and Chaoyang, L. (2000). Supply chain dynamics and optimization. Integrated Manufacturing Systems,11(5), 348–364.
Fawcett, and Magnan. (2002). Achieving world-class supply chain alignment: Benefits, barriers, and bridges. Retrieved January 14, 2003, from http://www .capsresearch.org
Forrester, J. W. (1961). Industrial dynamics. Cambridge, Mass.: MIT Press. Goodman, M. R. (1983). Study notes in system dynamics. Cambridge, Mass.:
MIT Press.
Gunasekaran, A., Patel, C., and Tirtiroglu, E. (2001). Performance measures and metrics in a supply chain environment. International Journal of Operations and Production Management,21(1/2), 71–87.
Hafeez, K., Griffiths, M., Griffiths, J., and Naim, M. M. (1996). Systems design of a two-echelon steel industry supply chain. International Journal of Production Economics, 45(1–3), 121–130.
Harland, C. M. (1996). Supply chain management: Relationships, chains and networks. British Journal of Management,7, s63–s80.
Handfield, R. B., and Bechtel, C. (2002). The role of trust and relationship structure in improving supply chain responsiveness. Industrial Marketing Management, 31, 367–382.
Holmberg, S. (2000). A systems perspective on supply chain measurements.
International Journal of Physical Distribution and Logistics Management, 30(10), 847–868.
Jayaram, J., Vickery, S. K., and Droge, C. (1999). An empirical study of time-based competition in the North America automotive supplier industry.
International Journal of Operations and Production Management, 19(10),
1010–1033.
Lai, C. L., Ip, W. H., and Lee, W. B. (2001). The system dynamics model for engineering services. Managing Service Quality, 11(3), 191–199.
Lee, H. L., and Billington, C. (1992). Managing supply chain inventory: Pitfalls and opportunities. Sloan Management Review, 33(3), 65–73.
Mohapatra, P. K. J., Mandal, P., and Bora, M. C. (1994). Introduction to system dynamics modeling. India: University Press.
Mason-Jones, R., Naylor, B., and Towill, D. R. (2000). Engineering the le-agile supply chain. International Journal of Agile Management Systems, 2(1), 54–61.
Narasimhan, R., and Jayaram, J. (1998). Causal linkage in supply chain management: An exploratory study of North American manufacturing firms.
Decision Science, 29(3), 579–605.
Naylor, J. B., Naim, M. M., and Berry, D. (1999). Leagility: Integrating the lean and agile manufacturing paradigms in the total supply chain. International Journal of Production Economics, 62, 107–118.
Neely, A., Gregory, M., and Platts, K. (1995). Performance measurement design.
International Journal of Operations and Production Management, 15(4), 80–116.
New, S. J. (1996). A framework for analyzing supply chain improvement.
International Journal of Operations and Production Management, 16(4), 19–34.
Persson, F., and Olhager, J. (2002). Performance simulation of supply chain designs. International Journal of Production Economics, 77, 231–245.
Power, D. J., Sohal, A. S., and Rahman, S. (2001). Critical success factors in agile supply chain management: An empirical study. International Journal of Physical Distribution and Logistics, 31(4), 247–265.
Prater, E., Biehl, M., and Smith, M. A. (2001). International supply chain agility tradeoffs between flexibility and uncertainty. International Journal of Operations and Production Research, 21(5/6), 823–839.
Shah, J., and Singh, N. (2001). Benchmarking internal supply chain performance: Development of a framework. Journal of Supply Chain Management, 37(1),
Spekman, R. E., Kamauff, J. W. Jr., and Myhr, N. (1998). An empirical investigation into supply chain management: A perspective on partnerships.
Supply Chain Management, 3(2), 53–67.
Stevens, G. (1989). Integrating the supply chain. International Journal of Physical Distribution and Materials Management, 19(1), 3–8.
Stevens, G. C. (1990). Successful supply chain management. Management Decision, 28(8), 25–30.
Swaminathan, J. M., Smith, S. F., and Sadeh, N. M. (1998). Modeling supply chain dynamics: A multi-agent approach. Decision Science, 29(3), 607–631. Stewart, G. (1997). Supply-chain operations reference model (SCOR): The first
cross-industry framework for integrated supply-chain management. Logistics Information Management, 10(2), 62–67.
Towill, D. R. (1996). Industrial dynamics modeling of supply chain. Logistics Information Management, 9(4), 43–56.
. (1997). The seamless supply chain – The predator's strategic advantage.
International Journal of Technology Management, 9(6), 41–53.
Wikner, J., Towill, D. R., and Naim, M. M. (1991). Smoothing supply chain dynamics.International Journal of Production Economics, 22(3), 231–248. van Hoek, R. I. (1998). Measuring the unmeasurable – Measuring and improving
performance in the supply chain. Supply Chain Management, 3(4), 187–192. Yu, Z., Yan, H., and Edwin Cheng, T. C. (2001). Benefits of information sharing
with supply chain partnerships. Industrial Management and Data Systems, 101(3), 114–119.