Policy Research Working Paper
5201
What Are the Links between Aid Volatility
and Growth?
Anil Markandya
Vladimir Ponczek
Soonhwa Yi
The World Bank
IDA Resource Mobilization Department
February 2010
WPS5201
Public Disclosure Authorized
Public Disclosure Authorized
Public Disclosure Authorized
Produced by the Research Support Team
Abstract
The Policy Research Working Paper Series disseminates the findings of work in progress to encourage the exchange of ideas about development issues. An objective of the series is to get the findings out quickly, even if the presentations are less than fully polished. The papers carry the names of the authors and should be cited accordingly. The findings, interpretations, and conclusions expressed in this paper are entirely those of the authors. They do not necessarily represent the views of the International Bank for Reconstruction and Development/World Bank and its affiliated organizations, or those of the Executive Directors of the World Bank or the governments they represent.
This paper adds to aid volatility literature in three ways: First it tests the validity of the aid volatility and growth relationship from various aspects: across different time horizons, by sources of aid, and by aid volatility interactions with country characteristics. Second, it investigates the relationship by the level of aid absorption and spending. Third, when examining the relationship between International Development Association aid volatility and growth, it isolates International Development Association aid volatility due to the recipient country’s performance from that due to other sources. The findings suggest that, in the long run, on average, aid volatility is negatively correlated with real economic growth. But the relationship is not even. It is stronger for Sub-Saharan African countries than for other regions and it is not present in middle-income countries
This paper—a product of the IDA Resource Mobilization Department—is part of a larger effort in the department to enhance understandings on aid effectiveness. Policy Research Working Papers are also posted on the Web at http://econ. worldbank.org. The author may be contacted at [email protected].
or countries with strong institutions. For economies where aid is fully absorbed, aid volatility matters for long-run growth; economies with full aid spending also bear a negative impact of aid volatility on long-run growth. Where aid is not fully absorbed, or where it is not fully spent, the aid volatility relationship is not significant. Looking at International Development Association aid separately, the volatility arising from the recipient country’s International Development Association performance does not have a causal relationship with growth. In policy terms, the results suggest that low- income countries with weak institutions, especially in Sub-Saharan Africa, could benefit from reduced aid volatility or from being better prepared for the volatility that is there.
What Are the Links between Aid Volatility and Growth?
Anil Markandya, Vladimir Ponczek and Soonhwa Yi†
Key words: Aid, volatility, growth, IDA JEL Classification: 01, 040, F35, O19. Word Count: 8,248
†
Markandya: University of Bath, UK and Basque Centre for Climate Change, Spain; Ponczek: São Paulo School of Economics – Getulio Vargas Foundation; and Yi: The World Bank. The findings, interpretations, and conclusions expressed herein are entirely those of the authors, and do not necessarily reflect the views of the World Bank, its Executive Directors, or the countries they represent. We thank Arvind Subramanian for kindly sharing his dataset; and Norman Loayza and Brian Pinto for their comments. A version of this paper was presented at the UNU-Wider Conference on Aid: Policies, Principles and Performance in Helsinki in June 2006 where useful comments were also received from the participants. All errors are the responsibility of the authors.
What Are the Links between Aid Volatility and Growth?
I. Introduction
Aid volatility is a factor of interest, not only because of its effects on economic growth, but in its own right. Large fluctuations in aid inflows can result in instability of employment, changes in government budgets and uncertainty about the degree to which resources will be utilized in the future. All this has welfare consequences. Hence it is important to understand what (if any) are the costs of such volatility.
Aid can be very volatile; it is generally more volatile than many other capital flows or government tax receipts. Bulir and Hamann (2003) find that aid inflows are more volatile than domestic revenues, corroborated by their subsequent study (2008b) as well as Hudson and Mosley (2006). In the similar vein, Pallage and Robe (2001) find that aid is twice as volatile as real output. Whether or not such aid flows are pro- or anti- cyclical, however, remains controversial: Bulir and Hamann (2003) find that aid tends to move in the same direction as GDP and revenues, while Pallage and Robe (2001) show that for African countries aid is procyclical differently from recipients outside Africa.1
The causes of aid volatility vary. IMF (2005) finds that aid can be volatile for good reasons, e.g. when responding to exogenous shocks, such as terms of trade or natural disasters. This is especially the case for low-income countries that are disproportionately prone to exogenous shocks. For example, aid inflows sharply increased to Mozambique in response to floods in early 2000 and to Ethiopia in response to drought in 2002. Volatility may also reflect a recipient country’s political status as well as its governance and macroeconomic
performance, which are to some extent endogenous to the recipient country’s actions (see Appendix I). Here the consequences are less obviously positive. Finally volatility can also be a manifestation of budget cycles in donor economies, which is clearly not desirable from the recipients’ perspective.
Recently studies have shed light on the macroeconomic impact of aid volatility but the views diverge. Arellano et al (2005) suggest that a one-standard-deviation increase in aid volatility is associated with a decrease in manufactured good exports by up to four percentage points. Celasun and Walliser (2005) find that unpredicted aid volatility may result in permanent costs in terms of lost output. IMF (2003) and Guillaumont and Chauvet (2001), on the other hand, assert that aid influxes in response to exogenous shocks help cushion some of the adverse impact of the shocks. Prati and Tressel (2006) find that the impact of aid on exports varies by country circumstances. Aid flows during periods of adverse shocks or of reconstruction efforts subsequent to adverse shocks could have positive effects on exports. Lensink and Morrissey (2000) find that, controlling for aid instability, aid itself has positive impact on growth. Hudson and Mosley (2008a) show that aid volatility reduces investment and government expenditure shares. Theoretically, Agenor and Aizenman (2007) develop a model which shows that high aid volatility can induce poverty traps and potentially aggravate the effects of macroeconomic shocks.
The paper adds to the literature on aid volatility in three ways. First, it tests the validity of the aid volatility and growth relationship. We examine the robustness of the relationship from various aspects: across time horizons (1960 through 2000 as well as 1990 through 2000),
3
sources of aid (The World Bank IDA - International Development Association, multilateral excluding IDA, and bilateral) 2, and aid volatility interactions with country characteristics. Second, the paper investigates if the impact of aid volatility varies by recipient countries’ monetary and fiscal policy decisions (aid absorption and aid spending). This is in recognition of findings that aid recipient countries can contain the presence of Dutch disease effects of aid by adjusting macroeconomic policies. Prati and Tressel (2006) find that “recipient
countries can smooth aid-driven fluctuations of the trade balance and support export levels by adjusting the net domestic assets of the central bank.” IMF (2005) notes, “where aid itself is highly volatile, some savings of aid in the form of reserve accumulation may be optimal,” (see also Bevan, 2005). Eifert and Gelb (2005) deem a foreign exchange reserve buffer equivalent to about 5 months of imports of most low income countries (LICs) adequate for the observed aid flows and volatility.3
Third, the paper looks at the impact of IDA volatility on growth. When examining the relationship, we isolate IDA volatility driven by an IDA recipient country’s performance from that arising from other sources. This is an attempt to dig deeper into the question of what types of aid volatility are generally bad. Some IDA donors at donors’ meetings in the past stressed that aid volatility that is endogenous to the recipient country’s socioeconomic performance is necessary and may even be desirable.
Our findings are as follows. In the long run, aid volatility is on average negatively correlated with economic growth. But this general statement masks a number of qualifications that are even more important. First the relationship is not equally important across all countries: it is notably stronger in the Sub-Saharan African countries than other regions. Second, when looking at the medium run the relationship is not as clearly negative. Third, when aid volatility is categorized by source of aid the relationship holds for multilateral aid but not for bilateral aid. Fourth the long run adverse impact of aid volatility on growth is not significant either for all countries with strong policies and institutions or for middle-income countries. The impact of aid volatility on growth can vary depending on the level of aid absorption and spending. For economies where aid is fully absorbed, aid volatility matters for long-run growth. On the other hand, for those economies with low absorption of aid, the relationship matters not only in the long run but also in the medium run. In economies with full aid spending, aid volatility appears to lead to a negative impact on long run growth, while in those with low spending, the relationship is negligible.
In terms of IDA’s aid, the volatility arising from the recipient country’s IDA performance does not have a negative causal relationship with economic growth. However, we find that the volatility from other sources can bear negatively on real economic growth in IDA member countries in the medium term. The long run impact is not investigated due to the lack of data availability.
This paper is organized as follows: Section II spells out the methodology employed; Section III reports the basic results; Section IV investigates variation of aid volatility impact on growth by aid absorption or spending; Section V explores the relationship between volatility
2
Fieldings and Mavrotas (2008) show the importance of disaggregating aid when modeling the volatility of aid inflows.
3 See Eifert and Gelb (2005) for further discussion on a mechanism for managing exogenous volatility of aid
and aid as provided through IDA; Section VI revisits the aid volatility-growth nexus using two-stage least squares with the two-step efficient generalized method of moments; and Section VII concludes.
II. Empirical Methodology
Our analysis follows growth literature in the choice of the dependent and explanatory variables adding an aid volatility measure. To evaluate the link between aid volatility and economic growth over the period 1960-2000, we estimate the following equation based on cross-sectional ordinary least squares (OLS) with heteroskedastic-consistent standard errors:
i i i
i volatility X
y =α +β1 +β2 +ε (1)
where y is the average growth rate of real GDP per capita during the period; volatility is standard deviation of the aid-to-GDP ratio for the given period; X is a set of control variables; and i is the country index.
We use data for 95 developing countries over the 1960-2000 period. All variables are averaged over the five time horizons: the 1960-2000, the 1960-1980, the 1970-2000, the 1980-2000, and the 1990-2000 periods. A la Rajan and Subramanian (2005), such time specifications are to cover the long run (30 to 40-year horizons) as well as the medium terms (10 and 20-year) and to grasp a sense of the impact of aid volatility over time.
The control variables we include are as follows:
• Initial real GDP per capita to control for convergence process (Hall and Jones, 1999; Bosworth and Collins, 2003; and Hnatovska and Loayza, 2004);
• Gross capital formation as a share of GDP to capture capital accumulation, including capital accumulated from aid inflows (Barro and Sala-i-Matin, 1995)4
• Inflation rate (annual % change of consumer prices) to measure the effect of macroeconomic policies (Bosworth and Collins, 2003);
;
• Initial period life expectancy at birth to measure initial health conditions (Bosworth and Collins, 2003);
• Average growth, and volatility, of terms of trade to capture external shocks (Rajan and Subramanian, 2005);
• Quality of trade policies (Sachs and Warner index updated by Wacziarg and Welch, 2003);
• Major political instability (measured by the number of revolutions) to control variability of growth as well as aid inflows (World Bank, 2004)5
4 Gross capital formation consists of outlays on additions to the fixed assets of the economy plus net changes in
the level of inventories. Fixed assets include land improvements (fences, ditches, drains, and so on); plant, machinery, and equipment purchases; and the construction of roads, railways, and the like, including schools, offices, hospitals, private residential dwellings, and commercial and industrial buildings. Inventories are stocks of goods held by firms to meet temporary or unexpected fluctuations in production or sales, and "work in progress." (WDI, 2006).
; and
5
We do not control geography, as the channels through which geography relates to growth are part of on-going debate. For instance, Easterly and Levine (2003) find evidence that geography impacts on growth only through institutions, while Gallup et al (1999) show that geography significantly influences growth in GDP per capita from 1965 to 1990.
5
• Regional dummies – Sub-Saharan Africa and East Asia Pacific.
We estimate the relationship based on cross-sectional ordinary least squares (OLS)
regressions. Following Burnside and Dollar (2000), we drop outliers in all our cross-section specifications. We follow the Hadi (1992) procedure to identify and eliminate the outliers for each time horizon.6 Estimates with an exclusion of outliers are justified on the grounds that such outliers bias cross-country regressions (Easterly, 2004).
Using OLS estimations, we look further into the aid volatility and growth relationship by type of donor. We broadly categorize donors into three: IDA (the World Bank’s concessional window), multilateral donors excluding IDA (ML), and bilateral donors (BL). The regression model is the same as equation (1) but the volatility variable is replaced by standard deviation of the IDA-to-GDP, the ML-to-GDP or the BL-to-GDP ratio over the five time horizons. We then extend our regression analysis to categorical interactions between aid volatility and country characteristics in growth regressions. The objective is to examine if the magnitude and statistical significance of the aid volatility and growth relationship varies by such characteristics as income and institutions. The regression model is
i i i
i i
i volatility volatility characteristics X
y =α +β1 +β2 ∗ +β3 +ε (2)
where characteristics are income and institutional development. We group countries by the cross-country ranking for each characteristic: low, medium, and high.
The paper further expands the categorical interactions to the level of macroeconomic policy decisions in aid recipient countries, namely to the full or the low level of aid absorption and aid spending. Section IV discusses how we approximate the level of aid absorption and spending in an economy and shows how the impact of aid volatility on growth differs by macroeconomic policy condition.
We then further drill down on IDA volatility as IDA is a major aid provider to many low-income countries. We examine how IDA’s volatility related to performance (“good volatility”) relates to growth. Section V lays out the methodology and presents results. Finally we attempt to take into account the possibility that volatility could be endogenous to growth, using two-stage least squares (IV) with the two-step efficient generalized method of moments (GMM). 7 The IV procedure is to isolate exogenous changes in aid volatility and therefore gauge their causal impact on growth of real GDP per capita. The GMM makes it that variables measured with error tend to have bias toward zero (Wooldridge, 2001). The regression equation is i i i i i i i IV volatility X volatility y µ γ ε β β α + = + + + = 1 2 (3)
6 The Hadi procedure “measures the distance of data points from the main body of data and then iteratively
reduces the sample to exclude distant data points” (Easterly et al, 2004, p. 2).
7
Furthermore, we would like to note that we do not conduct a pooled GMM regression exercise because of a limited sample size. As Hayashi (2000) highlights, efficient GMM requires a very large sample size.
IV refers to a set of instrumental variables for aid volatility. The choice of instrumental variables is based on aid literature: the standard deviation of institution quality to capture changes in aid allocations and the standard deviation of terms of trade to capture shocks as well as the average of the investment-to-GDP ratio as in Arellano et al. (2005). The level of institutional quality is proxied by indexes of the International Country Risk Guide: a
country’s rating is the sum of five ratings – (i) Government stability, (ii) Investment profile, (iii) Corruption, (iv) Law and order, and (v) Bureaucracy quality. Given the ratings are already weighted, we do not normalize the ratings. The higher the rating total the better the institutional quality. The maximum point is 40.
III. Aid Volatility and Growth: OLS Estimation
In this section, we look into the cross-country evidence on the aid volatility and growth relationship. We investigate whether the relationship varies across time horizons, sources of aid, and categorical interactions with country characteristics.
1. Basic results
Aid volatility tends to be higher in the long run than in the medium run. As Appendix Table A.1 shows the standard deviation of the aid-to-GDP ratio is about 4.3 during 1960-2000 and 1970-2000 periods. In the medium term, it is 3.7 in 1980-2000 period, and as low as 1.7 during the 1960-1980 period.
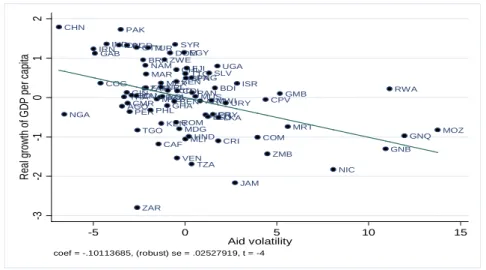
The OLS regression results in Table 1A and B indicate that aid volatility is negatively and statistically significantly associated with the real GDP per capita growth in 1960-2000, 1970-2000 and 1980-1970-2000 time horizons. The partial correlation between aid and volatility is given in Figure 1. A substantial fraction of the variation in growth is explained by our core specifications, with R-squared greater in longer time horizons (71 and 67 percent respectively in 1960-2000 and 1970-2000 periods). The coefficient on the aid volatility is negative in all time periods except the 1990-2000 period and statistically insignificant in the two periods - 1960-2000 and 1990-2000.8
Table 1A: Aid volatility and average real GDP per capita growth in the long run: OLS estimation
1960-2000 1960-2000 1960-2000 1970-2000 1970-2000 1970-2000
(1) (2) (3) (4) (5) (6)
Aid volatility -0.101 -0.11 -0.085 -0.086 -0.095 -0.072 (4.00)*** (4.48)** (3.19)** (2.64)** (2.90)** (1.95) Initial GDP per capita -1.045 -0.979 -1.083 -1.425 -1.353 -1.453 (6.11)*** (5.26)** (6.43)** (6.95)*** (6.34)** (6.74)** Gross capital formation 0.136 0.136 0.119 0.123 0.119 0.105
(7.44)*** (7.90)** (6.09)** (5.89)*** (6.26)** (4.36)**
Inflation (percent) -0.002 -0.002
(1.72) (2.09)*
Initial life expectancy 0.057 0.052 0.042 0.081 0.079 0.054 (4.57)*** (3.64)** (3.08)** (4.83)*** (4.44)** (2.84)** Average growth of terms of trade 0.013 0.013 0.013 0.024 0.024 0.024
(1.81)* (1.84) (1.93) (2.27)** (2.31)* (2.31)*
8 When retaining outliers in our sample, the coefficient of aid volatility is statistically significant only for the
7
Standard deviation of growth of terms of trade -0.017 -0.018 -0.015 -0.034 -0.034 -0.032 (2.16)** (2.21)* (2.00)* (2.98)*** (2.99)** (2.65)** Trade policy 1.804 1.751 1.623 2.204 2.061 2.129 (4.19)*** (4.27)** (3.77)** (4.46)*** (4.39)** (4.06)** Number of revolutions -0.769 -0.202 -1.093 -0.532 -0.017 -0.944 (1.59) (0.37) (2.25)* (1.22) (0.03) (2.20)* Sub-Saharan Africa -0.727 -0.99 (2.69)** (2.48)*
East Asia Pacific 0.206 0.112
(0.77) (0.34)
Constant 2.658 2.415 4.309 2.951 2.609 5.319 (1.71)* (1.61) (2.95)** (1.63) (1.60) (2.75)**
Observations 78 75 78 82 78 82
R-squared 0.71 0.74 0.74 0.67 0.7 0.7
Note: All standard errors are robust - Huber/White/sandwich estimator of variance is used in place of the traditional calculation. Figures in parenthesis refer to t-statistics. *** significance at the 1% level, ** significance at the 5% level; and * significance at the 10% level.
Figure 1. Partial correlation between aid volatility and growth, 1960-2000
The inflation rate, a macroeconomic policy variable, enters marginal in explaining growth – coefficient of -0.002 ~3 across different time horizons (Table 1A column (2) and (5) and Table 1b column (2), (5) and (8)). After controlling for regional effects using dummy variables, aid volatility enters significantly only for periods 1960-2000 and 1970-2000. The results show that aid volatility matters for real growth in the Sub-Saharan Africa region but not in the East-Asia Pacific region (Table 1A column (3) and (6) and Table 1B column (3), (6), and (9)).
How important is aid volatility in determining real economic growth in our regressions? As in Arellano et al. (2005), we estimate the quantitative contribution of aid volatility as a product
CHN NGA IRNGAB COG INDIDN PAK AGO THAGIN BGD CMR PER ECUCIV GTM ZAR TGO BRA ZAF NAM ETH MAR TUR PHL MYS CAF DZA MEX NPL KEN BOL ZWE GHA TCD DOM BEN SYR ROM CHL SEN VEN COL MDG EGY MLI TTO BFA FJI HND PNG TZA PANMUS ARG NERLSO SLV MWI PRY BDI UGA CRI LKA URY JAM ISR COM CPV ZMB GMB MRT NIC GNB RWA GNQ MOZ -3 -2 -1 0 1 2 R ea l gr owt h of G DP pe r c api ta -5 0 5 10 15 Aid volatility coef = -.10113685, (robust) se = .02527919, t = -4
of the coefficient of the aid volatility variable and its standard deviation above and below the mean. Table 2 displays that an increase of aid volatility by one standard deviation is
estimated to reduce the real GDP growth rate as much as nearly two percentage points in the medium and the long run: if the 1960-2000 aid-to-GDP ratio is one standard deviation above its mean, the real GDP per capita growth rate is associated with a decrease by 2.12 percentage points.
Table 2. How important is aid volatility in real GDP per capita growth?
Change in real per capita GDP growth for a one SD increase in volatility
Period Lower bound Upper bound
1960-2000 -0.01 -2.12 1960-1980 0.00 -0.38 1970-2000 0.00 -1.80 1980-2000 0.00 -2.01 1990-2000 0.00 0.42 Sub-Saharan Africa 1960-2000 0.00 2.14
Table 1B: Aid volatility and average real GDP per capita growth in the medium run: OLS estimation
1960-1980 1960-1980 1960-1980 1980-2000 1980-2000 1980-2000 1990-2000 1990-2000 1990-2000
(1) (2) (3) (4) (5) (6) (7) (8) (9)
Aid volatility -0.065 -0.003 -0.058 -0.1 -0.111 -0.084 0.03 0.007 0.04 (0.98) (0.03) (0.83) (2.03)** (2.23)* (1.62) (0.46) (0.11) (0.66) Initial GDP per capita -1.216 -1.213 -1.217 -1.188 -1.237 -1.196 -0.814 -0.992 -0.704 (3.38)*** (2.42)* (3.26)** (3.25)*** (3.68)** (3.26)** (1.41) (2.09)* (1.23) Gross capital formation 0.137 0.138 0.135 0.132 0.123 0.117 0.155 0.131 0.136 (4.60)*** (3.82)** (4.03)** (5.54)*** (5.60)** (4.61)** (3.58)*** (2.99)** (3.89)**
Inflation (percent) 0.002 -0.002 -0.003
(0.21) (3.07)** (5.60)**
Initial life expectancy 0.092 0.08 0.079 0.076 0.081 0.052 0.05 0.068 -0.013 (3.47)*** (2.78)** (2.69)** (3.12)*** (3.12)** (1.63) (1.08) (1.64) (0.23) Average growth of terms of trade 0.009 0.012 0.009 0.01 0.014 0.011 0.012 -0.001 0.013 (1.61) (2.16)* (1.63) (0.61) (0.77) (0.68) (0.30) (0.04) (0.33) Standard deviation of growth of terms of trade -0.017 -0.007 -0.015 -0.02 -0.024 -0.019 -0.157 -0.155 -0.159 (1.74)* (0.94) (1.41) (0.98) (1.13) (0.92) (4.23)*** (4.17)** (4.42)** Trade policy 1.679 1.803 1.543 1.554 1.412 1.566 1.24 0.733 1.276 (2.15)** (2.18)* (2.09)* (2.69)*** (2.47)* (2.69)** (1.75)* (1.21) (1.86) Number of revolutions -0.194 -0.394 -0.28 -0.245 0.08 -0.604 -1.105 -0.413 -1.475 (0.20) (0.36) (0.30) (0.45) (0.13) (1.06) (2.00)** (0.76) (2.32)* Sub-Saharan Africa -0.46 -0.791 -1.453 (1.12) (1.26) (1.99)*
East Asia Pacific 0.125 0.265 0.938
(0.27) (0.66) (1.58)
Constant 3.304 3.304 4.115 1.893 2.051 3.857 0.56 3.148 4.36 (1.51) (1.16) (1.74) (0.70) (0.79) (1.27) (0.13) (0.81) (0.99)
Observations 65 52 65 86 82 86 95 91 95
R-squared 0.52 0.53 0.54 0.49 0.55 0.51 0.5 0.59 0.53
Note: All standard errors are robust - Huber/White/sandwich estimator of variance is used in place of the traditional calculation. Figures in parenthesis refer to t-statistics. *** significance at the 1% level, ** significance at the 5% level; and * significance at the 10% level.
context the magnitude of the impact is relatively modest – a one percent increase in aid volatility, for example would cause a 0.02-0.03 percent decrease in economic growth.
2. Sources of aid
In the spirit of Clemens et al (2004) and Rajan and Subramanian (2005), we distinguish the impact of different sources of aid volatility. We disaggregate aid by type of donor: IDA, multilateral excluding IDA, and bilateral. The reason behind separating IDA from other multilateral aid is that in some countries IDA is a major aid provider. Table A1 provides the summary statistics of aid by source. Bilateral aid is most volatile across different time horizons, while multilateral aid (excluding IDA) tends to be least volatile. IDA is least volatile only during the 1960-1980 period.
As for the volatility-growth link, we indeed find that multilateral aid volatility, including IDA, is negatively associated with both medium and long run economic growth, especially the 1960-2000 horizon, while bilateral aid volatility is significant only in the 1980-1960-2000 period at the 5 percent level (Tables 3A-C). Various arguments can be made as to why some categories but not others should affect long-run growth. Rajan and Subramanian (2005) notes that multilateral aid is less explicitly “political” than bilateral aid and should therefore have a different impact.
3. Interactions with country characteristics
Finding the results that continuous interactions of aid volatility with country characteristics are insignificant9, we allow non-monotonic effects through categorical interactions. The reasoning is that the continuous interactions may impose a monotonically invalid relationship between the aid volatility-growth link and a given characteristic.
Categorical interaction effects are measured through the coefficient on the multiplicative term between aid volatility and the binary variable that indicates each country’s grouping. Country characteristics of income as well as institutional quality are considered. For each characteristic, the sample is divided into three groups: low, medium and high. The groupings of income are as defined in Global Development Finance (2005): low refers to low income countries in the sample, medium to lower middle income countries, and high to upper middle income countries. The categories of institutional quality are derived from the cross-country ranking: weak
corresponds to the 25th percentile, strong to the 75 percentile of the institution index. The index is a measure of institutional quality used in Bosworth and Collins (2003).
In terms of the level of income, aid volatility has a negative impact on long-run growth only in poor countries (Table 4 column 1). The coefficients of aid volatility for both middle and high-income category countries are negative but not different from zero. Hence it appears that for lower and upper middle income countries, the results negate the causal relationship between aid volatility and long-run growth. An explanation for these results could be that, as countries
11
develop, they have policies and means in place to neutralize the long-run effects of aid volatility on economic growth, a result also found in growth volatility literature (Fatás, 2002).
Regarding institutional quality (Table 4 column 2), our findings negate a significant relationship between aid volatility and growth for countries with strong institutions. The negative relationship between the two holds for countries with weak or medium quality of institutions. As explained above, it is likely that the higher the quality of institutions, the better volatility cushioning mechanisms are in place, reducing the long-run impact on economic development.
Table 3A. IDA volatility and average real GDP per capita 1960-2000 1960-1980 1970-2000 1980-2000 1990-2000 IDA-to-GDP volatility -0.798 -0.882 -0.757 -0.751 -0.269 (-5.14) (-0.700) (-2.910) (-2.240) (-0.380) *** *** ** Sub-Saharan Africa -0.587 -0.426 -0.868 -0.857 -1.192 (-2.33) (-0.97) (-2.14) (-1.33) (-1.16) ** ** East Asia 0.048 -0.183 0.040 0.057 0.398 (0.17) (-0.44) (0.12) (0.14) (0.78) Number of observations 76 61 79 83 88 Adjusted R-squared 0.78 0.47 0.72 0.50 0.45
Table 3B. Multilateral aid volatility and real GDP per capita growth
1960-2000 1960-1980 1970-2000 1980-2000 1990-2000 Multilateral aid volatility (excluding IDA) -0.546 -0.351 -0.462 -0.563 -0.154
(-3.64) (-2.100) (-2.090) (-1.630) (-0.270) *** ** ** Sub-Saharan Africa -0.877 -0.666 -1.144 -1.030 -1.269 (-3.04) (-1.38) (-2.77) (-1.59) (-1.4) *** *** East Asia 0.132 -0.054 0.017 0.124 0.410 (0.49) (-0.13) (0.05) (0.32) (0.78) Number of observations 76 56 79 83 88 Adjusted R-squared 0.74 0.49 0.68 0.49 0.45
Table 3C. Bilateral aid volatility and real GDP per capita growth
1960-2000 1960-1980 1970-2000 1980-2000 1990-2000 Bilateral aid volatility -0.164 -0.194 -0.168 -0.245 -0.144
(-1.95) (-1.150) (-1.520) (-2.120) (-0.950) * ** Sub-Saharan Africa -0.959 -0.644 -1.203 -1.146 -1.285 (-3.28) (-1.33) (-2.93) (-1.79) (-1.46) *** *** * East Asia 0.270 -0.036 0.031 0.093 0.399 (0.9) (-0.08) (0.08) (0.24) (0.76) Number of observations 75 59 79 83 88 Adjusted R-squared 0.71 0.49 0.68 0.50 0.45
Table 4. Aid volatility and average real GDP per capita growth: Categorical interaction, 1960-2000
Income (1) Institutional quality (2) (a) Aid volatility, low category -0.095 -0.091
(-2.810)*** (-2.310)** (b) Aid volatility, middle category -0.041 -0.083
(-0.620) (-2.270)** (c) Aid volatility, high category -0.046 -0.059
(-0.76) (-1.250) Sub-Saharan Africa -0.514 -0.566 (-1.75)* (-1.920)* East Asia 0.367 0.285 (1.15) (0.860) Number of observations 81 81 R-squared 0.7922 0.7873 Test (p-values)
H0: Coefficient for the (a) variable = coefficient of the (b) variable 0.0204 0.0361 H0: Coefficient for the (a) variable = coefficient of the (c) variable 0.0179 0.0439
Note for Table 3-4: All standard errors are robust - Huber/White/sandwich estimator of variance is used in place of the traditional calculation. Figures in parenthesis refer to t-statistics. *** significance at the 1% level, **
significance at the 5% level; and * significance at the 10% level.
IV. Aid Absorption or Spending and Growth
In this section we examine the aid volatility-growth link interacted with categories of
macroeconomic management of aid inflows: low absorption of aid inflows; high absorption; low aid spending; and high aid spending. This is to account for the macroeconomic impact of aid volatility depending on the policy responses to aid, especially the interaction of fiscal policy with monetary and exchange rate policy (IMF, 2005).
Monetary and fiscal policy responses to aid volatility can cause unplanned outcomes of such volatility. For instance Dutch disease can make an impact on long-run growth where the source of growth is the export sector. The transmission channel is thus: a temporary surge of aid inflows causes real exchange rate appreciation and therefore reallocate resources away from tradable sectors. Prati and Tressel (2006) find evidence for the presence of Dutch disease effects of aid in certain conditions.
Following Aiyar et al (2005) and IMF (2005), absorption is defined as the extent to which the non-aid current account deficit widens in response to an increase in aid inflows, i.e.
13
This measures to what extent “aid engenders a real transfer of resources through higher imports, or through a reduction in the domestic resources devoted to producing exports. Absorption depends on both exchange rate policy and on policies that influence the demand for imports. The central bank controls the exchange rate through its sales of foreign exchange, while monetary policy can be used to control aggregate demand and the demand for imports” (Aiyar et al 2005, pp. 28-29).
Spending is defined as the widening in the government fiscal deficit net of aid that accompanies an increment in aid:
Spending = ∆ (G-T)/ ∆ aid
where G is government expenditures and T is taxation. Spending captures “the extent to which the government uses aid to finance its increases in expenditures or a reduction in taxation. Even if the aid comes tied to particular expenditures, governments can choose whether or not to increase the overall fiscal deficit as aid increases. Analyzing spending is important because of the natural focus on the budget as a policy variable, and also because of the importance of tensions between the fiscal policy response to aid and broader macroeconomic objectives with respect to the exchange rare and inflation” (IMF 2005 p.10). IMF (2005) recognizes that these definitions of absorption and spending take into account the fungibility of aid.
Categories are determined by each country’s absorption/spending ratios. A low level of absorption or spending refers to cases where the ratio is below 20 percent while a high level
refers to cases where the ratio is above 80 percent. The results are intuitive. As for aid absorption (Table 5), there is a statistically significant
long-run link between aid volatility and growth in economies where aid inflows are highly absorbed (the 1960-2000 time horizon). On the other hand, the medium to short -term link is statistically significant in economies where aid inflows have low absorption (1990-2000 period). The coefficient test results indicate that the coefficients of aid volatility with aid highly absorbed are significantly different from those of aid volatility with aid at a low level of absorption for these two time horizons.
Table 5. Aid volatility and growth: Interactions with aid absorption 1960-2000 1960-1980 1970-2000 1980-2000 1990-2000 Aid volatility, aid not fully absorbed -0.066 -0.003 -0.078 -0.084 -0.378
(-1.9) (-0.020) (-1.810) (-1.320) (-3.520)
* * ***
Aid volatility, aid highly absorbed -0.090 -0.055 -0.075 -0.080 0.011 (-3.02) (-0.770) (-1.720) (-1.410) (0.180)
*** *
Number of observations 81 64 85 86 95
Adjusted R-squared 0.7875 0.6152 0.74 0.56 0.57
Test (p-values)
H0: Volatility coefficient for "aid not absorbed"
Note: All standard errors are robust - Huber/White/sandwich estimator of variance is used in place of the traditional calculation. Figures in parenthesis refer to t-statistics. *** significance at the 1% level, ** significance at the 5% level; and * significance at the 10% level.
When aid spending is considered as a country’s macroeconomic management of aid inflows (Table 6), the aid volatility-growth link is significant only for the country group with high spending: the volatility coefficient is significantly negative at the 1 percent significance level for the 1960-2000 and the 1970-2000 horizons and at the 10 percent level for the 1980-2000 time horizon. High spending means that the government increases expenditures in response to aid inflows. Hence a likely interpretation of these results is that countries with high aid spending would have fluctuations in spending and thereby would have implications on output.
Table 6. Aid volatility and growth: Interactions with aid spending 1960-2000 1960-1980 1970-2000 1980-2000 1990-2000 Aid volatility, aid not spent -0.074 0.041 -0.065 -0.045 0.001 (-1.53) (0.44) (-1) (-0.68) (0.01)
Aid volatility, aid fully spent -0.089 -0.074 -0.090 -0.097 -0.001 (-3.47) (-1.14) (-3.45) (-1.92) (-0.02)
*** *** *
Number of observations 78 63 82 86 95
Adjusted R-squared 0.69 0.5506 0.66 0.48 0.50
Test (p-values)
H0: Volatility coefficient for "aid not spent" =
volatility coefficient for "aid fully spent" 0.0038 0.3775 0.0041 0.1616 0.9996 Note: All standard errors are robust - Huber/White/sandwich estimator of variance is used in place of the traditional calculation. Figures in parenthesis refer to t-statistics. *** significance at the 1% level, ** significance at the 5% level; and * significance at the 10% level.
V. IDA Aid Volatility and Growth
How does IDA aid volatility affect growth? IDA allocations are based on a country’s
performance, measured by a rating of policy and institutional assessment (CPIA) together with a rating provided in the annual report on portfolio performance and a weight of the governance factor in the CPIA10. Performance-based IDA allocation has its justification in the theory of aid absorption: a country with a better quality of institution and policy better utilizes aid for
economic growth than others. That is, IDA aid variations are largely endogenous to a recipient country’s performance. In the system, however, there are some external events that weaken the performance-based IDA allocation system – such as addressing a post-conflict situations, natural disasters and hikes in oil prices.
10
The formulae used in the IDA allocation are as follows: IDA allocation=f(IDA Performance2, GNI per capita-.125, Population). IDA performance=(.8CPIA*.2ARPP)+governance factor.
15
In this section, we isolate IDA aid volatility due to variations in IDA performance from that arising from other noises. The isolation procedure is as follows: we regress IDA performance rating with respect to IDA aid volatility by country for the 1980-2000 period. The standard deviation of error terms resulting from the estimation captures the volatility of noises (or exogenous factors for an IDA allocation). This short period is due to the limited availability of IDA performance ratings.
(4)
where IDA aid volatility for country i is a quadratic function of IDA performance and others. A volatility of IDA performance for a country is the standard deviation of its performance during 1980-2000 and during 1990-2000.
This exercise offers us now two variables that approximate sources of IDA aid volatility: one is volatility due to IDA performance and the other is volatility due to other exogenous sources. Having these two volatility variables, we then test the association of these two types of volatility with economic growth, using OLS regressions. All growth control variables in equation (1) are the controls as well in equation (5).
i i i i
i IDA performance IDA exogenous X
y =α +β1 _ +β2 _ +γ +ε (5)
where IDA performance is the standard deviation of IDA performance by country and IDA_exogenous is the standard deviation of error terms of equation (4).
The results displayed in Table 7 indicate that the negative link between IDA volatility and growth holds only with IDA aid volatility originating in exogenous factors. The link is significant at the 1 percent significance level for both the 1980-2000 and the 1990-2000 time horizons. The coefficients of the IDA performance volatility are negative but are not statistically different from zero. The results suggest an economically meaningful impact of IDA. A one standard deviation of IDA’s exogenous volatility is associated with about 2 percent lower GDP per capita growth. This becomes even larger for the Sub-Saharan Africa region: nearly 4 percent for the 1980-2000 period.
Table 7. IDA performance volatility and real GDP per capita growth
1980-2000 1990-2000
IDA performance volatility -0.154 -0.194 (-0.08) (-1.150)
IDA exogenous volatility -1.809 -1.222 (-2.63)*** (-3.000)*** Sub-Saharan Africa -1.935 -0.644 (-2.24)** (-1.33) East Asia -0.268 -0.036 (-0.38) (-0.08) Number of observations 48 59 Adjusted R-squared 0.53 0.49 i i i IDA performance e IDA =α +β( _ )2+
Note: All standard errors are robust - Huber/White/sandwich estimator of variance is used in place of the traditional calculation. Figures in parenthesis refer to t-statistics. *** significance at the 1% level, ** significance at the 5% level; and * significance at the 10% level.
VI. Aid Volatility and Growth: IV estimation with GMM
Noting the limitations of the use of OLS regressions, such as measurement or endogeneity problems as well as problems of unobservable heterogeneity or omitted variables, we conduct IV estimation with generalized method of moments (GMM). We use the following three instruments for aid volatility: the standard deviation of institution quality and the standard deviation of terms of trade to capture shocks as well as, like in Arellano et al. (2005), the average of the investment-to-GDP ratio. The exclusion restrictions are that the instruments are orthogonal to εiin equation
(3). Under these assumptions, the parameters of interest are consistently estimated. Table 8 depicts the regression results.
Table 8: Aid volatility and average real GDP per capita growth: GMM estimation
1960-2000 1960-2000 1960-2000 1970-2000 1970-2000 1970-2000
(1) (2) (3) (4) (5) (6)
Aid volatility -0.092 -0.142 -0.007 -0.305 -0.472 -0.402 (0.140) (0.127) (0.171) (0.295) (0.389) (0.436) Initial GDP per capita -0.990*** -0.971*** -0.922*** -1.687*** -1.788*** -1.902** (0.223) (0.194) (0.285) (0.455) (0.558) (0.756) Gross capital formation 0.135*** 0.127*** 0.103*** 0.116** 0.093** 0.117** (0.027) (0.021) (0.029) (0.045) (0.047) (0.058) Inflation (percent) 0.056** 0.045* 0.034 0.050 0.025 -0.000 (0.024) (0.026) (0.022) (0.046) (0.064) (0.053) Initial life expectancy 0.006 0.008 0.004 0.016 0.024 0.020 (0.010) (0.008) (0.011) (0.014) (0.020) (0.017) Average growth of terms of trade 1.955*** 1.984*** 1.200 2.691*** 3.012* 3.082 (0.517) (0.508) (0.834) (1.001) (1.582) (1.887) Standard deviation of growth of terms of trade -0.686 -0.072 -1.423** -0.261 0.470 -0.359 (0.557) (0.601) (0.706) (0.688) (1.068) (1.280) Trade policy -0.002* -0.003** (0.001) (0.001) Number of revolutions -1.239** -1.084 (0.516) (0.879) Sub-Saharan Africa 0.413 -0.875 (0.570) (1.504)
East Asia Pacific 2.560 2.974 4.505** 7.305 9.441 11.872* (2.289) (1.809) (2.128) (5.675) (6.825) (7.021) Constant 2.658 2.415 4.309 2.951 2.609 5.319
(1.71)* -1.61 (2.95)** -1.63 -1.6 (2.75)**
Observations 78 75 78 82 78 82
R-squared 0.71 0.74 0.74 0.67 0.7 0.7
Note: All standard errors are robust - Huber/White/sandwich estimator of variance is used in place of the traditional calculation.
Excluded Instruments: the standard deviation of institution quality, the standard deviation of terms of trade to capture shocks, and the average of the investment-to-GDP ratio. Figures in parenthesis refer to t-statistics. *** significance at the 1% level, ** significance at the 5% level; and * significance at the 10% level.
17
Comparing the GMM and OLS results, one can notice that they point to same direction in the sense that aid volatility is malefic to growth. Although, the results are not statistically significant, the point estimated are not very different from those found in the OLS regressions, especially in the 1960-2000 sample. Since GMM estimators are less efficient than the OLS ones under the assumption of exogeneity of the regressors, we conclude that indeed there is a negative relationship between aid volatility and growth for the entire sample.
VII. Conclusions
The paper started out to see if there was a negative relationship between aid volatility and long-run economic growth. Although we found this negative relationship when looking at the dataset as a whole, the results are much more nuanced at a detailed level. The negative link is not present for middle income countries or countries with strong institutions. Nor is it present in countries where aid is not fully spent. Looking geographically, Sub-Saharan Africa appears to have a stronger negative relationship than other regions. Finally the link is ambiguous in the medium term as opposed to the long term.
In terms of donor groups, volatility in aid from bilateral donors does not seem to have a long run relationship with economic growth, while that from multilaterals does. It is not clear why this should be so and the results merit some further research.
On IDA, the findings are consistent: a negative link with long-run growth. The volatility of IDA disbursement is partly caused by the recipient country’s performance and partly by other factors. The study finds that IDA aid volatility caused by country performance does not have a causal relationship with growth while the residual IDA aid volatility does.
In policy terms the results suggest that low- income countries with weak institutions, especially in Sub-Saharan Africa, could benefit from reduced volatility of aid or from being better prepared for the volatility that is there. This could be achieved through the use of models that better predict aid flows, by maintaining larger reserves (possibly pooled) and by greater commitment by donors to reduce the gap between commitments and disbursements.
References
Aiyar, S. A. Berg and M. Hussain (2005), “The Macroeconomic Challenge of More Aid,”
Finance and Development, IMF (September): pp. 28-31.
Alesina, A., S. Ozler, N. Roubini and P. Swagel (1996), “Political Instability and Economic Growth,” Journal of Economic Growth, Vol. 1(2): pp. 189-213.
Arellano, C., A. Bulíř, T. Lane and L. Lipschitz (2005), “The Dynamic Implications of Foreign Aid and its Variability,” IMF Working Paper WP/05/119.
Barro, R. J., and X. Sala-i-Martin (1995), Economic Growth, McGraw-Hill, Inc.
Bevan, David (2005), “An Analytical Overview of Aid Absorption: Recognizing and Avoiding Macroeconomic Hazards,” prepared for Seminar on Foreign Aid and Macroeconomic Management, March 14-15.
Bosworth, B. and S. Collins (2003), “The Empirics of Growth: An Update,” Brookings papers on Economic Activity, Fall 4: pp.136-147.
Bulir, A. and A. J. Hamann (2003), “Aid Volatility: an Empirical Assessment”, IMF Staff Papers, Vol. 50 (1), IMF: Washington, DC.
____________ (2006), “Volatility of Development Aid: From the Frying Pan into the Fire?,” IMF Working Paper, WP/06/65, IMF: Washington, DC.
Burnside, C. and D. Dollar (2000), “Aid, Policies, and Growth,” American Economic Review, Vol. 90(4): pp. 847–868.
Celasun, O. and J. Walliser (2005), “Predictability of Budget Aid: Recent experiences”, paper presented at the World Bank Practitioners’ Forum on Budget Support, Cape Town, May 5-6. Clemens, M. A., S. Radelet and R. Bhavnani (2004), “Counting Chickens when
They Hatch: The Short Term Effect of Aid on Growth,” Working Paper No. 44, Center for Global Development: Washington, DC.
Collier, P. (1999), “Aid Dependency: A Critique”, Journal of African Economies, Vol. 8: pp. 528-545.
Easterly, W. (2004), “National Economic Policies and Economic Growth: A Reappraisal,” (forthcoming in Handbook of Economic Growth, P. Aghion and S. Durlauf eds., North-Holland: Elsevier, Amsterdam).
Easterly, W. and R. Levine (2003), “Tropics, germs, and crops: how endowments influence economic development,” Journal of Monetary Economics, Vol. 50: pp. 3–39.
19
Eifert, B. and A. Gelb (2005), “Improving the Dynamics of Aid: Towards More Predictable Budget Support,” Working Paper No. 3732, The World Bank: Washington, DC.
Fatás, A (2000), “Do Business Cycles Cast Long Shadows? Short-run Persistence and Economic Growth,” Journal of Economic Growth, Vol.5(2):pp. 147-162.
Fielding, D. and G. Mavrotas (2008), “Aid Volatility and Donor-Recipient Characteristics in Difficult Partnership Countries,” Economica, Vol. 75 (299).
Gallup, J. L., J. D. Sachs and A. Mellinger (1999), “Geography and Economic Development”, in
Annual World Bank Conference on Development Economics1998Proceedings, B. Pleskovic and J. E. Stiglitz eds., pp. 127–78, The World Bank: Washington, D.C.
Guillaumont, P. and L. Chauvet (2001), “Aid and Performance: A Reassessment,” Journal of Development Studies, Vol. 37 (August), No. 6: pp. 66-92.
Hauk Jr. W.R. and R. Wacziarg (2004), “A Monte Carlo Study of Growth Regressions”, mimeo, Stanford University.
Hayashi, F. (2000), Econometrics, Princeton University Press, Princeton: N.J.
Hnatkovska, V. and N. Loayza (2004), “Volatility and Growth,” in Managing Volatility and Crises: A Practitioner’s Guide, B. Pinto et al eds., The World Bank: Washington, D.C.
Hall, R. and C. Jones (1999), “Why do some countries produce so much more output than others?,” Quarterly Journal of Economics, 114, 83–116.
Hudson, J., and P. Mosley (2008a), “The Macroeconomic Impact of Aid Volatility,” Economics Letters, Vol. 99 (3).
____________ (2008b), “Aid Volatility, Policy and Development,” World Development, Vol. 36 (10).
IMF (2003), “Fund Assistance for Countries Facing Exogenous Shocks,” SM/03/288, IMF. IMF (2005), “The Macroeconomics of Managing Increased Aid Inflows: Experiences of Low-Income Countries and Policy Implications,” August 8.
Judson. R. and A. Orphanides (1996), “Inflation, Volatility and Growth,” Finance and Economics Discussion Series No. 19, Board of Governors of the Federal Reserve Bank: Washington DC.
Lensink, R. and O. Morrissey (2000), “Aid Instability as a Measure of Uncertainty and the Positive Impact of Aid on Growth,” Journal of Development Studies 36(3).
Markandya, A., V. Ponczek, and S. Yi (2006), “Does Aid Volatility Vary by Type of Donor?,” mimeo, the World Bank.
Pallage, S. and M. A. Robe (2001), “Foreign Aid and the Business Cycle,” Review of International Economics 9(4).
Prati, A. and T. Tressel (2006), “Aid Volatility and Dutch Disease: Is There a Role for Macroeconomic Policies?,” IMF: Washington D.C.
Rajan, R. and A. Subramanian (2005), “Aid and Growth: What Does the Cross-Country Evidence Really Show?,” IMF Working Paper, WP/05/127, IMF: Washington D.C.
Rodrik, D. (1991), “Policy Uncertainty and Private Investment in Developing Countries,”
Journal of Development Economics, 36 (2): 229-242.
Sachs, J. and A. Warner (1995), “Economic reform and the process of global integration,” Brooking Papers on Economic Activity, 1, pp 1–118.
Schumpeter, J. (1939), Business Cycles: A Theoretical, Historical and Statistical Analysis of the capitalist Process, New York: McGraw Hill.
Serven, L. (1997), “Irreversibility, Uncertainty and Private Investment: Analytical issues and Some Lessons for Africa,” Journal of African Economies, 6 (3): pp. 229-268.
Vargas Hill, R. (2005), “Assessing Rhetoric and Reality in the Predictability of Aid,” Human Development Report 2005, UNDP.
Wacziarg, R. and K. H. Welch (2003), “Trade Liberalization and Growth: New Evidence,” mimeo, Stanford University.
Wooldridge, J. M. (2001), “Applications of Generalized Method of Moments Estimation,”
21
Appendix I. How volatile is aid and what causes aid volatility?
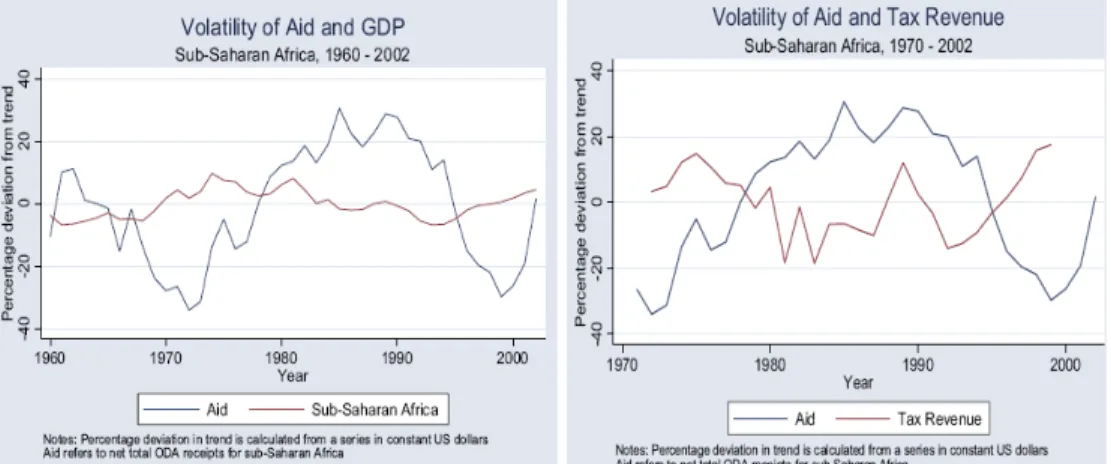
Literature suggests that aid is more volatile than other capital inflows, revenue receipts or GDP. Osei, Morrissey and Lensink (2002) find that, for low-income countries in aggregate, ODA was less volatile than other capital inflows (e.g. foreign direct investment) over the 1970 – 97 period, whereas at the individual country level, ODA was much more volatile. For instance, in Indonesia the coefficient of variation is 78 percent of the mean aid inflows. Bulir and Hamann (2003) find large aid volatility in 72 developing countries, with coefficients of variation in the range of 40-60 percent of the mean aid flows, larger than that of revenues. Vargas Hill (2005) also suggests that variation in aid flows is twice as large as the variation in revenue receipts in Sub-Saharan
African countries (see Figure 1 below for the time trends). Vargas Hill (2005) further presents that the coefficient of variation of net aid disbursements to Sub-Saharan African countries is 21 percent, five times as high as their GDP with the coefficient of variation of 4 percent.
Figure A.1. Volatility of aid
Source: Vargas Hill (2005)
Interestingly, these figures suggest potential counter-cyclical property in net aid flows to Sub-Saharan Africa: aid flow trends are opposite to the trends of GDP and revenue receipts. This is in contrast to the findings of Bulir and Hamann (2003, 2005): aid tends to move in the same
direction as GDP and revenues11.
As found by Bulir and Hamann (2003), Vargas Hill (2005) also finds in a case study of Uganda and Zambia over 1993-2000 that failure to meet conditionality is a main cause of aid volatility (Figure A.2). Uganda experiencing aid
disbursement problems responded by meeting macroeconomic conditions, in contrast to Zambia which is experiencing program interruptions as a result of failing to do so.
11 Hudson and Mosley (2008b) argue that Bulir and Hamann´s (2003, 2005) results depend on the dataset they use.
Source: Vargas Hill (2005)
Appendix II. Summary statistics
Table A.1. Summary statistics
Variable Number of
observations Mean Standard deviation Minimum Maximum
Period 1960-2000 Aid to GDP 79 3.90 4.28 0.07 20.94 IDA to GDP 75 0.61 0.74 0.00 3.60 Multilateral aid to GDP 74 0.41 0.48 0.00 2.44 Bilateral aid to GDP 74 1.19 1.38 0.00 6.51 Period 1960-1980 Aid to GDP 63 1.91 1.70 0.00 6.06 IDA to GDP 61 0.18 0.24 0.00 1.14 Multilateral aid to GDP 57 0.23 0.30 0.00 1.42 Bilateral aid to GDP 59 0.96 1.25 0.00 6.92 Period 1970-2000 Aid to GDP 83 3.66 4.29 0.04 20.94 IDA to GDP 79 0.62 0.75 0.00 3.60 Multilateral aid to GDP 78 0.41 0.48 0.00 2.44 Bilateral aid to GDP 78 1.19 1.36 0.00 6.51 Period 1980-2000 Aid to GDP 83 3.09 3.66 0.03 20.01 IDA to GDP 80 0.58 0.73 0.00 2.90 Multilateral aid to GDP 78 0.33 0.38 0.00 1.85 Bilateral aid to GDP 73 0.93 1.05 0.00 4.94 Period 1990-2000 Aid to GDP 80 2.52 2.90 0.02 13.67 IDA to GDP 78 0.50 0.62 0.00 2.21 Multilateral aid to GDP 73 0.25 0.30 0.00 1.34 Bilateral aid to GDP 79 0.68 0.73 0.00 3.36 Table A. 2. Correlation, 1960-2000 Variable (1) (2) (3) (4) (5) (6) (7) (8) (9) (1) Real per capita GDP growth 1
(2) Standard deviation of aid-to-GDP -0.3776 1
(3) Initial GDP per capita -0.0238 -0.3517 1
(4) Gross capital formation (% of GDP) 0.5502 -0.0387 0.2131 1
(5) Initial life expectancy 0.4539 -0.4891 0.5877 0.2831 1
(6) Average growth of terms of trade -0.0769 0.2677 -0.1212 0.1124 -0.222 1
(7) Standard deviation of growth of terms of trade -0.1733 0.2158 -0.0658 0.0628 -0.1588 0.7684 1
(8) Trade policy 0.4219 -0.2144 0.1789 0.1102 0.3594 -0.2403 -0.2022 1 (9) Number of revolutions -0.3459 0.0623 0.0022 -0.2821 -0.1604 0.0127 0.0231 -0.133 1
Appendix III. Sample of the tests
Code Country Growth
Aid volatility IDA volatility Multilateral aid volatility Bilateral volatility Region Aid absorption Aid
spending Income Outlier
ALB Albania 15.61 0.83 0.09 1.89 Full Full Lower middle
DZA Algeria 1.52 4.64 0.00 0.09 0.48 No Full Lower middle
AGO Angola -1.65 2.75 0.28 0.04 0.28 Africa No Full Lower middle
ARG Argentina 1.00 0.07 0.00 0.01 0.07 No No Upper middle
ARM Armenia 5.61 2.21 0.19 0.58 Partial Full Lower middle
AZE Azerbaijan 1.52 0.56 0.04 0.72 No Full Lower middle
BGD Bangladesh 1.16 1.94 0.34 0.37 0.83 Full Full Low
BLZ Belize 3.70 0.00 1.13 1.58 Full Full Upper middle
BEN Benin 0.32 4.36 0.75 0.88 0.98 Africa No Partial Low
BOL Bolivia 0.37 2.92 0.63 0.53 0.73 No Full Lower middle
BWA Botswana 5.29 7.98 0.37 0.28 4.52 Africa No Full Upper middle Outlier
BRA Brazil 2.77 0.42 0.00 0.00 0.08 Full Full Lower middle
BGR Bulgaria 0.79 0.00 0.01 0.58 No No Lower middle
BFA Burkina Faso 0.59 5.47 0.96 0.57 0.50 Africa No Full Low
BDI Burundi -0.06 7.47 1.57 1.05 1.22 Africa Full No Low
CMR Cameroon 0.49 1.70 0.48 0.16 0.88 Africa Full No Low
CPV Cape Verde 3.50 7.74 1.22 1.20 0.70 Africa Full Full Lower middle
CAF Central African Rep. -2.07 4.64 1.23 0.60 1.03 Africa Full Full Low
TCD Chad -0.72 5.61 1.25 0.70 1.28 Africa Full Full Low
CHL Chile 2.37 0.79 0.00 0.04 0.16 Full No Upper middle
CHN China 4.26 0.21 0.07 0.00 0.11 East Asia Full No Lower middle
COL Colombia 1.89 0.74 0.01 0.03 0.33 No Full Lower middle
COM Comoros -0.50 10.10 1.34 2.44 3.19 Africa Full No Low
ZAR Congo, Dem. Rep. -3.37 1.92 0.61 0.16 0.44 Africa Full Full Low
COG Congo, Rep. 3.25 3.82 1.02 0.27 2.02 Africa Full Full Low
CRI Costa Rica 1.31 1.88 0.00 0.28 0.93 Full No Upper middle
CIV Cote d'Ivoire 0.35 3.32 1.08 0.19 1.03 Africa Full Full Low
HRV Croatia 0.25 0.00 0.05 0.03 Full No Upper middle
CZE Czech Republic 0.28 0.00 0.02 0.04 No Full Upper middle
DOM Dominican Republic 2.84 1.87 0.03 0.24 0.39 No Full Lower middle
ECU Ecuador 1.37 0.50 0.06 0.18 0.29 Full Full Lower middle
EGY Egypt, Arab Rep. 2.60 4.84 0.15 1.35 2.88 No No Lower middle
SLV El Salvador 0.73 3.08 0.07 0.43 1.05 No Full Lower middle
GNQ Equatorial Guinea 0.25 18.10 2.42 1.70 3.61 Full Full Upper middle
ETH Ethiopia 0.47 3.97 0.88 0.46 6.51 Africa Full No Low
FJI Fiji 1.75 1.26 0.00 0.08 0.34 East Asia No Full Lower middle
GAB Gabon 2.55 1.94 0.00 0.10 0.78 Africa Full Full Upper middle
GMB Gambia, The 0.75 12.49 1.82 2.00 2.36 Africa No Full Low
GEO Georgia 3.27 1.27 0.02 0.43 Full No Lower middle
GHA Ghana 1.11 3.90 1.56 0.21 0.61 Africa Full No Low
GTM Guatemala 1.28 0.66 0.00 0.14 0.22 No No Lower middle
GIN Guinea 0.07 2.78 0.87 0.31 2.36 Africa Full Full Low
GNB GuineaBissau 1.19 19.72 3.60 3.86 4.66 Africa Full Partial Low
HTI Haiti 2.91 5.27 0.69 0.60 1.77 Full No Low
HND Honduras 0.47 3.57 1.05 0.74 0.72 Full Full Lower middle
HUN Hungary 2.21 0.56 0.00 0.01 0.16 Full No Upper middle
IND India 2.68 0.64 0.12 0.01 0.29 No Full Low
IDN Indonesia 3.40 1.41 0.11 0.03 0.87 East Asia No Full Lower middle
IRN Iran, Islamic Rep. 2.02 0.08 0.00 0.00 0.10 Full No Lower middle
ISR Israel 2.80 1.87 Full No
JAM Jamaica 0.74 2.32 0.00 0.30 1.80 No Full Lower middle
JOR Jordan 1.33 9.03 0.20 0.44 2.20 Full Partial Lower middle
KAZ Kazakhstan 0.38 0.00 0.04 0.21 Full No Lower middle
KEN Kenya 1.12 3.32 0.97 0.13 0.67 Africa No Full Low
KOR Korea, Rep. 5.91 2.80 East Asia Full No Outlier
KGZ Kyrgyz Republic 6.38 1.59 1.86 1.62 No Full Low
LVA Latvia 0.45 0.00 0.00 0.21 Full Full Upper middle
LBN Lebanon 2.12 0.00 0.24 0.28 Full Full Upper middle
LSO Lesotho 2.06 6.86 0.73 1.25 0.86 Africa Full No Low
MKD Macedonia, FYR 2.55 0.39 0.30 0.19 Partial Full Lower middle
MDG Madagascar -0.99 4.89 1.15 0.68 2.81 Africa Full No Low
MWI Malawi 1.57 8.72 1.97 0.88 2.11 Africa Full Full Low
MYS Malaysia 3.86 0.33 0.00 0.00 0.27 East Asia Full No Upper middle
MLI Mali -0.03 5.91 1.01 0.91 1.67 Africa Full Full Low
MRT Mauritania 0.59 11.16 1.45 1.54 4.39 Africa Full Full Low
MUS Mauritius 3.71 1.46 0.02 0.19 0.78 Africa Full No Upper middle
MEX Mexico 1.97 0.09 0.00 0.03 0.04 Full No Upper middle
MDA Moldova 3.25 1.30 0.01 1.07 No Full Low
MAR Morocco 2.61 1.33 0.04 0.17 1.25 No Full Lower middle
MOZ Mozambique -1.05 20.94 2.52 0.85 4.81 Africa No Full Low
NAM Namibia 0.78 2.24 Africa Full Partial Lower middle
NPL Nepal 1.57 3.90 0.81 0.74 0.33 Full No Low
NIC Nicaragua -1.22 11.86 1.22 1.16 8.93 No No Low
NER Niger -1.55 6.25 1.05 0.50 0.69 Africa No Full Low
NGA Nigeria -0.95 0.42 0.11 0.02 0.14 Africa No Full Low
PAK Pakistan 2.89 2.41 0.20 0.25 1.66 Full No Low
PAN Panama 2.40 0.97 0.00 0.29 0.30 No Full Upper middle
PNG Papua New Guinea 0.75 5.68 0.22 0.67 0.57 East Asia Full Partial Low
PRY Paraguay 1.65 0.88 0.09 0.20 0.71 Full No Lower middle
PER Peru 0.88 0.56 0.00 0.05 0.59 No Full Lower middle
PHL Philippines 1.33 0.74 0.02 0.07 0.51 East Asia No Full Lower middle
POL Poland 0.95 0.00 0.00 0.04 Full No Upper middle
ROM Romania 3.54 0.23 0.00 0.01 0.21 No No Lower middle
RUS Russian Federation 0.26 0.00 0.00 0.06 Full Full Upper middle
RWA Rwanda -0.12 15.24 0.91 0.47 0.60 Africa Full No Low
SEN Senegal -0.28 4.53 0.76 0.66 1.46 Africa Full Full Low
SLE Sierra Leone -0.43 8.05 2.39 1.20 2.16 Africa No Full Low
SGP Singapore 6.79 0.36 East Asia Full No High Outlier
SVK Slovak Republic 0.40 0.00 0.01 0.26 No No Upper middle
SVN Slovenia 0.15 No Full
ZAF South Africa 1.05 0.08 0.00 0.00 0.00 Africa Full No Upper middle
LKA Sri Lanka 2.27 3.40 0.50 0.44 0.98 No Full Lower middle
SWZ Swaziland 5.26 0.13 0.36 1.34 Africa Full No Lower middle
SYR Syrian Arab Republic 2.68 4.28 0.04 0.30 5.70 Full Full Lower middle
TZA Tanzania 0.58 6.10 1.13 0.65 0.53 Africa Full Full Low
THA Thailand 4.60 0.28 0.02 0.02 0.23 East Asia No Full Lower middle
TGO Togo -0.07 4.15 1.45 0.45 1.45 Africa Full No Low
TTO Trinidad & Tobago 2.35 0.51 0.00 0.01 0.13 No Full Upper middle
TUN Tunisia 3.14 2.70 0.11 0.14 0.81 Full No Lower middle
TUR Turkey 2.33 0.41 0.01 0.06 0.34 No No Upper middle
UGA Uganda 1.29 6.15 1.67 0.40 0.99 Africa Full No Low
UKR Ukraine 0.50 0.00 0.00 0.11 No Full Lower middle
URY Uruguay 1.23 0.56 0.00 0.03 0.16 Full No Upper middle
VEN Venezuela, RB -0.50 0.17 0.00 0.02 0.03 Full No Upper middle
YEM Yemen, Rep. 1.50 0.54 0.34 0.54 No Full Low
ZMB Zambia -0.76 11.88 2.51 0.50 1.44 Africa Full Full Low
Appendix IV. Data source
Variable Description source
aid_y standard deviation of Aid (share of GDP) WDI abs absorption (change in the non-aid current account
deficit as a share of the change in aid inflows) authors' calculation spnd spending (the widening in the government fiscal deficit
net of aid) authors' calculation ry_g growth rate of GDP per capita (US$ 2000) WDI
k gross capital formation (% of GDP) WDI
ki investment (% of GDP) WDI
icrg
ICRG ratings to capture institutional quality
Authors’ calculation based on ICRG ratings
yc_penn Initial period GDP per capita (in PPP terms) Rajan and Subramanian (2005) le_wdi initial period life expectancy at birth Rajan and Subramanian (2005) gadp6099 institutional quality Rajan and Subramanian (2005) geog6099 geography Rajan and Subramanian (2005) cg_i initial period government consumption as share of
GDP Rajan and Subramanian (2005)
tot_av average growth of terms of trade Rajan and Subramanian (2005) tot_stdev standard deviation of terms of trade growth Rajan and Subramanian (2005) sw1 trade policy Rajan and Subramanian (2005) safrica Sub-Sahara Africa dummy Rajan and Subramanian (2005) east east Asia Pacific Rajan and Subramanian (2005)