Florida International University College of Law Florida International University College of Law
eCollections
eCollections
Faculty Publications Faculty Scholarship
2006
Debtor Discharge and Creditor Repayment in Chapter 13
Debtor Discharge and Creditor Repayment in Chapter 13
Scott F. Norberg
Florida International University College of Law
Andrew Velkey
Follow this and additional works at: https://ecollections.law.fiu.edu/faculty_publications
Part of the Bankruptcy Law Commons
Recommended Citation Recommended Citation
Scott F. Norberg and Andrew Velkey, Debtor Discharge and Creditor Repayment in Chapter 13 , 39 CREIGHTON L. REV. 473 (2006).
Available at: https://ecollections.law.fiu.edu/faculty_publications/229
This Article is brought to you for free and open access by the Faculty Scholarship at eCollections. It has been accepted for inclusion in Faculty Publications by an authorized administrator of eCollections. For more information, please contact lisdavis@fiu.edu.
+
(,1 1/,1(
2
Citation: 39 Creighton L. Rev. 473 2005-2006
Provided by:
FIU College of Law
Content downloaded/printed from
HeinOnline (http://heinonline.org)
Fri Jun 10 14:45:23 2016
-- Your use of this HeinOnline PDF indicates your acceptance
of HeinOnline's Terms and Conditions of the license
agreement available at http://heinonline.org/HOL/License
-- The search text of this PDF is generated from
uncorrected OCR text.
-- To obtain permission to use this article beyond the scope
of your HeinOnline license, please use:
https://www.copyright.com/ccc/basicSearch.do?
&operation=go&searchType=0
DEBTOR DISCHARGE AND CREDITOR
REPAYMENT IN CHAPTER 13
ScoTT F. NORBERGt
AND ANDREW J. VELKEY t
I. INTRODUCTION ... 475
II. SUMMARY AND HIGHLIGHTS OF PROJECT FINDIN GS ... 476
A. Debtor Discharge ... 476
B. Creditor Repayment ... 477
C. Profile of the Debtors ... 478
D. The Bankruptcy Abuse Prevention and Consumer Protection Act of 2005 ... 478
III. DESIGN AND METHODOLOGY OF THE STUDY .. 479
IV. PROFILE OF CHAPTER 13 DEBTORS ... 482
A. Gender and Household Size of Petitioners ... 483
1. G ender ... 483
2. Household Size ... 484
3. Number of Dependents ... 485
B. Income and Indebtedness ... 486
1. Debtor and Household Income ... 486
2. Income and Gender ... 488
3. Debtor Indebtedness ... 489
4. Debt-Income Ratio ... 491
5. Home Ownership ... 494
C. Previous and Subsequent Bankruptcy Filings .... 496
1. Other Filings (Previous or Subsequent to the Sample Case) ... 497
2. Other Filings - District Comparisons ... 498
3. Abuse by Repeat Filers? .. . . 499
4. Chapter, Timing, and Outcome of Other Filings ... 500
a. Chapter of Other Filings ... 500
t Professor of Law, Florida International University College of Law. tt Professor of Psychology, Christopher Newport University.
The Project was funded by the National Conference of Bankruptcy Judges Endow-ment for Education and by the American Bankruptcy Institute. In addition, the Florida International University College of Law provided generous financial support. The au-thors also acknowledge Clare Eng and Camilla Chan for their excellent research assis-tance in the collection and coding of the Project data. We also wish to thank the many Chapter 13 trustees, chief bankruptcy judges, bankruptcy court clerks, and regional United States Trustees in the seven judicial districts included in the Project for their assistance in collecting and reviewing the Project data.
b. Timing of Other Filings ... 501
c. Outcome of Other Filings ... 502
5. Filings After Discharge in the Sample Case . 503 6. The "True" Rate of Chapter 13 Filings ... 503
V. DEBTOR FRESH START IN CHAPTER 13 ... 504
A. Measuring Debtor Success in Chapter 13 ... 504
B. Debtor and District Discharge Rates in Chapter 13 - All Cases ... 505
C. Debtor and District Discharge Rates - Cases with a Confirmed Plan ... 506
D. Relationship Between Pre-Confirmation Dismissal and Discharge Rates ... 508
VI. PREDICTING OUTCOME IN CHAPTER 13 CA SE S ... 509
A. Debtor Characteristics and Case Outcome ... 510
1. Gender, Joint Filing Status, and Case O utcom e ... 510
2. Debtor and Household Income ... 511
3. Creditor Claims and Case Outcome ... 512
4. Debtor and Household Debt-Income Ratio .... 515
B. Other Bankruptcy Filings and Case Outcome .... 517
C. Chapter 13 Plan Provisions and Case Outcome... 520
1. Plan Payments and Debtor and Household Retained Income ... 520
2. Proposed Distributions to Unsecured Creditors ... 523
3. Proposed Plan Length ... 526
4. Time Spent in Chapter 13 ... 529
D. Other Variables ... 531
VII. DEBT COLLECTION IN CHAPTER 13 ... 531
A. Chapter 13 Trustee Disbursements-the National Data ... 532
1. Disbursements to Creditors and Chapter 13 C osts ... 532
2. Disbursements per Case ... 537
B. Chapter 13 Trustee Disbursements in the Seven Sample Districts/EOUST and AO Data .... 539
C. Trustee Disbursements in the Seven Sample Districts/Project Data ... 542
1. Allowed Claims ... 542
2. Disbursements Per Case and Overall in Chapter 13 Project Cases ... 542
a. All Sample Cases ... 542
CHAPTER 13
c. Completed Cases ... 546 3. Relationship Between Case Disposition and
Creditor Repayment ... 548 APPENDIX A-DESIGN AND METHODOLOGY OF THE
STU D Y ... 549 APPENDIX B-CHAPTER 13 PROJECT CODING
SH E E T ... 552 TABLE OF TABLES AND FIGURES ... 557 I. INTRODUCTION
There were nearly 1.6 million consumer bankruptcy filings in the United States in 2004. That is more than twice the number just ten years earlier1 and more than one filing for every seventy households in the country.2 Almost 29% of these filings - over 467,000 - were under Chapter 13 of the Bankruptcy Code.3 With the dramatic in-creases in consumer filings, even in prosperous economic times, there has been much debate about the causes of the "bankruptcy epidemic."4 The debate culminated last year in the enactment of extensive reform of United States consumer bankruptcy laws. The core of the legal re-forms is a "means test" that is designed to limit consumer debtor ac-cess to Chapter 7, requiring some debtors to file for relief under Chapter 13 or not at all. Yet, little is known about what debtors and creditors accomplish in Chapter 13 cases or how well the Chapter 13 system serves its intended purposes. The government collects mini-mal information about consumer bankruptcy filings, and academic
re-search has been limited.
The first national study of its kind, the Chapter 13 Project pro-vides a detailed portrait of the Chapter 13 system and the extent to which Chapter 13 has fulfilled its principal purposes-debtor fresh
1. In 1994, there were 780,455 non-business filings. See Administrative Office of the U.S. Courts, 1983-2003 Bankruptcy Filings, 12-month period ending June, by Chap-ter and District [hereinafter 1983-2003 Bankruptcy Filings], at http://web.archives.org( web/20040725085134/http:Ilwww.uscourts.govbnkrpctystats/1960-0312-MonthJune. pdf. Filings increased again, significantly, in 2005. Much or all of this increase is at-tributable to debtors filing in advance of the effective date of most of the provisions of the Bankruptcy Abuse Prevention and Consumer Protection Act of 2005 in October 2005.
2. As of March, 2003, there were 111 million households in the United States. Jason Fields, America's Families and Living Arrangements: 2003, CURRENT POPULATION REPORTS (U.S. Census Bureau, Washington, D.C.), Nov. 2003, at 2, available at http:l! www.census.gov/prod/2004pubs/p20-553.pdf.
3. See 1983-2003 Bankruptcy Filings, supra note 1.
4. See generally Personal Bankruptcy: A Literature Review, CBO PAPER (Congres-sional Budget Office), Sept. 2000, available at http://www.cbo.gov/showdoc.cfin?index= 2421&sequence=0 (reviewing the macro-economic literature relating to filing rates, fac-tors leading to personal bankruptcy, the ability of Chapter 7 filers to repay their debts, and how personal bankruptcy affects the supply of credit; with bibliography of studies).
start, on the one hand, and creditor repayment, on the other. In addi-tion, the study explores an array of debtor characteristics, Chapter 13 plan features, and district and trustee practices for their relationship to debtor discharge and debt repayment in Chapter 13. Like several other studies before it, the Project also describes the debtors who have used Chapter 13.
II. SUMMARY AND HIGHLIGHTS OF PROJECT FINDINGS A. DEBTOR DISCHARGE
The overall discharge rate for the debtors in the seven districts covered by the Project was 33%; 67% of cases were dismissed or con-verted, 23% before confirmation and 44% after confirmation. As a per-centage of cases with a confirmed plan (excluding cases dismissed before confirmation), the discharge rate was nearly 43%.
Discharge rates varied considerably across the seven districts in the sample, from a low of 27% (or 20% including cases dismissed before confirmation) in the Western District of Tennessee to a high of 54% (or 47% including cases dismissed before confirmation) in the Middle District of North Carolina. We expected, but did not find, that higher plan completion rates correlate with higher pre-confirmation dismissal rates. This and several other findings support the conclu-sion that some courts do not carefully screen cases for feasibility at confirmation. On the other hand, the data also reveal that apparent lack of feasibility is not significantly related to case outcome.
One of the more striking findings of the study is that at least 50% of the debtors filed one or more other bankruptcy cases, either before or after the sample case. Thirty percent (30%) filed at least one other case, 10% filed at least two other cases, and 10% filed at least three or more other cases. There was a statistically significant relation be-tween judicial district and incidence of other filings; about 20% of the debtors in the Middle District of North Carolina filed a later petition, while no less than 56% of the debtors in the Western District of Ten-nessee have filed more than one case, compared to the overall subse-quent refiling rate of 33%. The great majority of the other filings were also under Chapter 13, and most were made within a year of the filing in the sample case. Debtors who filed bankruptcy for the first time in the sample case were significantly more likely to complete their plans than debtors who had filed one or more previous cases. Thirty-eight percent (38%) of first-time filers completed their plans compared to 22.5% who had filed one previous case. The discharge rate plummeted to 14% for debtors who had filed two or more cases before the sample case.
CHAPTER 13
Nearly one in seven (15%) debtors who received a discharge went on to file another case.
Debtors in nearly 45% of the cases in which a proposed distribu-tion was reported proposed to pay no more than 25% of unsecured claims. In 31% of cases the debtors proposed to pay 100%. Relatively few debtors - less than 10%-proposed to pay between 26% and 99%. There was no significant difference in the proposed percentage to be paid on unsecured debt by debtors in completed cases and debtors in cases that were dismissed or converted.
Notably, a very large percentage of the debtors proposed plans longer than the minimum thirty-six months required by the Code; the median and modal lengths of the sample debtors' plans were sixty months, or twenty-four months longer than the standard set out in the Bankruptcy Code. Indeed, the length of plans at the 25th percentile was forty-seven months, or nearly a year longer than the standard envisioned by the Bankruptcy Code. However, debtors who proposed shorter plans were more likely to complete their plans.
Joint petitioners were significantly more likely to complete a plan than individual filers. The higher completion rate for joint filers could not be tied to the presence of a second income, however. Individual petitioners reporting spousal income did not complete their plans at a statistically significantly greater rate than individual filers who did not report a second income.
Debtors who completed their plans on average owed more total pre-bankruptcy debt and had higher debt-income ratios than debtors whose cases were dismissed or converted. Perhaps debtors who were more reluctant to file were more committed to doing what was neces-sary to complete a plan.
B. CREDITOR REPAYMENT
The primary creditor beneficiaries by far of the Chapter 13 sys-tem are secured creditors. Nationally, the percentage of trustee dis-bursements to secured creditors ranged between 60% and 69% of total disbursements between 1994 and 2003. Yet, these percentages sub-stantially understate the proportion of all payments by Chapter 13 debtors to secured creditors, because they do not include payments made directly by debtors to secured creditors, in particular mortgage creditors.
Less than a third of trustee disbursements were to general un-secured creditors.
Chapter 13 costs, which include debtor attorney's fees, clerk's no-ticing fees charged to the case, and any § 507(b) awards, were a siza-ble portion of total trustee distributions to creditors and equaled a 2006]
very large percentage of disbursements to general unsecured credi-tors. The ratio of Chapter 13 costs to total trustee disbursements was quite stable over the years 1994 to 2003, ranging from 15% to 18%. The ratio of Chapter 13 costs to total trustee disbursements to general unsecured creditors ranged between 59% and 75%; in other words, Chapter 13 costs equaled as much as 75% of disbursements to un-secured creditors.
Not surprisingly, creditor collections were greater in cases with a confirmed plan, and greater still in cases that proceeded to discharge of the debtor. Even so, debtors paid no more unsecured debt in cases dismissed before confirmation than in cases dismissed after confirmation.
C. PROFILE OF THE DEBTORS
The debtors in the Chapter 13 Project are very similar in terms of gender, debt-income ratio, and homeownership rates to debtors in pre-vious studies. Most of the debtors in the Chapter 13 Project were far less affluent than the population as a whole. In 1994 dollars, only 25% earned more than $26,000 per year. Half earned less than $18,000 in annual gross income, and 25% earned less than $13,000. The mean debtor household annual income was less than half the mean for all households; and the median was less than 60% of the median for all households in the country.
D. THE BANRui-rcY ABUSE PREVENTION AND CONSUMER PROTECTION ACT OF 2005
The Chapter 13 Project establishes a detailed picture of Chapter 13 outcomes that will serve as a baseline for measuring the much-criticized changes in the law wrought by the Bankruptcy Abuse Pre-vention and Consumer Protection Act of 2005. The BAPCPA reforms are complex, and their effects on Chapter 13 outcomes for debtors and creditors are subject to considerable speculation. For example, the new provision limiting strip-down of certain purchase money security interests in Chapter 135 might be expected to further increase the share of Chapter 13 disbursements paid to secured creditors and to correspondingly reduce payments to unsecured creditors. At the same time, this anti-lien stripping provision may lead some debtors who would otherwise file in Chapter 13 to file under Chapter 7 because
they can not afford to pay 100% of the claim,6 also reducing collections
5. 11 U.S.C.A. § 1325(a) (2006).
6. Henry E. Hildebrand, III, Impact of the Bankruptcy Abuse Prevention and Con-sumer Protection Act of 2005 on Chapter 13 Trustees, 79 AM. BANKR. L.J. 373, 386 n.70 (2005) (referring to preliminary analysis by the National Association of Chapter 13
CHAPTER 13
by unsecured creditors. For debtors who are or would be means-tested out of Chapter 7, the means test will determine the amount of their "disposable income" that must be devoted to a Chapter 13 plan.7 Whether this test requires more or less in debtor plan payments than the current disposable income test remains to be seen. The new limi-tations on repeat filings may boost overall discharge rates and thus increase average creditor collections per case. The credit counseling and debtor education requirements also may have far-reaching consequences.
III. DESIGN AND METHODOLOGY OF THE STUDY
The Chapter 13 Project is an empirical study of 795 Chapter 13 cases filed in 1994 in seven federal judicial districts comprising four-teen Chapter 13 trusteeships. The seven federal judicial districts are Northern District of Georgia, Southern District of Georgia, Middle District of North Carolina, Middle District of Tennessee, Western Dis-trict of Tennessee, DisDis-trict of Maryland, and Western DisDis-trict of Penn-sylvania. Collectively, these seven districts accounted for a very large portion - nearly 20%-of Chapter 13 filings nationally in 1994. There were 240,639 Chapter 13 filings in 1994, including 47,393 in the seven sample districts.8
In each district, we pulled a quota sample of one percent (1%) of the Chapter 13 cases filed in 1994, but no fewer than 100 cases. The sample includes 165 cases from the Northern District of Georgia, 130 cases from the Western District of Tennessee, and 100 cases from each of the other five districts.
The Chapter 13 Project's sample of debtors, trusteeships, and dis-tricts is highly representative of the nation as a whole, notwithstand-ing that there are significant variations in practice among districts, judges, and trustees across the country.9 The discharge rate for the
Trustees in 2001 that indicated 23% of Chapter 13 plans would not be confirmable if auto loans could not be stripped down).
7. 11 U.S.C.A. § 1325(b)(3) (2006) (as amended by the BAPCPA).
8. See Administrative Office of the U.S. Courts, 1983-2003 Bankruptcy Filings, 12-month period ending June, by Chapter and District [hereinafter 1983-2003 Bank-ruptcy Filings], at http://web.archives.orgtweb/20040725085134thttp:/www.uscourts. gov/bnkrpctystats/1960-0312-MonthJune.pdf.
9. The study of the bankruptcy system in the United States poses some difficult challenges in that, while one Code and one set of Rules of Procedure govern all cases in all bankruptcy courts, there are wide variations in the local practices and attitudes of bankruptcy trustees, lawyers, and judges. Sometimes referred to as "local legal cul-ture," these variations often are large and contribute substantially to case outcomes for debtors and creditors alike. See Jean Braucher, Lawyers and Consumer Bankruptcy: One Code, Many Cultures, 67 AM. BANKR. L.J. 501 (1993); Teresa A. Sullivan, Elizabeth Warren & Jay L. Westbrook, The Persistence of Local Legal Culture: Twenty Years of Evidence from the Federal Bankruptcy Courts, 17 HARv. J.L. & PuB. POL'Y 801 (1994);
795 debtors, as well as the average discharge rate across the seven districts, was almost identical to the oft-cited national average of 33%. 10 Further, the amounts and types of debt repaid by the debtors were similar to the national averages reported by the Executive Office for United States Trustees for all Chapter 13 cases closed during the same time period." The percentages of male and female petitioners and the debt-income ratios of the debtors were comparable to those observed in other studies.12
While representative of the nation in the key areas of debtor dis-charge and creditor repayment, the sample is, of course, not a national sample. The sample districts are located mostly in Southern states with higher Chapter 13 filing rates. At the same time, the choice of seven districts that accounted for nearly 20% of all Chapter 13 filings likely contributed to, rather than detracted from, the representative-ness of the sample. The representativerepresentative-ness of the sample also was not undermined by the fact that it includes one percent of 1994 filings in the NDGA and WDTN and more than one percent of filings in the other five districts (ranging from 1.9% of Chapter 13 filings in the SDGA in 1994 to 11.9% in the WDPA).1 3 Further, by including a
mimum of 100 cases from each district, we were able to run several in-ter-district analyses and intra-district comparisons.
We use the term "significant" throughout the paper to mean sta-tistical significance. Stasta-tistical analyses were performed using the SPSS software package. We used a criterion level of 5%; thus, statisti-cal significance is inferred only when there would be a 5% or less probability that a finding arose by chance. Most of the time, we used chi-square tests for comparisons of nominal and ordinal variables (e.g., district, case disposition, other filings) and t-tests for compari-sons of interval variables (e.g., income, debt). The statistical analyses do not interpolate or extrapolate the values of missing data. If data
William C. Whitford, Has the Time Come to Repeal Chapter 13?, 65 IND. L.J. 85 (1989); Teresa A. Sullivan, Elizabeth Warren & Jay L. Westbrook, Laws, Models, and Real Peo-ple: Choice of Chapter in Personal Bankruptcy, 13 LAw & Soc. INQUIRY 661, 693-700 (1988).
10. See infra notes 70-72 and accompanying text and Tables 18 and 19.
11. See infra notes 182-88 and accompanying text and Tables 43 and 44 (demon-strating that while the sample debtors repaid somewhat more secured debt than the estimated national average, the difference was well within the standard deviation for the sample). In addition, the ratio of trustee disbursements to secured, priority, and unsecured creditors, the increases in disbursements over the period 1994-2003, and the ratios of Chapter 13 costs to total creditor and to unsecured creditor disbursements in the sample districts are very closely comparable to the national figures. See id.
12. See infra notes 20-21 and accompanying text and Table 1.
13. Arguably, the statistical analyses of data on all debtors should be performed on the same percentage of cases from each district, in order to assure that district- or trus-tee-based variations in the data do not disproportionately impact the national picture created by the data set.
CHAPTER 13
were not available, the case was excluded from the relevant analysis. Much of the data analyzed for the study did not meet the criteria to be considered normally distributed in the sample; when normality as-sumptions were substantially violated and could not easily be resolved by excluding outlying scores (+3 SD's above the mean), non-paramet-ric statistical analyses were used in order to maintain a Type I error rate of less than .05.
At several points in the paper, we compare financial data (e.g., debtor income, average disbursements per case) for one year with data for another year. In doing so, we adjusted the dollar amounts using the commonly used Consumer Price Index.
By way of caveat, there are several limitations inherent in the data with respect to (a) the amounts of long-term secured debt - usu-ally, mortgage debt - owed by the debtors, and (b) the amounts of such debt repaid by the debtors. Long-term mortgage debts normally entail two components in Chapter 13 cases: first, a claim for pre-petition ar-rearages, invariably reported as a separate claim, which was to be paid under the plan; and second, a claim for the balance of the mort-gage loan, as to which the debtor was to make the regular monthly payments due after filing. Then, as now, districts and trustees fol-lowed either of two different practices regarding post filing mortgage payments. In some districts, debtors ordinarily make post filing mort-gage payments through the plan, while in other districts they typically make these payments directly to the mortgagee.14 In the former
dis-tricts, the payments to secured creditors reported by the trustees nat-urally were much, much larger than those reported in the other districts, although the debtors in both districts made postpetition mortgage payments. As to this problem, it simply was not possible to ascertain how much debtors might have paid to mortgagees outside a plan, nor was it possible to separate mortgage payments made under a plan from other secured debt payments made under the plan. Thus, the Project data understate debtor payments to secured creditors, be-cause they include ongoing mortgage payments for some debtors (those in districts in which these payments were made through the
14. See Gordon Bermant & Ed Flynn, Bankruptcy by the Numbers, Chapter 13: Who Pays the Mortgage?, 20 AM. BANKR. INST. J. 20, 20 (June 2001) (reporting that "in 1999 one-third (58/175) of the standing trustees were making ongoing mortgage pay-ments for at least some of their cases"). See also Gordon Bermant, Making Post-Petition Mortgage Payments Through the Plan: A Survey of Standing Chapter 13 Trustees, A First Draft Report of Survey Results to the Endowment Committee of the National Con-ference of Bankruptcy Judges (July 2004) (manuscript on file with the author) (report-ing on survey of stand(report-ing Chapter 13 trustees regard(report-ing practices respect(report-ing payment of mortgages under the plan). In his survey of Chapter 13 trustees who make post-petition mortgage payments through the plan, Dr. Bermant found that about half do so only when the debtors owe mortgage arrearages. Id. at 16.
plan), but not for others (those in districts in which these payments normally were not made under the plan).
Also problematic in some trusteeships or cases, long-term mort-gage (non-arrearage) claims may have been included in the trustee's record of secured claims against the debtor, while in other trustee-ships or cases these claims were not listed. If included, the debtor's secured and total indebtedness obviously would appear much larger than if these claims are not included. As to this problem, we achieved consistency by excluding long-term mortgage debts from our calcula-tions; the data we report on allowed claims and debtor indebtedness,15 debt-income ratios,16 relationship between debt-income ratio and case outcome,' 7 and relationship between creditor claims and case out-come'8 exclude long-term mortgage debts as best we were able.19 As a
result, however, the data understate the debtors' secured debt, total indebtedness, and debt-income ratios to the extent of any long-term mortgage debt.
In all districts and trusteeships, mortgage arrearage claims were reflected in the trustee records, and further, were almost invariably paid under, not outside, the plan. The data that we report regarding amounts of secured and total indebtedness and debt-income ratios in-cludes mortgage arrearages; and the data that we report on debt re-payment includes plan re-payments on mortgage arrearages.
Additional details regarding the design and methodology of the study are included in Appendix A, Design and Methodology of the Study, and Appendix B, the Chapter 13 Project Coding Sheet. IV. PROFILE OF CHAPTER 13 DEBTORS
As a preface to the following Parts V and VI regarding debtor dis-charge and creditor repayment in Chapter 13, this Part IV sketches a limited profile of the debtors in the study sample based on information available from the Chapter 13 trustee reports, bankruptcy court case files, and PACER. In particular, this Part reports on the gender and household size, income, indebtedness, debt to income ratio,
home-15. See infra notes 39-41 and accompanying text and Table 8. 16. See infra notes 42-47 and accompanying text and Table 9. 17. See infra notes 95-105 and accompanying text and Table 27. 18. See infra notes 89-92 and accompanying text and Table 26.
19. A few long-term mortgage debts may not have been excluded; the Chapter 13 trustee case data may not always have correctly typed a mortgage claim as a mortgage claim. There are a few cases in which the debtors owed secured debts greater than $50,000, but the trustee claim record did not identify it as a mortgage debt. It seems likely that some of these claims were mortgage claims, but we did not exclude them as they were not identified as mortgage claims. The number of these claims is so small that their inclusion would not materially affect the analyses.
CHAPTER 13
owner status, and previous and subsequent bankruptcy filings of the 795 debtors in the study sample.
A. GENDER AND HOUSEHOLD SIZE OF PETITIONERS 1. Gender
The petitioners were almost exactly evenly divided between men and women.20 As reported in Table 1, women constituted 36.3% of the petitioners, and men constituted 36.9%. The balance was joint peti-tioners. Other recent studies likewise have found that about 35-40% of bankruptcy petitioners were women filing singly.2 1
TABLE 1. GENDER OF PETITIONERS
Gender Number Percent of all Petitioners
Female 273 36.3%
Male 277 38.7%
Joint 203 27.0%
Total 753 (42 missing22) 100.00%
20. The form petition, Schedules, and Statement of Financial Affairs do not ask the debtor to indicate gender (or race). See Official Bankruptcy Forms 1, 6 & 7. Gender
must be inferred from the debtor's first name. It was not possible to make even an educated guess about a debtor's gender in only eighteen cases.
21. The percentage as well as absolute numbers of women filing for bankruptcy relief have increased over time. See Elizabeth Warren, What Is a Women's Issue? Bank-ruptcy, Commercial Law, and Other Gender-Neutral Topics, 25 HARv. WOMEN'S L.J. 19,
24, 27 n.40 (2002) (reporting findings of 2001 study of Chapter 7 and Chapter 13 debtors in five judicial districts; 39% of petitions were by women filing alone, 28.8% by men filing alone, and 32.0% by husband and wife filing jointly); TERESA SULLIVAN, ELIZABETH
WARREN & JAY L. WESTBROOK, THE FRAGILE MIDDLE CLASS, AMERICANS IN DEBT 36-37 (2002) (study of debtors in sixteen judicial districts who filed for bankruptcy under Chapter 7 or Chapter 13 in 1991; finding that 30% of petitions were filed by women, 26% were filed by men, and 44% were joint petitions and reporting that the proportion of petitions filed by women, by men, and jointly was about the same in Chapter 13 and Chapter 7 cases); Teresa Sullivan & Elizabeth Warren, The Changing Demographics of Bankruptcy, NORTON BANKR. L. ADVISOR 1-7 (Oct. 1999) (also reporting results of study of chapter 7 and chapter 13 cases in 2001, finding nearly 39% of filings were by women, 33% joint, and 29% by men); Ed Flynn & Gordon Bermant, Bankruptcy by the Numbers, Demographics of Chapter 7 Debtors, 18 AM. BANKR. INST. J. 24 (Sept. 1999) (reporting on survey by Executive Office for United States Trustees of 1452 no-asset chapter 7 cases filed in late 1998 or early 1999 and finding that 34.6% of cases were filed by women, 29.5% by men, and 35% by joint petitioners); TERESA A. SULLIVAN, ELIZABETH WARREN & JAY L. WESTBROOK, BANKRUPTCY AND THE FAMILY, FAMILIES AND LAw 193, 207 (Lisa J. McIntyre & Marvin B. Sussman eds., The Haworth Press, Inc., 1995) (also reporting on the 1991 study of debtors in the Consumer Bankruptcy Project).
22. Includes eighteen cases in which the gender of the petitioner is undetermined, including one case for which filing status (joint or individual) is unknown.
2. Household Size
Table 2 reports that the average household size of the debtors in the sample was 2.69. Household size is the sum of the petitioner(s) and any dependents. Dependents include any children in a joint fil-ing, and any spouse or child in a single filing. The median household size was 2. For joint petitioners, the mean and median were signifi-cantly higher than for all debtors, 3.61 and 4, respectively. Female petitioners' households were slightly larger on average than male peti-tioners', 2.39 compared to 2.32.
TABLE 2. HOUSEHOLD SIZE OF PETITIONERS BY GENDER
Petitioner
Gender N Range Mean SD SEM 25% Median 75% Female 273 1-7 2.39 1.32 0.08 1 2 3 Male 277 1-11 2.32 1.55 0.093 1 2 3 Joint 203 1-8 3.61 1.34 0.094 2 4 4 All2 3 770 1-11 2.69 1.52 0.055 1 2 4 missing 25
Table 3 reports the frequency of occurrence of each household size between 1 and 11 of the cases in the sample. Just over one quarter of all households were composed of only the debtor, while nearly another quarter were composed of two persons. Approximately 37% of house-holds were composed of three or four persons, including the debtor. Only 12.2% of the households were composed of more than four persons.
TABLE 3. HOUSEHOLD SIZE OF PETITIONERS (FREQUENCY)
Household Size Number Percent
1 198 25.9% 2 188 24.6% 3 161 21.0% 4 124 16.2% 5 62 8.1% 6-11 32 4.2% total 765 (30 missing) 100%
23. Includes seventeen cases in which the gender of the petitioner is undetermined, while excluding twenty-five cases in which data on household size is missing.
CHAPTER 13 3. Number of Dependents
As to be expected, the data on number of dependants closely par-allel the data on household size. Table 4 reports that the mean num-ber of dependents was 1.25. The mean for joint petitioners, 1.65, was significantly higher than for male and female petitioners filing indi-vidually (0.99 and 1.2, respectively). The mean for female petitioners was somewhat higher than for male petitioners, 1.2 versus 0.99. These latter figures probably obscure, however, that there are more children in cases filed by women individually than in cases filed by men individually,24 but our data on the point are not complete. TABLE 4. NUMBER OF DEPENDENTS BY GENDER
Petitioner
Gender N Range Mean SD SEM 25% Median 75%
Female 273 0-6 1.2 1.23 0.074 0 1 2 Male 276 0-9 0.99 1.3 0.078 0 1 2 Joint 203 0-6 1.65 1.31 0.092 0 2 2 All (incl. 'unsure") 770 0-9 1.25 1.3 0.047 0 1 2 missing 25
Table 5 reports the frequency of occurrence of each number of de-pendents from one to nine. Nearly 38% of filers had no dede-pendents. Eighty-four percent of households included two or fewer dependents, while only 16% had three or more.
TABLE 5. NUMBER OF DEPENDENTS PER HOUSEHOLD (FREQUENCY)
Number of Dependents N Percent
0 289 37.8% 1 175 22.9% 2 179 23.4% 3 82 10.7% 4 25 3.3% 5-9 15 2.0%
Total 765 (30 missing cases) 100%
24. See Elizabeth Warren, Bankrupt Children, 86 MiNN. L. REV. 1003 (2002) (re-porting findings from Phase III of the Consumer Bankruptcy Project, an empirical study of 1250 cases in five judicial districts, that bankruptcy filing rates for unmarried women are much higher than for married couples or for unmarried men).
B. INCOME AND INDEBTEDNESS 1. Debtor and Household Income
Table 6 reports on debtor and household, annual gross and net incomes, in 1994 dollars, as of the time of Chapter 13 filing.2 5 The mean and median annual gross incomes of the individual debtors in the sample were $20,578 and $18,396, respectively, and their mean and median annual net incomes were $16,824 and $15,180. The mean and median annual gross incomes of the debtor households were $25,274 and $22,314, respectively, while the mean and median annual net incomes of the debtor households were $20,571 and $18,246.26 That the means are somewhat greater than the medians indicates that some debtors and households had relatively higher incomes that increased the overall means. The standard deviation2 7 of the debtors' annual gross incomes, $11,205, is moderate - approximately one-half the mean - indicating a moderately wide variation in debtor gross in-comes. For household annual gross income, the standard deviation, $13,816, also is moderate - again, nearly half the mean - again indi-cating a moderately wide variation in debtor household incomes. The standard error of the mean (SEM2s) indicates that the true mean debtor annual gross income in the population was between $10,409 25. These data were obtained from Schedule I ("Current Income of Individual Debtors") of the debtors' Schedules of Assets and Liabilities. See Form 6, Official Bank-ruptcy Forms. Schedule I requires the debtor to state the debtor's monthly gross income and payroll deductions and state the debtor's spouse's monthly gross income and payroll deductions, if the debtor is married, regardless of whether the petition was a joint peti-tion with the spouse. Thus, as used here, net income refers to gross income minus pay-roll deductions; and household income refers to the combined incomes of the debtor and any spouse.
26. The median and mean gross incomes of the debtors in the Chapter 13 Project were remarkably similar to, albeit slightly more than, those of the debtors studied by Sullivan, Warren, and Westbrook ("SWW") in The Fragile Middle Class, supra note 21 & Table 2.3. The Fragile Middle Class studied debtors in sixteen judicial districts who filed for bankruptcy under Chapter 7 or Chapter 13 in 1991. The median and mean incomes of the debtor households, in 1994 dollars, adjusted for comparison to the Chap-ter 13 Project sample, were $19,542 and $22,099, respectively, compared to $22,314 and $25,274 for the debtors in the Chapter 13 Project. The SWW figures include both Chap-ter 7 and ChapChap-ter 13 filers. Because ChapChap-ter 13 debtors have higher average incomes than Chapter 7 debtors, it is expected that the figures for Chapter 13 debtors in the Chapter 13 Project would be somewhat higher.
27. The standard deviation is a measure of variability within the sample. In a statistically normal distribution, 68% of all scores are within one standard deviation of the mean, however, the debtor and household incomes are not normally distributed in the Project sample.
28. The standard error of the mean (SEM) is a measure of the reliability of the sample mean's ability to estimate the "true mean" of the population. The range within which the true mean of the population falls, at a 95% level of confidence, is the mean of the sample, plus or minus 1.96 times the SEM.
CHAPTER 13
and $12,001. As to mean household annual gross income, the confi-dence interval of the estimate of mean is $12,830-$14,802.29
The 25th and 75th percentile amounts provide further insight into the diversity among debtors with respect to personal and house-hold, annual gross and net incomes. Twenty-five percent (25%) of debtors had annual gross income below $13,110 and annual net in-come below $11,040. Twenty-five percent had annual gross inin-come above $26,220 and annual net income above only $21,192. The house-hold annual gross income figures are very similar to the debtor annual gross income numbers at the 25th and 75th percentiles: 25% of house-holds had annual gross income below $13,077 and 25% had more than $26,436.
The debtor households in the study sample were markedly less affluent than the U.S. population as a whole. In 1994, the mean and median household incomes in the United States were $50,961 and $38,119, respectively,30 compared to $25,274 and $22,314 for the debtor households. That is, the mean debtor household annual income was less than half the mean for all households; and the median was less than 60% of that for all households.
29. Naturally, debtor and household annual net incomes were much less than the gross. As reported in Table 5, the mean and median debtor annual net incomes were $16,824 and $15,180, respectively, or 18.3% and 17.5%, respectively, less than the mean and median debtor annual gross incomes. Likewise, the mean and median debtor household annual net incomes were $20,571 and $18,246, respectively, or 18.7% and
18.2%, respectively, less than the mean and median household gross incomes. 30. See, e.g., Carmen DeNavas-Walt & Robert W. Cleveland, Money Income in the United States: 2001, CURRENT POPULATION REPORTS, CONSUMER INCOME (U.S. Census Bureau, Washington, D.C.), Sept. 2002, at 21, Appendix A, Table A-1, available at http:/ /www.census.gov/prod/2002pubs/p60-218.pdf.
TABLE 6. DEBTOR AND HOUSEHOLD, ANNUAL GROSS AND NET INCOME
N Range Mean SD SEM 25% Median 75%
Debtor Annual 761 $0-$66,39331 $20,578 $11,205 $406 $13,110 $18,396 $26,220 Gross Income Debtor Annual 763 $0-$56,40032 $16,824 $8,657 $313 $11,040 $15,180 $21,192 Net Income Household Annual 754 $0-$78,32433 $25,274 $13,816 $503 $14,991 $22,314 $32,523 Gross Income Household Annual103 $2,7 $052 Net Income 754 $0-$65,10034 $20,571 $10,502 $382 $13,077 $18,246 $26,436
2. Income and Gender
The data reveal statistically significant differences in income based on the debtor's gender. As shown in Table 7 below, female peti-tioners reported significantly less annual income than either male or joint petitioners. Male petitioners reported the highest incomes. Fe-male petitioners reported mean and median annual income of $15,060 and $14,220, respectively, compared to $16,848 and $15,516 for joint petitioners, and $18,461 and $16,848 for male petitioners. While the proximity of the mean and median values within each of the three groups indicates fairly symmetrical distributions in the trimmed data, the amount of variance within each group was still substantial.3 5
31. All income amounts > $66,393 (M + 3.0 SD) were excluded from descriptive procedures.
32. All income amounts > $56,400 (M + 3.0 SD) were excluded from descriptive and inferential procedures.
33. All income amounts > $78,324 (M + 3.0 SD) were excluded from descriptive and inferential procedures.
34. All income amounts > $65,100 (M + 3.0 SD) were excluded from descriptive and inferential procedures.
35. A small number of cases (n < 40) reported gross and net incomes that were substantially greater than the mean of their respective samples. The cases that were more than three standard deviations above their respective sample means were ex-cluded from further analyses. A Kruskal-Wallis, non-parametric analysis indicated that female petitioners reported significantly lower annual income than the overall sample median annual income, '12(2, N = 754) = 16.74, p # .001; and that female peti-tioners reported significantly lower annual household income than the overall sample median annual household income, 112 (2, N = 749) = 83.1, p # .001.
CHAPTER 13
TABLE 7. ANNUAL GROSS INCOME BY GENDER OF PETITIONER
Gender of
Petitioner N Range Mean SD SEM 25% Median 75% Female 271 $0-$48,20436 $15,060 $7,476 $454 $10,308 $14,220 $18,528 Joint 199 $0-$52,24837 $16,848 $8,485 $602 $11,328 $15,516 $21,168 Male 276 $0-$66,06038 $18,461 $9,259 $557 $11,616 $16,848 $23,724
3. Debtor Indebtedness
Table 8 below reports the range, mean, median, and 10th, 25th, 75th, and 90th percentile amounts of the allowed secured, priority, general, and total claims against the debtors in the study sample in 1994 dollars. The figures for secured claims do not include post filing mortgage debts, but do include pre-filing mortgage arrearage claims.3 9
For each type of debt, and total debt, the mean substantially ex-ceeds the median, indicating that a relatively few cases with relatively large claims increased the overall debtor averages. The standard de-viations likewise indicate a very wide spread in the amount of debt carried by the debtors in the sample cases.
The mean total debt (excluding post filing mortgage balances) was over $24,000, while the median amount was nearly $16,000 and the standard deviation was $32,755. The median and 10th, 25th, 75th, and 90th percentile amounts of total debt further illustrate the spread among debtors in total debt, with a positive skew to the distribution. The figures for standard error of the mean indicate a high level of con-fidence that the mean debt amounts in the sample approximate the mean debt amounts in the entire population of debtors.
For most debtors, most allowed debt was secured debt. The mean amount of secured debt (excluding non-arrearage mortgage claims) was $11,593, with a median of $7,178 and a standard deviation of $20,395.
36. All income amounts > $48,204 (M +3.0 SD) were excluded from descriptive and inferential procedures.
37. All income amounts > $52,248 (M +3.0 SD) were excluded from descriptive and inferential procedures.
38. All income amounts > $66,060 (M +3.0 SD) were excluded from descriptive and inferential procedures.
39. As discussed above, supra notes 14-19 and accompanying text, some trustees include non-arrearage mortgage debts in their record of creditor claims, while others do not. Thus, in order to achieve consistency in the computation of allowed secured claims across trusteeships and debtors, we excluded long-term mortgage claims in calculating the amount of secured debt for all debtors.
The distribution of priority debt was highly skewed. Most debtors had no priority debt, while a few owed very large priority debts. The mean was $1,857, while the 10th percentile, 25th percentile, and me-dian amounts of priority debt were $0. The 75th percentile amount was only $925. The 90th percentile was $3,823, confirming that a very few debtors owed very large amounts of priority debt.
Table 8 is most reliable as to the debtors' general unsecured in-debtedness. The mean amount of allowed unsecured debt was $9,958, and the median was $5,143, indicating that some debtors owed much more unsecured debt than most.40 The standard deviation for un-secured debt was very large, more than two times the mean, confirm-ing the very large spread among debtors in amounts of unsecured indebtedness.
TABLE 8. DEBTOR INDEBTEDNESS-ALLOWED CLAIMS4 1 # cases
with Allowed value
Claims N = $0 Range Mean SD SEM 10% 25% Median 75% 90% Securd 787(8 121 $0- $11,593 $20,395 727 $0 $1,707 $ 7,178 $14,733 $26,040 Scedmissing) (15%) $376577 piority 783 (12 462 $0-missing) (59%) $115406 $ 1,857 $ 7,124 254.58 $0 $0 $0 $925 $ 3,823 General 782(13 86 $0 $ 9,958 $19,976 714.34 $0 $1,364 $ 5,143 $10,615 $20,953 Missing) (11%) $257377 Total 772s(23)33 $0 $24,294 $32,755 1178.86 $2,849 $8,112 $15,865 $28,914 $51,059 Total_ missing) (4%) $432084
40. The Project did not investigate what types of debt composed the debtors' un-secured indebtedness. Professor Melissa Jacoby reports that 48.3% of Chapter 13 cases in an eight-judicial-district study of debtors who filed for bankruptcy in 1999 were 'medical-related," that is, the debtors had at least $1000 in health-related bills and/or reported illness or injury as a cause of their filing. Melissa Jacoby, Collecting Debts from the Ill and Injured: The Rhetorical Significance, but Practical Irrelevance, of Cul-pability and Ability to Pay, 51 Am. U. L. REV. 229 (2001). See also David U. Himmel-stein, Elizabeth Warren, Deborah Thorne & Steffie Woolhandler, Illness and Injury As Contributors to Bankruptcy, HEALTH AFF. (Feb. 2, 2005), at http://content.healthaffairs. org/cgi/reprint/hlthaff.w5.63vl.pdf (regarding same eight-judicial-district study, report-ing that 46.2% of Chapter 7 and Chapter 13 cases were medical-related); Melissa B. Jacoby, Teresa A. Sullivan & Elizabeth Warren, Rethinking the Debates over Health Care Financing: Evidence from the Bankruptcy Courts, 76 N.Y.U. L. REV. 375, 389-90 (2001) (same); Melissa B. Jacoby, Teresa A. Sullivan & Elizabeth Warren, Medical Problems and Bankruptcy Filings, NORTON BANKR. L. ADVISOR, 4, Figure 2 (2000) (same study, finding 45.6% of debtors had either medical reason for filing or substantial medi-cal debt).
41. This Table includes "other claims" in Total Allowed Claims, but does not separately report such claims because fewer than 10% of the cases included "other claims," and different trustees classified different sorts of claims as "other claims."
As indicated in the bottom row of this Table, there were thirty-three cases in which there were no allowed claims. Most or all of these cases were cases in which there were scheduled claims, but no allowed claims. All but six of the thirty-three cases were dismissed before confirmation. If only cases with confirmed plans are considered in computing allowed claims, the means change minimally and are well within the
CHAPTER 13 4. Debt-Income Ratio
Debt-to-income ratio is a primary measure of debtor financial dis-tress; the higher the ratio, the more burdened was the debtor with debt and less able to pay that debt from current income.4 2 As reported in Table 9 below, the mean debt-annual net income ratio of the debtors in the study, excluding long-term mortgage debt, was 1.29.4 3 That is, the average debtor would have to devote all income for a period of more than 15 months to pay short-term debt, without reserving any income for payment of long-term mortgage debt or other living ex-penses such as rent, food, health care, transportation, and utilities. The median ratio was 0.965, indicating that one half of the debtors had debts greater than nearly one year's net income, while one half had debts of less than one year's net income; and that a relatively few debtors with very high debt-income ratios pulled up the overall mean amount.
The 75th percentile debt-to-annual income ratio was 1.699, indi-cating a sizable group of debtors with huge debt burdens. At the other end, the 25th percentile income ratio was 0.558; 25% of the debt-ors had somewhat less than twice as much annual net income as non-mortgage debt. However, these debtors' financial distress is greater than appears from the debt-income ratio. The debtors in this group tended to have more dependents and more people living in the house-hold and lower incomes than the other debtors in the sample. Of 181 cases in the 25th percentile, 40% had two or more dependents, and 35% had four or more people living in the household. These cases re-present 83% of the 218 cases in the overall sample with four or more people in the household. Additionally, 45% of these cases were by
wo-margins of error of the means reported in the Table. Excluding cases dismissed or converted before confirmation of a plan, the mean secured debt was $11,257, the mean priority debt was $1,514, the mean unsecured debt was $10,636, and the mean total debt was $24,381.
42. Of course, debt-income ratio is not always an accurate indicator of financial distress; it does not account for assets and savings, which also may be used to pay debt. While acknowledging that debt-income ratios historically have closely paralleled con-sumer bankruptcy filing rates, Professor Todd Zywicki has argued that this "purported measurement [of debtor financial distress] is illogical" because debtors owe a mix of debts, some of which are to be paid over extended periods of time. He maintains that the better measure of debtor financial distress is "equity insolvency," which is a debtor's ability to pay debts as they come due. See Todd Zywicki, Why So Many Bankruptcies and What to Do About It: An Economic Analysis of Consumer Bankruptcy Law and
Bankruptcy Reform, GEORGE MASON LAw & ECONOMICS RESEARCH PAPER No. 03-46, 16-25, 65 (2003), available at http://papers.ssrn.com/sol3/papers.cfm?abstractid=454121.
43. (SEM = .041). The figures are based on allowed claims and therefore may slightly understate the extent of debtor obligation because not all creditors file their claims. On the other hand, the trustee claims information did not always specify whether a secured claim was secured by a mortgage, automobile, or other collateral, thus a few mortgage claims likely are included in the figures. See supra note 19.
men filing singly, compared to 36.3% in the overall sample of the study; and only 8% of these cases were joint filings, compared to 27% in the overall sample. The median gross annual household income for these cases was $20,796, and the median net annual household in-come was $17,160. These figures compare to the weighted-average poverty level for a household of four in 1994 of $15,141;4 4 in other words, most of these cases with lower debt-annual net income ratios were near or below the poverty level.4 5
The debt-income ratios of the debtors covered by the Chapter 13 Project are comparable to the debt-income ratios of the Chapter 13 debtors studied by Professors Sullivan, Warren, and Westbrook. In their study of debtors who filed for Chapter 13 relief in 1991 in ten judicial districts in Illinois, Pennsylvania, and Texas, they found a mean debt-income ratio, excluding mortgage debt, of 1.01 and a me-dian of 0.74,46 compared to 1.29 and 0.965, respectively, for debtors in the Chapter 13 Project. The debt-income ratios for the debtors in the Chapter 13 Project also were similar to those of the debtors in a study of Mississippi Chapter 13 cases filed between 1992 and 1998, who had a mean debt-income ratio of 1.41 and a median of 1.23.4 7
The debt-annual net income ratios (excluding long-term mortgage debt) naturally were somewhat lower when the entire household was 44. Poverty Thresholds: 1994, U.S. CENSUS BUREAU, available at www.census.gov/ hhes/poverty/threshld/thresh94.html.
45. The poverty levels were established by the USDA and are adjusted by annual growth in the Consumer Price Index each year. Because certain costs, such as medical and transportation expenses, have grown at a rate greater than CPI inflation, many agencies such as the Centers for Disease Control, now adjust the United States poverty figures upwards to 129% of values published by the Census Bureau. Using this adjust-ment, the poverty level for a household of four was $19,531 in 1994.
46. Teresa A. Sullivan, Elizabeth Warren & Jay L. Westbrook, Consumer Debtors Ten Years Later: A Financial Comparison of Consumer Bankrupts 1981-1991, 68 AM. BANKR. L.J. 121, 124 (1994). The standard deviation was 0.97, 25th percentile was 0.4, and 75th percentile was 1.32. In their previous study of debtors who filed for relief in 1981 in ten of the same judicial districts, Professors Sullivan, Warren, and Westbrook found a mean debt-income ratio for Chapter 13 debtors, including mortgage debt, of 1.47 with a standard deviation of 7.45, a 25th percentile of 0.36, a median of 0.62, and a 75th percentile of 1.02. See Teresa A. Sullivan, Elizabeth Warren & Jay L. Westbrook, Folk-lore and Facts: A Preliminary Report from the Consumer Bankruptcy Project, 60 AM. BANKR. L.J. 293, 324 (1986). The mean debt-income ratios found for debtors in the Chapter 13 Project were well within the standard deviations of the means found by Professors Sullivan, Warren, and Westbrook in their two studies.
In their study of debtors who filed for Chapter 13 relief in 1981 in ten judicial dis-tricts in Illinois, Pennsylvania, and Texas, they found a mean and median ratio of non-mortgage debt to income of 1.48 and 0.96, respectively, for their sample of Chapter 7 and Chapter 13 debtors. SULLIVAN, WARREN & WESTBROOK, THE FRAGILE MIDDLE
CLASS, supra note 21, at 71, table 2.5.
47. Scott F. Norberg, Consumer Bankruptcy's New Clothes: An Empirical Study of Discharge and Debt Collection in Chapter 13, 7 AM. BANKR. INST. L. REV. 415, 456-57 (1999). The Mississippi study included some mortgage debt in the computation of debt-income ratios.
CHAPTER 13
taken into account. The mean household debt-annual income ratio was 1.07, with a median of 0.855 and standard deviation of 0.904. TABLE 9. DEBT-ANNUAL NET INCOME RATIOS (EXCLUDING LONG-TERM MORTGAGE DEBT)
N Range Mean SD SEM 25% Median 75% Debtor 746 (49 0 -25.1748 1.29 1.115 0.041 0.558 0.965 1.699 D-ANI ratio missing)
Debtor
Household 743 (52 0 -25.1749 1.07 0.904 0.033 0.479 0.855 1.409 D-ANI ratio missing)
An analysis of the sample debtors' debt-annual net income ratios
by district revealed a significant relation.50 As reflected in Figure 1 below, debtors in the Western District of Pennsylvania and Southern District of Georgia had significantly higher debt-annual net income ratios than debtors in the Western District of Tennessee, Middle Dis-trict of Tennessee, and DisDis-trict of Maryland.5 1
FIGURE 1. MEAN DEBTOR DEBT-ANNUAL NET INCOME RATIO BY DISTRICT
2
Error Bars represent +1 SEM 1.8
Overall Mean D-ANI ratio (1.27)
1.6 1.4 .0 1.2 0 0.8 0.6 0.4 0.2 0 MD MDNC MDTN NDGA District SDGA WDPA WDTN
48. All ratios > 5.57 (M + 3 SD) were excluded from subsequent descriptive and inferential procedures.
49. All ratios > 6.76 (M + 3 SD) were excluded from subsequent descriptive and inferential procedures.
50. F (6,721) = 6.70, p < .001, q2 = .053.
51. These post hoc analyses were performed using Dunnett's T3 test due to the inequality of variances revealed by Levene's test.
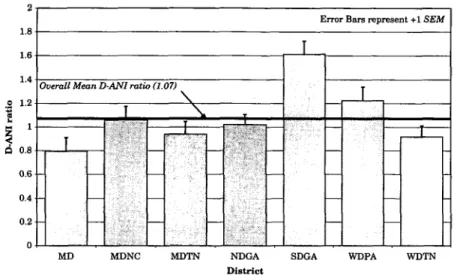
There was likewise a significant relation between district and debtor household debt-annual net income ratios.5 2 As shown in Fig-ure 2, the Southern District of Georgia had significantly higher house-hold debt-annual net income ratios than all other districts except the Western District of Pennsylvania.53
FIGURE 2. MEAN DEBTOR HOUSEHOLD DEBT-ANNUAL NET INCOME RATIO BY DISTRICT
0
Error Bars represent +1 SEM
1.8
1.6 _
1.4 Overall Mean D-ANI ratio (1.07)
1.2
--I._ _ _ __
_ _ _ _ 0 .8 0.6 0.4 0.2MD MDNC MDTN NDGA SDGA WDPA WDTN District
5. Home Ownership
Approximately 54% of the debtors in the study were homeown-ers,54 compared to the national rate of homeownership in 1994 of 64%.5 5
The rate of debtor homeownership in the Chapter 13 Project is again similar to that found in other studies of consumer bankruptcy
52. F (6,733) = 9.15, p < .001, T12 = .069.
53. These post hoc analyses were performed using Dunnett's T3 test due to the inequality of variances revealed by Levene's test.
54. Neither the Schedules, Official Bankruptcy Form 6, nor the Statement of Fi-nancial Affairs, Official Bankruptcy Form 7, includes any direct question regarding homeownership. We inferred home ownership from whether the debtor scheduled a mortgage or mobile home debt. Thus, the rate of home ownership reported here may be understated; some debtors may have owned homes without any mortgage, and some mortgage or mobile home creditors may not have been identifiable as such. 427, or 54%, of the cases indicated a mortgage or mobile home debt. We identified 16 mobile home debts in MDNC, 7 in NDGA, 5 in SDGA, and 1 each in MD and MDTN. In MDTN, we identified 42 debtors with mortgage debt, but further estimated that roughly 25 real estate mortgages were listed as priority instead of secured debts. The remaining 372 homeowners were identified as having mortgage debts.
55. Robert R. Callis, Moving to America-Moving to Homeownership: 1994-2002, CURRENT HOUSING REPORTS (U.S. Census Bureau, Washington, D.C.), Sept. 2003, at 2,
CHAPTER 13
filings. In their 1991 study of debtors in sixteen judicial districts in California, Tennessee, Illinois, Pennsylvania, and Texas, Professors Sullivan, Warren, and Westbrook found that about half of the debtors owned a home.56
There were substantial variations in homeownership rates among the seven districts. As shown in Table 10, homeownership rates ranged from a low of only 33%-just half the national rate for all Americans - in the Middle District of Tennessee to 79% in the West-ern District of Pennsylvania. These substantial variations imply very different uses of Chapter 13 by debtors in the different districts, that is, that debtors in the Western District of Pennsylvania used Chapter 13 primarily for dealing with mortgage defaults, while the great ma-jority of debtors in the Middle District of Tennessee, and nearly half of the debtors in the Northern and Southern Districts of Georgia and the Western District of Tennessee, sought Chapter 13 relief for other reasons.5 7
56. SULLIVAN, WARREN & WESTBROOK, THE FRAGILE MIDDLE CLASS, supra note 21,
at 204. See also Norberg, 7 Am. BANKR. INST. L. REV. at 457-58 (finding that approxi-mately 60% of Chapter 13 debtors filing between 1992 and 1998 in the Southern Dis-trict of Mississippi were homeowners); TERESA A. SULLIVAN, ELIZABETH WARREN & JAY L. WESTBROOK, As WE FORGIVE OUR DEBTORS: BANKRUPTCY AND CONSUMER CREDIT IN
AMERICA 129 (1999) [hereinafter AWFODI (reporting on study of Chapter 7 and Chapter 13 cases filed in 1991 in ten judicial districts in Texas, Pennsylvania, and Illinois; find-ing that 52% of Chapter 7 and Chapter 13 debtors were homeowners). Cf. Ed Flynn & Gordon Bermant, Bankruptcy by the Numbers... Be it ever so humble, there's no place like home, available at http://www.usdoj.gov/ust/eo/public-affairs/articles/docs/abi 08 2003.htm (last visited May 19, 2006) (reporting national home ownership rate of 42% for Chapter 7 debtors in 5832 cases filed between 1999 and 2001, with variations among states ranging from 27% to 60.4%); Ed Flynn & Gordon Bermant, Bankruptcy by the Numbers, The Class of 2000, available at http://www.usdoj.gov/ust/eo/public
affairs/ar-ticles/docs/abi0loctnumbers.html (reporting 41.8% home ownership rate for Chapter 7 debtors in 1931 no-asset Chapter 7 cases filed in 2000).
57. A chi-square analysis indicated differential rates of homeownership across the districts studied, 112 (6, N = 795) = 67.09, p # .001. The homeownership rate in MDTN (32.0%) was lower than expected, and homeownership rates in MD (57%), MDNC (58%), and WDPA (79.0%) were higher than expected. However, chi-square analysis did not reveal a significant relationship between homeowner status and case disposition, -12 (4,
N = 795) = .664, p = .956. 20061
TABLE 10. FREQUENCY OF HOMEOWNERSHIP BY DISTRICT
District Do not own home (percent) Homeowner (percent)
MD 42 (42%) 58 (58%) MDNC 43 (43%) 57 (57%) MDTN 67 (67%) 33 (33%) NDGA 83 (50%) 82 (50%) SDGA 49 (49%) 51 (51%) WDPA 21 (21%) 79 (79%) WDTN 63 (48%) 67 (52%)58 Total 368 (46%) 427 (54%)
C. PREVIOUS AND SUBSEQUENT BANKRupTcy FILINGS
The study also investigated bankruptcy filings by the debtors before and after the sample case. Data were obtained from two sources: the Statement of Financial Affairs, which requires the debtor to disclose any previous filings, and electronic searches of each dis-trict's PACER database. The available data probably somewhat un-derstate the incidence of other bankruptcy filings by the sample debtors. The PACER databases reach back before 1994 by no more than five years and are more limited in some districts than others; indeed, the PACER system reaches back only one or two years before 1994 in several of the sample districts.5 9 Thus, many previous filings
were ascertainable only from the debtor's disclosure in the Statement of Financial Affairs, which is not entirely reliable on this point.60
Fur-ther, the PACER searches for subsequent filings were done in 2002, so that any filings after that time are not included in the data set; and the district PACER systems are not connected to a national database, and therefore do not reveal when a debtor has filed a petition in an-other jurisdiction. The searches also might have missed some cases in which the sample case was a joint filing, but a previous or subsequent filing was an individual filing, or vice versa.
58. Includes twenty-five cases in which mortgage debt apparently was listed as priority debt.
59. The following chart indicates the reach of the PACER system in each district for ascertaining previous bankruptcy filings:
NDGA SDGA MDTN WDTN MDNC WDPA 1MD
1992 1989 1992 1991 1993 1986 1990
60. Comparison of the debtors' statements of financial affairs to the PACER search results in the Mississippi study found that nearly 25% of debtors who had filed a previ-ous petition did not report it in their statement of financial affairs in the sample case. Norberg, 7 AM. BANxi. INST. L. REV. at 458, 458 n.128.