Predicting the Academic Performance of International
Students on an Ongoing Basis
Binglan Han
Information Technology Programme
Auckland Institute of Studies
Auckland, New Zealand
[email protected]
Michael J. Watts
Information Technology Programme
Auckland Institute of Studies
Auckland, New Zealand
[email protected]
ABSTRACT
The academic success of international students is crucial for many tertiary institutions. Early predictions of students’
learning outcomes allow for targeted support and therefore improved success rates. In this study, international students’
demographic information, past academic histories, weekly class attendance records, and assessment results in an ongoing
course were used to develop models to predict student success and failure in the course on a weekly basis. The prediction
models were produced with three decision tree classification algorithms: REPTree, J48 tree, and LMT on the data-mining
platform WEKA. Of these, the LMT algorithm has the highest level of accuracy, but the REPTree and J48 models are
simpler and easier to interpret. While the accuracies of all three models are above 75%, further research is needed to more
accurately predict student failure at early stages.
Keywords
: academic performance, decision trees, international students, educational data mining
1.
INTRODUCTION
The New Zealand tertiary sector attracts a large number of international students, and the academic success of these students is vital for many institutions and to a certain extent, for the nation’s economy. However, international students face many challenges, such as overcoming social and language barriers; therefore, they are more likely to struggle in their studies. If the study outcomes of international students can be predicted on an ongoing basis during their course of study, and the students at risk of failure can be identified early on, then targeted support can be provided in a timely manner to help such students improve and succeed. A student’s academic performance may be affected by various factors including their academic history, socio-economic condition, family circumstance, learning styles, and cognitive and meta-cognitive characteristics. Not all of these factors are readily available or easily retrievable due to privacy reasons as well as technological and economic constraints. Thus, a prediction model based on the data sources available in most institutions’ IT systems is significantly more feasible.
Predicting student academic performance is a major theme in the field of educational data mining (EDM). Predictive models are often developed with various classification algorithms that group the objects in a data collection into classes with given labels. A classification model is normally built by learning from a training set where all objects are already associated with known class labels, and the model is then used to classify new objects. Various classification methods have been applied to forecast student academic performance - including decision trees, classification and regression trees, logistic regression, Bayesian classification, support vector machine, neural network (Durga devi, 2015). Among these methods decision trees were the most commonly used type of algorithm possibly because most decision trees are relatively easy to implement and interpret.
Kovacic (2010) used enrolment data to predict student success and failure, and classification accuracies of 59.4% and 60.5% were reported for the decision tree algorithms CHAID and CART respectively. Bharadwaj and Pal (2011) applied the ID3 decision tree to forecast student marks at the end of a semester using previous semester marks, internal assessment results, and attendance records of classes and labs. Yadav and Pal (2012) predicted student academic performance using previous schools grades, gender, living conditions, and parents’ social-economic data, and the prediction accuracies of the ID3, CART and C4.5 decision algorithms were around 62.22%, 62.22% and 67.77% respectively. Sarker, et al (2013) explored the institutional internal and external data sources for predicting students’ first year mark, and it was found that the model using both internal and external data performs better than the one based only on internal databases.
This paper presents a pilot study for a research project at Auckland Institute of Studies (AIS). The purpose of this research project is to develop a prediction model that can predict student success and failure in a semester. The intention is to embed the model within the institute’s Student Management System (SMS) to run every week, so that lecturers will have up-to-date indications of students who need assistance. In this pilot study several decision tree algorithms were tested to develop prediction models that provide weekly forecasts of student success and failure using data on international students enrolled in the Information Technology Program at AIS.
2.
METHODOLOGY
The objective of this pilot study was to demonstrate that it is possible to predict a student’s success or failure in an ongoing paper on a weekly basis using data available in the institute’s SMS, including the student’s past academic history data, demographics data, and the student’s weekly attendance and progress data in a current paper.
2.1
Data Preparations
Three datasets were retrieved from AIS SMS:
This quality assured paper appeared at ITx 2016, incorporating the 7th annual
conference of Computing and Information Technology Research and Education New Zealand (CITRENZ2016) and the 29th Annual Conference of the National
Advisory Committee on Computing Qualifications, Wellington, New Zealand, July 11-13, 2016. Michael Verhaart, Emre Erturk, Aaron Steele and Scott Morton (Eds).
The “student demographic” dataset had 64 records, and each record represented a student and contains the gender, age, and ethnicity of the student.
The “student academic history” dataset had 334 records, each of which contained a student’s grade and attendance information in papers previously sat by the student. The “student weekly attendance and progress” dataset had
69 records, and each record contained 14 weeks’ (a whole semesters’) attendance records and assessment marks of a student for a current paper, in which the student’s success and failure is to be predicted.
As each paper has its own assessment schedule, the weekly assessment data does not have a consistent meaning across different papers. To deal with this problem, a new attribute called an “achievement ratio” is introduced to represent a student’s current learning status. The achievement ratio of a particular week is the ratio of the total assessment marks a student has obtained to the maximum assessment marks a student can possibly obtain from Week 1 to the current week. Instead of using a single week’s data, the accumulative average of weekly attendance is used, so that the model’s prediction is based on the behaviour of a student in both previous weeks and the current week.
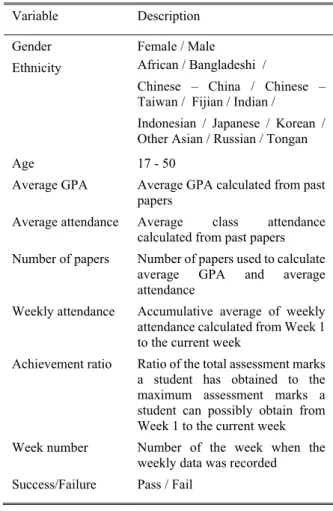
In order to produce weekly predictions of student success and failure, the three datasets were processed and combined into a single dataset. After removing several records with missing or erroneous data, 941 records are included in the dataset. The Chi-squared test and Analysis of Variance were used to identify the significant contributing factors to the students’ academic performance, which are students’ gender, ethnicity, previous GPA, attendance, number of papers studied, current weekly attendance, and course work marks, as shown in Table 1.
During the first few weeks of a semester there are usually no assessments, so the variable “achievement ratio” has no real meaning. The value of the achievement ratio could be set as 1 if there is no assessment data available, but this treatment will introduce inconsistency to the value of this variable; for example, a student who actually scored low assessment marks may have a perfect achievement ratio in the first few weeks. In an attempt to solve this problem, the above dataset was divided into two subsets:
The dataset without assessment – the dataset containing the data collected before any assessment has been performed and with no “achievement ratio” attribute. There are 318 records in this dataset.
The dataset with assessment – the dataset containing the data collected after assessments have been performed and with the “achievement ratio” attribute defined. There are 623 records in this dataset.
The number of records in the dataset with assessment is significantly larger than that in the dataset without assessment as most IT papers at AIS usually have relatively early assessments.
2.2
Prediction Model Development
We used WEKA to develop the prediction model. WEKA is an open source Java library that implements a large collection of machine learning algorithms for classification, regression, attribute selection, and clustering. Weka prodvides a unified interface for the libraries so that the learning algorithms can be used in various data mining applications (Holmes et al., 1994).
The Weka built-in graphical user interface “Explorer” was used to create and validate models.
The focus of this study is classification tree models - due to their advantageous characteristics. Firstly, tree models can be constructed relatively quickly with similar or better accuracy compared to other classification methods. Secondly, the results of most tree models are expressed as explicit conditions on the predictors, and are easy for users to interpret and use. Thirdly, decision tree classifiers are not parametric, which means they can capture non-linear relationships and interactions between independent and dependent variables in complex settings. Fourthly, some tree models can directly deal with all types of predictors - including continuous, discrete, and nominal variables (Tuffery, 2011).
Table 1: List of attributes
Variable Description Gender Female / Male
Ethnicity African / Bangladeshi / Chinese – China / Chinese – Taiwan / Fijian / Indian /
Indonesian / Japanese / Korean / Other Asian / Russian / Tongan
Age 17 - 50
Average GPA Average GPA calculated from past papers
Average attendance Average class attendance calculated from past papers
Number of papers Number of papers used to calculate average GPA and average attendance
Weekly attendance Accumulative average of weekly attendance calculated from Week 1 to the current week
Achievement ratio Ratio of the total assessment marks a student has obtained to the maximum assessment marks a student can possibly obtain from Week 1 to the current week Week number Number of the week when the
weekly data was recorded Success/Failure Pass / Fail
After initial experimentation with the tree classifiers available in WEKA, the following three decision tree algorithms were selected for further exploration due to their superior accuracy. Reduced Error Pruning Tree (REPTree)
REPTree is a fast decision tree learner which uses information gain for discrete attributes and variance minimization for numeric attributes as the splitting criteria for tree creation, and applies the reduced error pruning method for tree optimization. As a fast and simple post-pruning method, the reduced pruning starts at the leaves, and each node is tested by being replaced with the most popular class. If the prediction accuracy is not affected then the change is kept. A parameter “number of folds” is defined in WEKA REPTree classifier to specify the proportion of data that is held back for the pruning operation (Witten & Frank, 2005).
The J48 algorithm is the WEKA implementation of the C4.5 decision tree algorithm proposed by Quinlan (1993). The J48 algorithm uses a measure called “gain ratio” to construct a non-binary decision tree: the variable with the highest normalised gain ratio is marked as the most predictive attribute, and a node is split based on this attribute. It deals with numeric attributes by determining where thresholds for decision splits should be placed. Two pruning operations may be used in the J48 algorithm. The first operation is subtree replacement, in which a subtree may be replaced with a leaf based on error estimation. This operation starts from the leaves and works backwards toward the root. The second operation is subtree raising. In this case, a node may be moved upwards towards the root of the tree, replacing other nodes along the way. The default pruning method is subtree replacement. The main parameters that can be set for the WEKA J48 classifier are the confidence threshold and the minimum number of instances per leaf.
Logistic Model Tree (LMT)
A logistic model tree consists of a standard decision tree structure with logistic regression functions specified for each leaf. By combining a decision tree with logistic regression models, LMT is able to deal with datasets with various sizes and noise levels. The LMT may be simplified into a logistic model if the dataset is small and/or the noise level is high, and a tree structure is added when there is adequate data available. The tree in LMT contains binary splits on numeric attributes and mulitway splits on discrete ones. LogitBoost algorithm is used to create logistic regression functions on the tree nodes. Discrete attributes are binarised so that they can be included in the regression functions. LMT often produces more accurate models than those developed with other decision tree algorithms. Due to the nature of logistic functions, the classification rules are not as easy to interpret as those of a standard decision tree (Landwehr, et al, 2005). The logistic model defined in a leaf node calculates the membership probabilities of a class variable as:
Pr x e ∑ e (1)
F x α ∑ α v (2)
Where
Pr x = membership probability for class j F x = linear regression function for class j x = vector of all attributes values v = value of individaul attribute i
α = coefficients of regression function for class j α = constant of regression function for class j The input parameters defined in the WEKA LMT classifier include the settings for LogitBoost algorithms and the minimum number of instances at which a node can be split. While applying the above classifiers on the student datasets to produce prediction models, the following factors are used to evaluate the quality of the models:
Accuracy – the model’s accuracy is measured by the percentage of correctly classified instances.
Complexity – the overall model complexity is decided by the structure of the decision tree, and the complexity of the additional models attached to the tree nodes in the case of LMT.
Interpretability – the model’s interpretability is evaluated by determining whether the model’s prediction can be
expressed as explicit conditions on the predictors, and if the prediction can be explained with a common understanding of the effects of predictors on students’ learning outcomes.
3.
RESULTS AND DISCUSSION
For each tree classification algorithm, two prediction models were developed, resulting from two datasets – the datasets with and without assessment respectively. The stratified 10-fold cross validation method was used to validate and evaluate the models.
3.1
REPTree Models
The values of input parameters for the REPTree classifier are shown in Table 2. The default values were taken for the parameters that are not included in the table.
Table 2: Input parameters of REPTree classifier
Parameter Value Minimum number of instances per leaf 5
Maximum tree depth 5
Number of folds for reduced error pruning 3 Minimum variance for splitting numeric
variable 0.001
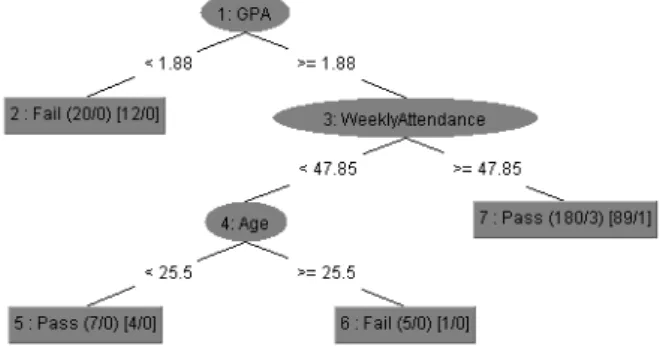
Figure 1 shows the REPTree model created based on the dataset without assessment, which can be used to predict student success and failure when no assessment is conducted. Out of nine independent attributes, the model uses three attributes for prediction – GPA, weekly attendance, and age.
Figure 1: REPTree model for the dataset without assessment
Figure 2 shows the REPTree model created based on the dataset with assessment, which can be used for predicting student success and failure after assessments begin. Out of nine independent attributes, the model uses four attributes for prediction – achievement ratio, number of papers, GPA, and average weekly attendance.
The rules for predicting student performance can be derived from the above two models. According to the models, a younger student with a higher GPA, achievement ratio, and weekly attendance has a better chance of passing the current paper, which is consistent with the common understanding of the effects of those attributes on student success and failure: A student’s previous average GPA generally represents
his or her skills, knowledge, ability, and attitude for learning.
A student’s achievement ratio could represent the skills and knowledge he or she has gained in the current paper. A student’s average weekly attendance indicates the effort
The number of papers a student takes, if relatively high, could demonstrate the penchant he or she has for learning – and vice versa.
An older student is more likely to have family or other domestic commitments.
Figure 2: REPTree model for the dataset with assessment
3.2
J48 Tree Models
The values of input parameters for the J48 Tree classifier is shown in Table 3. The default values were taken for the parameters that are not included in the table.
Table 3: Input parameters of J48 Tree classifier
Parameter Value Minimum number of instances per leaf 5
Confidence threshold for pruning 0.25
Subtree raising pruning No
Subtree replacement pruning Yes Figure 3 shows the J48 Tree model created based on the dataset without assessment. The model contains the same predictors (GPA, weekly attendance, and age) and tree structure as the corresponding REPTree model. However, the differences in the values of splitting criteria led to significant differences in the numbers of instances in leaf nodes.
Figure 4 shows the J48 Tree model created based on the dataset with assessment. The model contains the same predictors (GPA, weekly attendance, and age) as the corresponding REPTree model, but has a different tree structure and therefore different prediction rules also.
Figure 3: J48 Tree model for the dataset without assessment
Figure 4: J48 Tree model for the dataset with assessment
Similar to the REPTree models, the J48 models reveal that a student with a higher GPA, achievement ratio, and weekly attendance has a better chance of passing the current paper, that the ‘age’ is a contributing factor in the model on the dataset without assessment, and the “number of papers” in the model on the dataset with assessment.
3.3
LMT Models
The values of input parameters for the LMT Tree classifier is shown in Table 4. The default values were taken for the parameters that are not included in the table.
Table 4: Input parameters of REPTree classifier
Parameter Value Minimum number of instances at which a
node can be split 20
Set fixed number of iterations for LogitBoost No Use cross-validation for boosting at all nodes
(i.e., disable heuristic) No
For the dataset without assessment, the created LMT model contains a single leaf node, which means the LMT model is simplified into a single logistic regression model. The LR model is specified by Equation (1) and (2), and the linear regression function for the class “Success” is displayed as follows:
Linear regression function for class “Success” =
-6.39 + [Gender] * -1.22 + [Ethnicity=Other Asian] * -4.6 + [Ethnicity=Tongan] * -1.01 + [GPA] * 3.27 + [NumberOfPapers] * 0.08 + [WeeklyAttendance] * 0.01 (3)
Only the linear regression function for the class “Success” is presented, as the coefficients in the linear regression function for the class “Fail” have the same values but opposite signs. According to the LR model, student success is positively correlated with GPA, weekly attendance, and the number of papers taken, and negatively correlated with the male gender, and two binarized attributes, ‘Ethnicity=Tongan” and “Ethnicity=other Asian”.
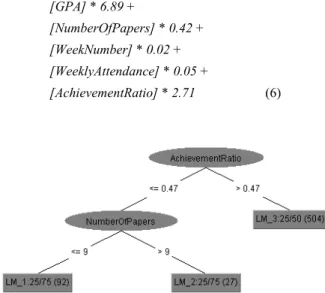
Figure 5 shows the LMT decision tree created on the dataset with assessment. The linear regression functions in the logistic models associated with the three leaf nodes are shown in Equations (4) – (6). The LMT has a simple decision tree with only two attributes, and the prediction is mainly achieved with three LR models, which involves six attributes. According to the LR models, an Indian or Chinese student with a good GPA, weekly attendance, and achievement ratio has a good chance of succeeding in the paper he or she is currently studying.
Leaf node LM1: -425.41 + [Ethnicity=Chinese - China] * 0.46 + [Ethnicity=Indian] * 5.62 + [Ethnicity=Other Asian] * -2.46 + [Ethnicity=Tongan] * -11.02 + [GPA] * 1.69 + [NumberOfPapers] * 0.69 + [WeekNumber] * -0.12 + [WeeklyAttendance] * 4.16 + [AchievementRatio] * 17.2 (4) Leaf node LM2:
Linear regression function for class “Success” = -13.31 + [Ethnicity=Chinese - China] * 0.46 + [Ethnicity=Indian] * 5.62 + [Ethnicity=Other Asian] * -2.46 + [Ethnicity=Tongan] * -3.63 + [GPA] * 1.69 + [NumberOfPapers] * 0.69 + [WeekNumber] * -0.12 + [WeeklyAttendance] * 0.12 + [AchievementRatio] * 17.2 (5) Leaf node LM3:
Linear regression function for class “Success” = -16.39 + [Gender] * -0.49 + [Age] * -0.11 + [Ethnicity=Chinese - China] * 0.46 + [Ethnicity=Indian] * 0.14 + [Ethnicity=Other Asian] * -2.46 + [Ethnicity=Tongan] * -1.09 + [GPA] * 6.89 + [NumberOfPapers] * 0.42 + [WeekNumber] * 0.02 + [WeeklyAttendance] * 0.05 + [AchievementRatio] * 2.71 (6)
Figure 5: LMT model for the dataset with assessment
3.4
Comparison of Prediction Models
Stratified 10-fold cross-validation was used to validate and evaluate the predication models. In cross-validation, the original data set is divided into ten equal-sized subsets. The subsets are selected so that each subset contains roughly the same proportions of the records labelled with “pass” and “fail”. Out of the ten subsets, one subset is retained as the validation data, and the remaining nine subsets are used to produce a classifier. The cross-validation process is repeated ten times, with each of the ten subsets used only once as the validation data. The ten validation results are combined to produce a single estimation, from which the accuracy matrix of a classifier can be retrieved. The accuracies calculated with 10-fold cross-validation are slightly different from the actual classifier, as the actual classifier is always produced with the entire data set in WEKA, but the classifiers in cross-validation use 90% of the dataset.Tables 5 and 6 show the accuracy of the classification models based on the datasets without and with assessment. The accuracy is measured as the percentage of correctly classified students. By comparing the measures of model accuracy, three observations can be stated:
LMT classifiers perform best and REPTree models perform worst in terms of accuracy.
The classification based on the dataset without assessment is significantly less accurate than that based on the dataset with assessment.
The predictions of student failure are less accurate than the predictions of student success.
Table 5: Accuracy of classification models on the dataset without assessment by rates of correctly classified instances Model Correctly classified “pass” records Correctly classified “fail” records Correctly classified total records REPTree 99.3% 76.2% 96.2% J48 99.6% 83.3% 97.5% LMT 99.3% 90.5% 98.1%
Table 6: Accuracy of classification models on the dataset with assessment measursed by rates of correctly classified instances Model Correctly classified “pass” records Correctly classified “fail” records Correctly classified total records REPTree 98.5% 90.2% 97.3% J48 99.2% 94.6% 98.6% LMT 100% 96.7% 99.5%
In Table 5 the rate of correctly classified “fail” records using the REPTree model is 76.2%, which means that the REPTree model on the dataset without assessment classifies 23.8% of students who failed as “successes” at the early stages of their courses. The main purpose of this research is to identify at-risk students early, which requires high accuracy in predicting student failure based on the dataset without assessment. Therefore the performances of the REPTree models may not be acceptable.
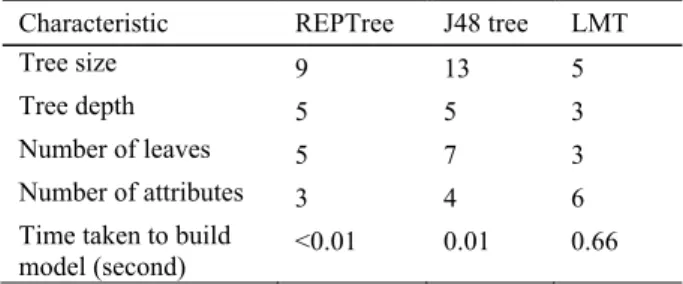
Tables 7 and 8 summarise the characteristics of the classification models related to simplicity. According to the tables below, the LMT models have the most simple tree structures, and the REPTree and J48 models have similar levels of simplicity. However, the logistic regression models associated with the leaf nodes added complexity to the LMT models.
Table 7: Simplicity of classification models based on the dataset without assessment
Characteristic REPTree J48 tree LMT
Tree size 7 7 1
Tree depth 4 4 1
Number of leaves 4 4 1
Number of attributes 3 3 5
Time taken to build
model (second) <0.01 <0.01 0.26
Table 8: Simplicity of classification models based on the dataset with assessment
Characteristic REPTree J48 tree LMT
Tree size 9 13 5
Tree depth 5 5 3
Number of leaves 5 7 3
Number of attributes 3 4 6
Time taken to build
model (second) <0.01 0.01 0.66
While the predictions of the REPTree and J48 models can be expressed as explicit conditions on the predictors, it is difficult to gain insight and retrieve clearly-defined classification rules from the logistical functions in the LMT models; thus, we can conclude that the LMT models are the least interpretable.
4.
CONCLUSION
International students’ demographic information, past academic history, weekly class attendance records, and assessment results in an ongoing paper were used to develop models to predict student success and failure on a weekly basis. The data was grouped into two datasets based on the existence
of assessment data. The prediction models were produced with three decision tree classification algorithms: REPTree, J48 tree, and LMT on the data-mining platform WEKA. Based on attributes selected by the classification algorithms, the contributing factors to student academic performance are previous GPA, weekly class attendance, assessment grades in a current paper, the number of past papers taken, ethnicity, and age. LMT models perform best and REPTree models perform worst in terms of accuracy. REPTree and J48 models are more simple and easier to interpret than LMT models. While the accuracies of all models are above 75%, the LMT, J48, and REPTree models incorrectly classified 9.5%, 16.7%, and 23.8% failed students as “successes” in the early stages of courses respectively. As the main purpose of this research was to identify at-risk students early to provide extra support for them, more research is needed to produce more accurate predictions of student failure early on.
5.
ACKNOWLEDGEMENTS
The authors acknowledge the assistance of the Software Development Unit at AIS, who provided us with the data used in this project.
6.
REFERENCES
Bharadwaj, B.K., & Pal., S. (2011). Mining educational data to analyze students’ performance. International Journal of Advance Computer Science and Applications (IJACSA),
2(6), 63-69.
Durga devi, C. R. (2015). A survey on forecasting students performance using EDM. International Journal of Science
Technology & Engineering (IJSTE). 2(1), 73-76.
Holmes, G., Donkin, A., & Witten, I.H. (1994). Weka: A machine learning workbench. Proc Second Australia and New Zealand Conference on Intelligent Information
Systems, Brisbane, Australia. Retrieved from
www.cs.waikato.ac.nz/~ihw/papers/94GH-AD-IHW-WEKA.pdf.
Kovacic, J.Z., & Green, J. S. (2010). Predictive working tool for early identification of ‘at risk’ students. Open Polytechnic, New Zealand. Retrieved from
https://akoaotearoa.ac.nz/download/ng/file/group- 6/predictive-working-tool-for-early-identification-of-at-risk-students---full-report.pdf
Landwehr, N., Hall, M., & Frank, E. (2005). Logistic Model Trees. Machine Learning. 95(1-2):161-205.
Quinlan, R. (1993). C4.5: Programs for Machine Learning. Morgan Kaufmann Publishers, San Mateo, CA
Sarker, F., Tiropanis, T., & Davis, H. C. (2013) Students’ performance prediction by using institutional internal and external open data sources. At CSEDU 2013: 5th International Conference on Computer Supported
Education, Aachen, Germany, 06 - 08 May 2013. 8pp
Tuffery, S. (2011). Data Mining and Statistics for Decision
Making. John Wiley & Sons, New York.
Witten, I. H. & Frank, E. (2005) Data Mining Practical
Machine Learning Tools and Techniques, Second Edition,
Morgan Kaufmann Publisher, United States of America, 2005.
Yadev, S. K., & Pal., S. (2012). Data mining: a prediction for performance improvement of engineering students using classification. World of Computer Science and Information