BANK ·OF FINLAND
DISCUSSION PAPERS
Peter Nyberg - Vesa VihrUiUi Financial Markets Department
29.4.1993
The Finnish Banking Crisis and Its Handling
Suomen Pankki Bank of Finland
BANK OF FINLAND DISCUSSION PAPERS 8/93
Peter Nyberg - Vesa VihriaHi Financial Markets Department
29.4.1993
ISBN 951-686-370-1
ISSN 0785-3572
Abstract
The paper gives a brief description of the evolution of the Finnish banking crisis and its handling. In the first section, the salient features of the Finnish banking system are described. We then briefly discuss the liberalization process, mac-roeconomic and regulatory policies, and the subsequent credit boom and its development into a recession of unprecedented depth. Next, we document the impact on bank profitablity of the drastic changes in macroeconomic conditions. The collapse and rescue of Skopbank are summarized.
In section 2 we describe the public safety net, starting with the pre-crisis arrangements. This is followed by an exposition of the new me_asures taken in 1992, with the emphasis on the establishment of the Government Guarantee Fund, its organization, powers and principles of operation.
Section 3 gives an account of the support measures taken by the Goverment Guarantee Fund in the course of 1992 and in early 1993. Section 4 describes the reform of the bank support arrangements in the early months of 1993.
Finally, in section 5, we discuss the banks' current economic environment and their prospects in the near future. We also take up some of the major issues of principle relating to the rationalization of the banking sector.
The paper includes references to recent articles and discussion papers dealing with important aspects of the current banking crisis. The list of references is by no means exhaustive, and it is designed mainly to help foreign readers to find supplementary material. Therefore only those papers in Finnish or Swedish which have to do directly with the current crisis are included.
Contents
Page
Abstract 3
1 Banks and the Finnish Economy 7 1.1 Bank intermediation dominates 7 1.2 Excess banking capacity 8 1.3 Bad banking and bad policies in the 1980s 10 1.3.1 Financial liberalization 10 1.3.2 Unconstrained stock adjustment starts 11
1.3.3 Positive shocks give a further boost 13
1.3.4 Policy response: late and little 15 1.4 From boom to bust 17 1.4.1 Adjustment begins 17 1.4.2 Output hit by bad luck 17
1.4.3 Financial risks materialize 19 1.5 The first bank failure: Skopbank 22 1.5.1 Risky strategy backfires 22 1.5.2 Liquidity crisis prompts action 22 1.6 Banks' losses soar 23 1.6.1 The economy continues to contract 23 1.6.2 Problem assets and losses mount 23 1.6.3· Nordic countries: some pareIlels 24
2 The Safety Net 26
2.1 The system prior to the crisis 26 2.1.1 . Security funds 26 2.1.2 Lender of last resort 27 2.1.3 Bank supervision 27 2.2 New elements in the safety net 28 2.3 General capital injection 28 2.4 The Government Guarantee Fund 29
2.4.1 Organization 29
2.4.2 Objectives and guidelines 30 3 Support Programmes Implemented 31
3.1 Skopbank 31
3.2 Saving bank of Finland (SBF) 31
3.3 STS-Bank 32
3.4 Resources used 33
4 Expanding the Safety Net 36
4.1 Problem bigger than expected 36
4.2 Comprehensive reform proposal 36
4.3 More resources in a supplementary budget 37
4.4 Administrative reform 37
4.5 Parliament reaffirms commitment to banks 38
5 Outlook 39
5.1 Macroeconomic situation 39
5.1.1 Exports grow but domestic sectors still weak 39
5.1.2 Interest rates down, share prices up 39
5.1.3 Growth remains slow, external balance impr~ves 39
5.2 Near-term prospects for the banking sector 40
5.3 Structural issues 41
1
Banks and the Finnish Economy
1.1
Bank intermediation dominates
Deposit banks are central to the Finnish financial system. The bulk of financial intermediation takes place through deposit banks. Thus, some 50 per cent of the financing needed by the public (the corporate and household sectors) is provided directly by deposit banks (Chart 1). In addition, banks have guaranteed about half of the lending by insurance companies. Also, with one exception, all mortgage institutions and the largest finance companies are subsidiaries of deposit bank groups. In all, about two-thirds of the credit risks associated with the borrowing by the public is carried by the banks. The role of the banks is especially predo-minant in the case of households and small and medium-sized businesses.
Chart 1. Composition of the liabilities of the public, 31 Dec. 1990*
1 Banks 49.4 %. 2 Public 5.2 %.
3 Foreign sector 9.3 %. 4 Public sector 10.1 %.
S Other financial institutions 9.4 %.
6 Insurance institutions 16.6 %.
* Statistics Finland: Financial Market Statistics 1992:24.
In the second half of the 1980s, securities markets developed rapidly and the abolition of exchange controls allowed the private sector to borrow from and invest abroad freely. This improved the availability of finance from sources other than the banks. Particularly foreign borrowing was widely used, starting in the mid-1980s, although more than half of this financing was intermediated by the
banks. The increase in the share of non-bank finance may partly reflect excep-tionally favourable macroeconomic conditions, and might not have obtained quite such a high level in more normal times despite increased competitive pressures.
The role of the banks in Finland is important not only as a source of finance but also as regards the control of companies. The Finnish banks are of the uni-versal type and are thus engaged in various investment bank activities and have significant stakes in non-financial companies. Therefore, banks are able (and quite often willing) to exercise strong influence over financial and strategic decisions in many enterprises.
The banking system comprises five major bank groups and a number of smaller commercial banks, some of which are fully-owned subsidiaries or branches of foreign banks. Formally, there are a large number of in~ividual banks, as the co-operative banking group consists of 310 individual banks and the savings bank group of 41 savings banks (end-1992 figures). However, in many important respects, the co-operative banks operate as one entity, as do the savings banks. Despite some specialization, all major banking groups are active in most geographical and business areas.l
1.2
Excess
banking
capacity
The banks' service network in Finland is large and technically very efficient. However, because of its size, it is also costly.
Up to the mid-1980s, direct price competition was all but impossible due to regulation. Competition took the indirect form of attracting low-cost deposits by building large branch networks and investing heavily in automated payment and other banking technologies. The result was that Finland now not only has more banking personnel and branches per capita than the neighbouring Nordic countries, but also one of the densest and most advanced networks of automated teller machines and point-of-sale terminals in the world (Table 1).
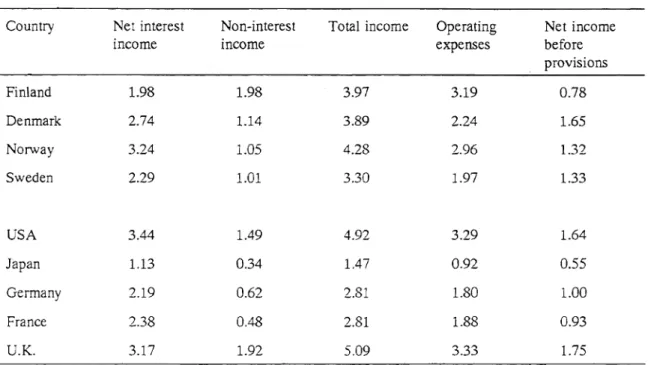
The extensive resource use is reflected in operating costs, which are high by international standards. However, banks' total income is not exceptionally high (Table 2).2 Therefore, the high operating costs result in weak underlying profita-bility and constitute evidence of substantial excess capacity in the industry.
In recent years, banks' use of resources has started to decline. The number of employees had been cut by some 20 per cent by the end of 1992 from its peak in 1989 (Chart 2). A similar change has occurred in the number of branches. However, labour costs have not come down correspondingly.
1 For a fairly recent general description of the Finnish financial system, see Bank of Finland (1991). A detailed account of the banking system is given by the Finnish Bankers' Association (1991).
2 International comparisons are obviously problematic, as institutional set-ups and economic
environments vary a great deal between countries. For example, in bank-dominated economies (Germany, Japan, Finland) banks' balance sheets are bolstered by low-income, low-risk interme-diation, which in other countries may be taken care of by special housing finance institutions or by securities markets. Given the many similarities of the Nordic countries, comparisons between them are likely to be the most useful ones.
Table 1. Banking capaticity in the Nordic countries
Per 10 000 inhabitants End of 1991
Branches Staff ATM EFTPOS
Finland 6.2 (8.2)1 93.6 (104.4i 5.8 67.0
Sverige 3.7 (5.9)1 55.0 (83.1/ 2.5 9.7
Norway 3.9 59.2 4.1 37.4
Danmark 5.0 99.5 2.1 37.8
1 Incl. post offices.
2 Incl. post office personnel in customer service (5 420).
3 rncl. post office personnel in customer service (18 415), personnel of the postal giro system
(3 840) and personnel in the housing finance institutions.
Table 2. Bank profitability in selected countries
Per cent of balance sheet total, average 1985-1990*
Country Net interest Non-interest Total income Operating Net income
income income expenses before
provisions Finland 1.98 1.98 3.97 3.19 0.78 Denmark 2.74 1.14 3.89 2.24 1.65 Norway 3.24 1.05 4.28 2.96 1.32 Sweden 2.29 1.01 3.30 1.97 1.33 USA 3.44 1.49 4.92 3.29 1.64 Japan 1.13 0.34 1.47 0.92 0.55 Germany 2.19 0.62 2.81 1.80 1.00 France 2.38 0.48 2.81 1.88 0.93 U.K. 3.17 1.92 5.09 3.33 1.75
Chart 2. Banking employment, number of personnel 60000 6 0000 ~ ~
~ ~
~
~ ~ ~~
~ ~ t'\~
~ ~ ~ ~~
~
~ ~~
~ ~~
~ 50000 50000 40000 40000 30000 30000 20000 20000 10000 10000 ... L-' - ' - L... o o 76 77 7B 79 80 B1 B2 B3 84 B5 B6 B7 BB B9 90 91 92_ Domestic commercial banks* ~ Postipankki (Post-Office bank)
P77A
Co-operative banks .~ Savings banks
F=I
Foreign-owned banks* Inc!. Postipankki and STS-bank from 1988 and 1990, respectively.
1.3
Bad banking and bad policies in the 1980s
1.3.1 Financialliberalization
Deregulation of the financial markets started in the early 1980s (Chart 3). Already in 1980, the links to foreign short-term markets were greatly strengthened by allowing the banks to borrow freely in foreign money markets to cover the forward currency exposure they could equally freely supply to commercial customers. The first foreign banks were established (as subsidiaries) in the Finnish market in 1983, resulting in more intensive competition in the market for foreign exchange and in the emerging money market.
Interest rate deregulation got under way in 1983 with measures on the lending rate side. This gradual process was completed in 1986, when banks were allowed to determine freely the level of interest rates on new loans. Major steps to liberalize capital movements were taken in 1986 and 1987 by allowing long-term borrowing without restriction for selected sectors and for all nonfinancial companies.
A true money market was established by exempting bank CDs from the cash reserve requirement and agreeing on a code of conduct to be applied in money
market operations (to ensure that the market operated in all circumstances, the Bank of Finland issued its own CDs as needed). Furthermore, the Bank of Finland discontinued its practice of periodically issuing guidelines on credit policy to the banks. Borrowing and lending decisions were thus left to the market participants alone for the first time in decades. Although the process of liberalization continued until 1991, the most important decisions were taken in 1986 and 1987.3
Chart 3. Financial market liberalization in Finland
D 0 M E S T c F 0 R E I G N
RElAXATION OF LENDING RATE REGULATION: PASS-lHROUGH FORMULA
111980 I1 I I 1 I 1 1 I I
EQUAL ENTRY FOR FOREIGN BANKS TO lHE CALL MONEY MARKET
I
CALL MONEY DEPOSIT RATE SEPARATED FROM lHE CREDIT RATE ABOUTlON OF REGULATION OF LENDING RATES
FLOATING RATES ALLOWED ON SOME LOANS CD'S EXEMPT FROM RESERVE REQUIREMENT
OPEN MARKET OPERATIONS INTRODUCED HEUBOR RATES INTRODUCED
CREDIT GUIDEUNES DISCONTINUED FLOATING RATES ALLOWED ON ALL LOANS
,RIME RATES ALLOWED AS REFERENCE RATES
111983 198411 985 1986 1987 1988 I 1989 ! 1990 1991 I 1992 ~
F~EEFOREXBORRO~NG FOR HOUSEHOLDS
FREE SHORT·TERM CAPITAL MOVEMENTS FREE HOUSEHOLD FOREIGN INVESTMENT
I
FOREX REGULATIONS RELAXED EXCEPT FOR HOUSEHOLDS AND SHORT-TERM CAPITAL MOVEMENTSFREE DIRECT INVESTMENT ABROAD FOR NONFINANCIAL COMPANIES
FREE LONG-TERM FOREIGN BORRO~NG FOR OlHER COMPANIES
FREE LONG-TERM FOREIGN BORRO~NG FOR MANUFACTURING AND SHIPPING COMPANIES
UMITED CURRENCY OPTIONS ALLOWED TO AUTIiORIZED BANKS BANKS FREE TO COVER COMMERCIAL FORWARD POSITIONS
1.3.2 Unconstrained stock adjustment starts
The liberalization of the domestic credit market and foreign exchange transactions was not accompanied by other reforms that would have significantly dampened the expansionary effects of liberalization. The incentives to borrow remained unchanged, economic policy in general did not adequately restrain domestic demand or price and income expectations, and banking supervision was not tightened.
Tax incentives to borrow were not changed significantly as liberalization proceeded. Because equity capital remained heavily taxed relative to debt, the latter continued to be the cheapest form of external finance to companies. Furthermore, households' interest expenses could be deducted from taxable
3 The liberalization process up to 1988 has been described and analyzed by Abrams (1989). A history of exchange controls is provided by Lehto-Sinisalo (1992). The lifting of regulations on foreign exchange is also discussed by Nyberg (1992a).
income at a high marginal tax rate, making borrowing very attractive to households. Finally, tax exemption of interest earnings on low-yielding bank deposits constituted a subsidy to banks, boosting their capacity to lend.
Previously, credit rationing had prevented the attainment of the preferred portfolio compositions implied by these borrowing incentives. With the lifting of the regulations such hindrances suddenly no longer existed. Understandably, a large-scale stock adjustment followed. Households as well as businesses started to borrow as never before. In the peak year of 1988, for instance, bank lending grew by no less than 30 per cent (Chart 4).4
Chart 4. Bank lending to the corporate and houseJlold sectors*
PER CENT CHANGE.----...---...---,.---r---~---r----____:::JPER CENT CHANGE
OVER 4 QUARTERS OVER 4 QUARTERS
_ Total lending
_ Share of markka loans
~ Share of bonds
f"77;I Share of foreign currency loans**
* Effect of credit losses eliminated from the change in outstanding loans.
** Depreciation of the markka taken into account by reducing the markka value of outstanding foreign currency loans by 12 per cent both in the 4th quarter of 1991 and 3rd quarter of 1992
In retrospect, it is clear that neither banks nor customers took adequate account of the changing financial environment. Banks, unused to recognizing, evaluating and controlling risks inherent in unregulated markets, continued to operate on the basis of partly outdated principles. Competition for market shares was the dominant objective and led to a lowering in banks' credit standards. Insuf-ficient attention was given to the value and quality of collateral, trust being put in the historical unlikelihood of falling asset values. Credit risk was not correctly
4 For example, Bruriila and Takala (1993) document the increase in the indebtedness of the private sector.
priced.5 Likewise, interest rate risks attracted too little attention .. By the same
token, borrowers appear to have misjudged the risks associated with floating rate and foreign currency loans, being used to administered prices.6
At the same time, regulators did not for several reasons strengthen supervisory efforts. As in many other countries, deregulation was accompanied by strong public and political pressures stressing the blessings of unregulated, private choice. Banking regulation focused on judicial compliance rather than risk evaluation. Furthermore, decisions by the supervisory authorities could frequently be challenged in court, which probably raised the threshhold for introducing stricter supervisory practices.
Macroeconomic policies were not geared to restraining the positive demand impulses stemming from financial liberalization. In part this w~s because the significance of the impulses was not fully understood. In part the cyclical situation was misjudged, and finally policies were constrained by objectives other than short-term demand management. Although government finances indicate some fiscal restraint in 1988 as well as in 1989, no major tightening took place. Rather, the longer-term objective of reducing direct taxation was given priority.
The Bank of Finland, for its part, did not take timely action to restrain credit expansion through monetary means, apart from some rather strong statements. Partly this was undoubtedly because the strength of the expansion was not fore-seen. However, partly the lack of sufficient action was due to the overriding target of a fixed exchange rate, which made it difficult to raise money market rates. The implications of this constraint, on the other hand, were not fully understood more widely in the economy.
1.3.3 Positive shocks give a further boost
Simultaneously with the new freedoms in the credit market, national income was boosted by a significant improvement in the terms of trade between 1986 and 1989; oil prices declined in 1986 while export prices kept on rising (Chart 5). The world-wide relaxation of macroeconomic policies in the wake of the stock market crash of 1987 accelerated the growth of export markets. When these favourable shocks hit, the economy already had behind it half a decade of comparatively rapid and stable growth (Chart 6). In Finland, confidence was further boosted by the relative ease with which the oil shocks in the early 1980s had been overcome with the help of bilateral trade with the Soviet Union. The result was a highly optimistic atmosphere where reasonable constraints on growth and welfare appear to have been temporarily forgotten.
5 Murto (1993) analyzes the pricing of credit risk in the savings bank sector using micro data.
6 The exchange-rate risks associated with foreign currency loans are, of course, borne by the borrowers. Banks' total currency exposures have throughout been strictly regulated by the Bank of Finland. But to the extent that changes in eXChange rates lead to credit losses, the banks also effectively carry part of the exchange-rate risk.
Chart 5. Terms of trade
Ind.r----r----r----r----.----r----.----r----.---,
Finland --- OEeD Europe
Chart 6. Output and exports
~ ~ ~ ~ \ t-~ \ ~ '\
"
~ 1\ / ~v
\ t-~ \v
~ I 10 / ~ r---, \' ~ f?v ~ r---/ ,--o -10 t-,
/t-"
-1980 1982 1984 1986 Growth of real GDP, % --- Growth of exports of goods1988
f\
1'\[\
\
1990
n
Share of Soviet exports in total exports~
-,-=
I : : 10 I : :n/-::
In=
o I I -: -10 1992Demand not only for consumer goods but also for all real and financial assets increased substantially. Stock prices and real estate values soared. High asset va-lues in turn boosted wealth and kept debt-asset ratios deceptively low. In part, new investments expanded the productive capacity of export industries. However, far more money was spent on investment in the closed sectors of the economy: retail trade, recreation and housing (Chart 7).
Chart 7. Investment by sectors, per cent of GDP
% 10 8 6 4 ,
,
2 0 1970 1975 1 Construction.2 Private service sector.
3 Manufacturing.
,--1.3.4 Policy response: late and little
---,
..
"
-
--
-1980 1985 % 10 8 6 "
----
, , 4 2 0 1990The record-high rates of credit expansion and other relevant data led the authori-ties to tighten monetary policy in early 1989. The markka was permitted to appre-ciate by adjusting the fluctuation range for the currency index. At the same time, expansion of bank lending was penalized by a special reserve requirement imposed on the banks by the Bank of Finland. Short-term market rates increased substantially towards the end of the year.
The markka lending of most banks started to decelerate rapidly. However, some banks in the savings bank sector chose to pay the new penal rates rather than curtail their rapid credit expansion. Furthermore, as markets were now free, borrowing in foreign currencies continued to increase at a high rate (partly through bank intermediation).7 Higher markka rates made such borrowing look
7 The special reserve requirement penalized commercial lending less than lending to the house-holds. As, at the time, borrowing by households in foreign currency was still restricted while enter-prises could borrow freely, foreign currency lending slowed less than markka lending.
cheap on the assumption of broadly unchanged exchange rates. Given the widely-publicized policy of a fixed exchange rate pursued by the Bank of Finland and the successful defence of the markka in 1986, such expectations were understandable despite the recent revaluation.
The monetary tightening of the early 1989 was too late and too small to significantly affect overall demand conditions that year. Neither was there a clear shift in fiscal policy towards curbing domestic demand. Indirect taxes were raised and the growth of government spending reduced but household taxes were at the same time cut in line with the long-term tax-policy goals of the Government. As a result, 1989 was the second consecutive year with real GDP growth of (slightly more than) 5 per cent; housing production alone rose by 20 per cent.
As the unemployment rate was below 4 per cent, the economy was clearly in a state of overheating. This showed up in an acceleration of labour costs, further eroding external competitiveness, which had already been weakening for some time (Chart 8).
Chart 8. The labour market
2 0 . . - - - , - - - , . . - - - r - - - . . , . . . . - - - - , - - - , 1 3 0
15~~--~---~--+---~---+--T~
10~-L---4---~--+----r--_+-r_~
,
,
Unemployment rate (left scale)
--- Relative unit labour costs in common currency, competitors;Finland, 1985=100 (right scale)
1.4
From boom to bust
1.4.1 Adjustment begins
Towards the end of 1989, the tighter monetary conditions and high debt levels started to undermine domestic demand. Servicing the newly-raised debts took an increasing share of the cash flow of many enterprises and households (Chart 9). Particularly demand for real estate was quickly affected. Asset values and profits started to decline sharply (Chart 10). Unemployment bottomed out and income prospects weakened. At the same time, export performance deteriorated as market growth decelerated and market shares were lost in response to weakened price competitiveness. In 1990, the growth of the economy slowed to zero, reflceting both capacity constraints and weakening demand.
1.4.2 Output hit by bad luck
Following a gradual decline over several years, exports to the Soviet Union finally collapsed in 1991. Given the different commodity composition of exports to eastern and western markets and the weak price competitiveness of Finnish manu-factures, only a very small proportion of the lost exports could be directly replaced by sales to other markets. The increasingly severe payments problem of that country also implied that at least part of Finnish credits to Russian importers could not be recovered on time.
The loss of Soviet export markets brought about a negative demand shock of the order of 2.5 per cent of GDP, including indirect effects. The resulting decline in incomes further increased the problems of those with relatively high debt-service obligations. As the adjustment of domestic demand to increased indebted-ness continued with full force, total demand declined by 6.5 per cent in 1991. The unemployment rate reached 11 per cent by the end of the year.
Chart 9. Debt service burden (a) Households
Interest payments, per cent of household disposable income, 197~1
1o.----.----~---,----_r----._--_.----.__=_.10 8 8 6 6 4 4 2 2 O~~~--~-+--~-r~--~~--~_r~~~~--~~O 1975 77 79 81 83 85 87 89 91
(b) Selected production sectors
Interest payments, per cent of cash flow *, 1975-91
150r----.----.----.----.----.----~--_.--__,150 100 50 O~,--+~r-~-.~,-~-r-.--r_-r~--r_,_~~O 1975 77 79 81 83 85 87 89 91 1 Paper industry.
2 Metal product indstury. 3 Construction material industry. 4 Trade.
Chart 10. Asset values 100 f: -~
-f:""" '\
,'-
..
1= f \f \ r ~,
f \ I \ 1=,
I f:""" , \f " f,
-'\ 1="
,
,
f' r---~K
,
/
-
I~
,
I/
,... i'-~' I,... ~r7
~ ~--
~ ~--
,. -:h
11 I11 I1I I I I ILL LII 1,,1 .. 1. \,11 .ILI I. rIND. IND.
300 300
200 200
100
1IIIIIInln IlIlnllll IIl1m
o 1980 1981 1982 1983 1984 1985 1986 1987 1988 1989 1990 1991 1992 0
Housing prices, whole country, index 1985=100 --- Stock prices, Hex-general index 1985=100
1.4.3 Financial risks materialize
The rapid decline in output was accompanied by serious balance of payments problems (Chart 11). This weakened confidence in the Finnish economy in general and in the fixed exchange rate in particular. Expectations of a devaluation of the markka started to gain strength. In an attempt to bolster confidence in the existing exchange rate, the markka was linked to the ecu in June 1991. That allowed nominal money market rates to decline for a short while, but real rates of interest generally moved higher in 1991. Strong expectations of an imminent devaluation pushed nominal short-term rates substantially higher in the autumn, and in November the markka was devalued by 12.3 per cent (Chart 12).
Both the high and continually rising interest rates and the devaluation reduced the public's capacity to service its debt. By mid-1991 the number of bankruptcies had increased to a monthly average of some 600 from around 200 a year before (Chart 13). While the effect of higher rates worked through gradually, the depreciation of the markka abruptly raised the debt-service burden for firms in the domestic sector, with substantial borrowing in foreign currency.
Combined with plummeting profits and declining household incomes these developments transformed a steadily increasing share of banks' loan portfolios into non-performing assets. Some 1.5 per cent of banks outstanding loans (about 1 per cent of the balance sheet total) had to be booked as credit losses in 1991. Given the weak underlying profitability, banks' aggregate profit before extraor-dinary items became negative.
Chart 11. External balance, 12-month moving totals
Bl1l.FIM r---~----'--~--r--~---'---"'Bl1l.FIM
1 Trade account, Bill. FIM 2 Current account, Bill. FIM
Chart 12. Chart 13. 1,000 800 600 400 200 0 30,000 25,000 20,000 15,000 10,000 5,000 0
The exchange rate and interest rates
% 16 14 12 10 8 6 4 2
I
!
,
~ I ! ! I 1 \-
,
\ ~ ,\ /\ I \ 1 I 1 \-
1 \-'
\ I \ I:- 1 ~/'/
\ I ~\,
..
f- .... _ - , , ' \ / t-t- .', t-.
...
~.
. . r.:.. . .' ... . . . / f- •••..
.
f- ... / ...ti,l'! wluhJ.u Lulullllll lldld
,,"l
d d "1987 1988 1989
Bcu index
3 month helibor rate Real lending rate*
1990 1991 %
I
---~ -16 1\ -1 \ - - --'- 1-\ -1 \,
-I -14 12 \ \ \ -:..
~ ....,.\,
.. " ~. -10 - 8 V -f----" 6 -4;:..
J.uLulu culululu 1993 2 1992* Average interst rate on outstanding markka loans minus annual CPI inflation.
Applications for bankruptcy proceedings and new payment disturbances
Number
1989 1990 1991 1992
1989 1990 1991 1992
• Applications for bankruptcy proceedings, montly
1993
1993
11 New payment disturbances confirmed by the authorities.
1.5
The first bank failure: Skopbank
1.5.1 Risky strategy backfires
The first bank to get into serious difficulties was Skopbank, the commercial bank that acts as a central bank for the savings banks. Skopbank had pursued anaggres-sive lending policy in the boom years. It had also acquired a majority holding in Tampella Oy, a multiproduct industrial group, presumably with the aim of making it the industrial flagship of the savings bank group. Being financially weak after large-scale investments, however, Tampella encountered severe profitability problems, as soon as the general economic climate took a turn for the worse.
Skopbank had been under the special and increasingly strict ·surveillance of the Bank of Finland and the Banking Supervision Office since autumn 1989. In October 1990, the authorities drew up a restructuring programme aimed at managing the bank's large risk exposures and strengthening its capital base. The savings banks were required to provide FIM 1.8 billion in fresh capital for their central .bank as a part of this rescue programme.
1.5.2 Liquidity crisis prompts action
By the end of summer 1991, it became increasingly evident that Skopbank could not meet the goals of the restructuring programme. The authorities drew up a contingency plan as confidence in Skopbank collapsed on 19 September and the bank was faced with an acute shortage of liquidity: As there was no other authority equipped to deal with this type of operation, it was decided that the Bank of Finland must step in. The Bank of Finland then took control of Skopbank with immediate effect in order to retain confidence in the Finnish banking system. The restructuring of Skopbank got under way immediately by setting up three companies to manage substantial portions of the assets of the bank. Scopulus Oy was created to own shares in Skopbank, Solidium Oy to take over Skopbank's industrial holdings (including Tampella) and Sponda Oy to administer Skopbank's share and real estate holdings. Strict targets were set for reductions in the remaining part of Skopbank's balance sheet and in costs. The board of the bank was largely replaced.
The Bank of Finland has used a total of more than FIM 16 billion to finance the operation. Of that amount FIM 4.3 billion has been booked as losses and about FIM 1 billion represents lost interest earnings. Some FIM 9.S billion remains as loans to the holding companies, part of which may be lost in the future. The ownership of Skopbank was transferred to the newly-created Government Guaran-tee Fund in June 1992 (see section 3 below).8
8 Decisions on selling subtantial parts of the Tampella group have already been taken. In the early
summer of 1992, stakes in the metal and engineering division were sold to foreign buyers. In March 1993, the paper division was sold to a Finnish competitor. At the moment, Solidium owns 88 per cent of Tampella.
1.6
Banks' losses soar
1.6.1 The economy continues to contract
The rapid decline in output that had begun during 1989 continued all through 1991 and 1992. Although exports had already started to recover in 1991 and grew by about 9 per cent in 1992, this was not enough to offset weak domestic demand. Real GDP still fell by 3.5 per cent in 1992 despite increasing industrial production. Business failures, primarily in the domestic sector, continued at a high rate, reaching a high of 800 failures a month in the autumn.
At the same time, nominal interest rates continued to rise. This partly reflected the higher level of European interest rates. More significant, however, was speculation fuelled by expectations of a further devaluation of the markka, which kept interest rate differentials wide. By early September, the speculative pressure, strengthened by the general turbulence in the European currency markets, had become so intense that the Bank of Finland had to let the markka float. The markka depreciated initially by some 10 per cent. By early 1993, the cumulative depreciation since September had reached 20 per cent (the exchange rate index had risen by 26 per cent), but in April the markka appreciated markedly. Despite some initial fears, exchange rate developments appear to have influenced bankruptcies only marginally.
As a result of subdued demand, inflation remained modest and asset prices kept falling in 1992, despite the substantial currency depreciation. Consequently, real rates of interest continued to rise and collateral values to fall.9
1.6.2 Problem assets and losses mount
Not surprisingly, the stock of banks' non-performing assets grew rapidly during 1992 from FIM 42 billion at the beginning of the year to no less than FIM 77 billion by the end of the year.lO Of this amount, some FIM 22 billion (4.8 per cent of total lending) was booked as credit losses.
Reflecting the structure of lending during the boom, some 40 per cent of the non-performing assets were related to construction, real estate and retail trade. Households accounted for 21 per cent of the total and foreign engagements for 14 per cent. Manufacturing accounted for less than 8 per cent of problem assets, reflecting the increased competitiveness and activity of that sector.l l
9 For a discussion of the deflation process in Finland, see Honkapohja, Koskela and Paunio (1993).
10 A loan is recorded as non-performing when the payment of interest or repayment of principal is in arrears by more than three months. Similarily, a bank guarantee is included in the stock of non-performing assets, if the underlying liability arises. Systematic collection of data on non-non-performing loans did not start until towards the end of 1991. Little is thus known about the development of problem assets in the early phases of the crisis.
11 An analysis of the structure of non-performing assets and credit losses is provided by Pensala apd Solttila (1993). Some comparisons of the bookkeeping practices applied in a number of countries are also given in the paper. Peisa and Solttila (1992) analyze the backgrounds of a sample of firms with payment difficulties.
Worst hit was again the savings bank group, which accounted for about half of the aggregate loss. As noted earlier, the savings banks had aggressively expanded their market share of lending during the boom· years. This naturally made for weaker-than-average loan quality, in certain instances strikingly so. In addition, a significant part of the savings bank group's lending to the domestic sectors was denominated in foreign currencies, thus making the clients vulnerable to the depreciation of the markka.
The non-performing loans were largely responsible for the weakening of banks' net interest income. It was, however, also squeezed by shifts of deposits from low-cost, tax-exempt accounts into higher-yielding taxable accounts induced inter alia by the introduction of a low withholding tax on most interest earnings. Given the relatively low level of the Bank of Finland's base rate, to which almost half of all outstanding markka loans were linked, such shifts could not be
compensated for by corresponding increases in lending rates. Consequently, banks' losses before extraordinary items increased by FIM 17 billion to FIM 22 billion (Table 3).
Table 3. The results of the Finnish deposit banks (groups consolidated), billions of FIM
All deposit banks 1985 1986 1987 1988 1989 1990 1991 1992
Income from financial 7.5 8.1 9.8 13.2 14.0 16.5 15.2 11.9
operations
Other income 5.1 5.8 7.2 9.3 10.4 10.0 10.3 12.5
Total income 12.6 13.9 17.0 22.5 24.4 26.5 25.5 24.4
Expenses 8.1 9.3 10.7 14.1 16.5 17.9 18.7 19.3
Credit and guarantee 0.2 0.3 0.7 1.1 1.8 2.5 7.6 22.0
losses
Operating profit 4.3 4.3 5.6 7.3 6.1 6.1 -0.8 -16.9
Depreciation 1.5 1.6 1.8 2.5 2.9 3.7 4.0 4.8
Profit before extra- 2.8 2.7 3.8 4.8 3.2 2.4 -4.8 -21.7
ordinary items, appro-priations and taxes
Lending to the public 213.7 247.5 293.3 382.2 447.3 491.3 492.0 461.3
Total assets 364.4 432.3 508.9 645.3 742.3 791.3 801.6 784.5
1.6.3 Nordic countries: some parallels
A Nordic comparison reveals that the onset of the Finnish banking problems closely resemble that of Sweden. In both countries, the problems started to emerge on a major scale in 1991 and reached critical proportions in 1992. In Norway, the process commenced earlier and banks' credit losses gradually crept up between 1987 and 1991, when there was a steep increase in losses. That remains the peak, as losses finally started to decline in 1992. In Denmark, losses have been smaller,
although they have increased over the past years, and Denmark cannot be counted as a banking crisis country in the same way as the other three Nordic countries
(Chart 14). .
Chart 14. Credit losses of deposit banks (parent companies) per cent of lending outstanding
8 ~---~
7~---
6~---oL _ _ L
FINIAND SWEDEN NORWAY DENMARK
• 1987 .1988 • 1989 111990 01991 .1992
1 Finland
2 Sweden 3 Norway 4 Denmark
In Norway, Sweden and Finland, the backgrounds of the crises are similar. Financial markets were liberalized fairly rapidly, but economic or supervisory policies were not tightened. Lending criteria were eased as banks and other financial institutions competed for market shares in lending and sought to expand into new business areas. A favourable economic climate then led to rapid credit expansion, culminating in a general overheating of the economy.
In the case of Norway and Finland a single factor was important in halting and reversing this trend. In Norway, the shock was provided by the fall in oil prices while in Finland it stemmed largely from the collapse of trade with the Soviet Union. In Sweden, the more gradual effects of accumulating debt and slowing of growth in export markets appear to have dominated, although eg the tax reform had a strongly depressive impact on the housing market.1:?
12 Koskenkyla (1992) and Koskenkyla and Pensala (1992) describe and discuss the evolution of the banking crises in the three Nordic countries. Inter alia, Lindblom (1993), Koskenkyla (1993) and Vartiainen (1993) discuss more specifically the Finnish case.
2
The Safety Net
2.1
The system prior to the crisis
As in most western countries, bank instability was not considered a serious risk in Finland in the post-war decades. Fluctuations in aggregate economic activity were, given the active role of stabilization policy, generally thought to be too small to lead to massive losses of output and general deflation. Furthermore, the regula-tions introduced in the 1930s and 1940s - interest rate regularegula-tions and capital controls - helped to make banking a very stable business with highly predictable interest margins. Consequently, the public safety net and supervision arrangements were geared to tackling rather limited problems.
The systemic safeguards consisted of the risk and capital regulations incorporated in the banking legislation, security funds, supervision and the duty of the central bank to act as a lender of last resort.
Finnish banking legislation has not differed essentially from that of other countries where there is universal banking. In particular, capital requirements have generally been as stringent as elsewhere. Thus, when the current capital adequacy regulations, based on risk-weighted assets and broadly in line with EC standards, were introduced at the beginning of 1991, most banks easily met the 8 per cent minimum standard. The most significant shortfall as regards the legal requirements probably relates to the regulation of large exposures, which has allowed for substantially larger risks than, for instance, present EC rules.
Although the current legislation has been in force for only just over two years, amendments have already been passed by Parliament. The new legislation, which will come into force simultaneously with the agreement on the European Economic Area, fully harmonizes Finnish legislation with the EC directives. In terms of capital adequacy and risk regulations, the new legislation implies some tightening of the capital requirements for the local banks and a significant tigh-tening of the regulations on large exposures.
2.1.1 Security funds
A compulsory security fund system (deposit insurance) was introduced in 1969. However, voluntary security funds had existed prior to that. The savings banks and the cooperative banks had had their own security funds since 1924 and 1932, respectively. A fund for commercial banks was established in 1966. Although based on law and supervised by the authorities, the funds are administered by the member banks.
The banks' security funds are responsible for repaying the claims of de-positors if payment cannot be effected out of a bank's own funds because of bankruptcy. The responsibility is unlimited (no ceiling per depositor). In addition to compensating depositors, the funds may grant subsidies and loans to member banks.
Until 1992, only the resources of the security funds of the cooperative and the savings banks were utilized, and only for the purpose of support loans and grants to support individual banks or bank mergers. The system thus functioned as a
vehicle whereby banks could collectively handle the problems of individual local banks. In this it was aided by a system of mutual credit insurance within the savings and cooperative bank sectors, respectively.
The resources accumulated were small in all security funds. In particular, the funds accumulated in the commercial banks' security fund were minimal in relati-on to potential compensatirelati-on liabilities. Until now, the banks' crelati-ontributirelati-ons have been flat-rate ie independent of the estimated riskiness of banks' portfolios.
2.1.2 Lender of last resort
The central bank has traditionally had wide responsibilities in Finland. The Regulations for the Bank of Finland stipulate that "the function of the Bank of Finland is to maintain a stable and secure monetary system and to assist and facilitate the circulation of money in Finland". This clearly implies that the Bank of Finland has a role as lender of last resort as well as a responsibility for upholding systemic stability in the financial markets.
In taking control of Skopbank, the Bank of Finland acted as the ultimate provider of liquidity. But in the Skopbank case the Bank of Finland also assumed responsibility for the solvency of the bank in the interest of systemic stability. Given the lack of alternative responsible authorities capable of handling the situation at the time, the intervention was clearly necessary. Nevertheless, the intervention did not, of course, fall wholly ·within the realm of traditional central bank operations.
2.1.3 Bank supervision
In Finland, prudential supervision of the banks is in the hands of the Banking Supervision Office. The office is subordinated to the Ministry of Finance but is, to a large extent, self-financed through the supervision contributions of the banks. In the supervision of the large number of savings and cooperative banks, the Banking Supervision Office is assisted by semi-official supervision bodies of the savings banks and cooperative banks, respectively.
In recent years, the responsibilities of the Banking Supervision Office have been substantially enlarged by new legislation, covering inter alia the securities markets. With the exception of insurance companies, basically all financial institutions are superVised by the Banking Supervision Office. Insurance com-panies are the responsibility of the Ministry for Social Affairs and Health.
The Bank of Finland also has some supervisory functions. In part, they are based on the Foreign Exchange Act, which assigns to the Bank of Finland the role of supervisor of the currency risks of financial institutions. In addition, the Bank of Finland has, of course, a supervisory interest of its own because of its role as a lender to the banks.
Traditionally, and in line with the aforementioned perception of the nature of risks in banking, the Banking Supervision Office has focused very much on the legal aspects of the supervisory functions. Relatively little work has been carried out on quantitative risk analysis or in-depth risk appraisal of individual institu-tions. Thus, when the banks increased their risk positions in the newly liberalized
markets, no clear warning or restraining action was forthcoming from the main supervisory authority. Similarly, the Bank of Finland failed to perceive at an early stage the full consequences of the credit boom.
2.2
New elements in the safety net
The take-over of Skopbank by the Bank of Finland was an ad hoc measure. Subsequent to this rescue operation, the Government decided to approach the looming bank problems on a more systematic basis.
In January 1992, a special working group was appointed by the Prime Minister to review the banking situation. In its report published- in March, the group suggested that two major steps be taken.13 The first was designed to avoid
a domestic credit crunch and consisted of a general capital injection into the banking system. The second was to speed up the establishment of the Government Guarantee Fund, which had already been under preparation for some time. The Fund was given responsibility for designing and implementing support measures for banks with acute problems.
In August 1992, the Government announced that the stability of the Finnish banking system would be secured under all circumstances. This first, exceptionally strong and comprehensive declaration expressed the basic principle of the Finnish banking safety net: no systemic problem would be allowed to materialize. Later this commitment was elaborated by Parliament (see section 4.6).
2.3
General capital injection
In March 1992, the Government decided to provide the banks with a capital injection totalling FIM 8 billion in order to support the supply of bank credit to customers. At the same time, the capital infusion would, of course, help banks avoid emergency support. It was offered to all banks regardless of their solvency and in relation to their risk-weighted assets. Banks could apply for the injection only twice, the last time being in December 1992. By that time virtually all banks had availed themselves of the facility, receiving, in all, FIM 7.9 billion in fresh capital.
The instrument used for the capital injection was a preferred capital certifica-te, which was designed for inclusion in banks' primary (Tier 1) capital. In particular, the investment carries a non-cumulative return, and the capital value of the investment can be written down to cover losses. The certificates can, furthermore, be converted into voting stock if
interest remains unpaid for three years in succession or
the bank's solvency ratio falls below the legally required minimum.
The certificates can be used to cover losses after the bank's distributable equity capital and the reserve fund have been exhausted.
The interest rate on the instrument was set slightly above the market rate. Furthermore, the rate gradually increases in relation to the market rate so as to create an incentive for the banks to repay.
2.4
The Government Guarantee Fund
The Government Guarantee Fund ("Fundlt
) was established by law on 30 April 1992 to help ensure the stability of the banking system and secure the claims of both domestic and foreign depositors. The Fund was authorized to use up to FIM 20 billion for these purposes. The administrative costs of the Fund are covered by contributions from the banks.
Support can be provided both directly to individual banks or indirectly, through the security funds administered by the different banking groups themselves. In practice, direct support has been the norm. Various techniques can be used as deemed necessary, including aquisition of bank shares, provision of other ty·pes of equity capital, loans, guarantees or other types of support. The Fund cannot, however, acquire all types of real or financial assets, thus being restricted from, for example, owning real estate or shares other than bank shares.
Of course, the establishment of the Fund affected the responsibilities of other public authorities. In particular, it was no longer necessary for the Bank of Finland to guarantee the solvency of a troubled bank, as had happened in the Skopbank case. The Bank of Finland was subsequently able to concentrate on the provision of liquidity to the banks. In addition to its normal lending, the Bank of Finland has occasionally extended short-term bridging loans to the Fund.
2.4.1 Organization
According to the original organizational structure, in force until mid-March 1993, decisions on support measures were taken by a section of the board, comprising the representatives of the Banking Supervision Office, the Ministry of Finance and the Bank of Finland. The Section was thus the executive body of the Fund. Banks were represented by three members on the board proper, where decisions on such matters as bank contributions and funding proposals were made. The supervisory board (with the same composition as the Parliamentary supervisory board of the Bank of Finland) supervised the board and its section and made necessary proposals to the Government.
In its work, the Fund has made extensive use of the staffS of the Bank of Finland and the Banking Supervision Office. However, the Fund remains a distinct legal entity, with no formal affiliation to any of the afore mentioned authorities.
As will be described later (section 4.4), the organization of the Fund was changed
2.4.2 Objectives and guidelines
The Fund's supervisory board drafted general guidelines governing board activities in October 1992. They are used primarily when interpreting and implementing the legal obligations placed on the board and should not therefore necessarily be seen as exhaustive.
According to the guidelines, systemic stability requires that confidence in the banking system is maintained among domestic as well as foreign depositors and investors. One important element of this is that banks conducting international business fulfill international capital adequacy requirements. Another, though separate, element is that bank deposits are safeguarded even though a bank may be unable to meet such obligations out of its own funds or even with the help of the security fund to which it belongs.
Any support programme for a bank should meet a number of general require-ments. Their exact interpretation was left to the body making the support decisions (ie the section in the original organization) as they will be part of any particular programme. The requirements are, in full, as follows:
1. Support is transparent and public.
2. The attractiveness and public funding needs of the programme shall be minimized. The economic responsibility of the owners of the bank receiving support should be realized as widely as possible.
3. The terms of the programme shall support the efficiency of the banking system and contribute to necessary structural adjustments.
4. The distorting effects of the support programme on competition shall be mini-mized.
5. Distortive interest rate competition is not allowed.
6. Public monitoring of the activities of bank receiving support shall be ensured. In particular, the granting of credit or writing off credit on unusual terms should be avoided.
7. The employment terms of the bank's directors shall be reasonable and possible inequities shall be removed.
The exact terms of the support are, nevertheless, decided separately in each case. Accordingly, a lively discussion is going on as to how these guidelines should be applied in practical situations. Particularly the extent to which the responsibility of owners should be realized and the usefulness of mergers as a means of rationalizing the banking sector are very much at the centre of public debate. Nevertheless, the principles as such seem to have been generally accepted.14
14 The principles of bank support are discussed eg by Nyberg (1992b, 1993) and Aranko (1993). A banker's view is provided eg by Vainio (1993).
3
Support Programmes Implemented
The Fund has supported the banking system in three cases so far. First, Skopbank was acquired from the Bank of Finland in June 1992 for FIM 1.5 billion. Secondly, also in June, it was decided to support the 41 savings banks who were later to merge to form the Savings Bank of Finland (SBF). This was done with an original commitment of FIM 7.2 billion, of which FIM 5.5 billion in Tier 1 capital. Thirdly, in November, the Fund supported the merger agreed on between STS-Bank and KOP by conditionally agreeing to take over a large part of the former's bad assets.
3.1
Skopbank
The acquisition of Skopbank by the Fund from the Bank of Finland did not involve any major change in the restructuring programme already under way at that bank. However, the holding companies managing the industrial holdings and real estate assets of Skopbank remained in the ownership of the Bank of Finland. The aquisition was purely technical, reflecting the new distribution of responsibili-ties after the setting up of the Government Guarantee Fund.
In addition to the original aquisition cost of FIM 1.5 billion, the Fund provided a further injection of capital of FIM 1 billion in December. A further FIM 0.5 billion was earmarked for use during the second quarter of 1993. The total amount spent or earmarked by the Fund for Skopbank was thus FIM 3 billion by the end of 1992.
3.2
Savings Bank of Finland (SBF)
A number of savings banks, many of them located in the main metropolitan areas and with substantial amounts of problem assets, showed signs of increasing distress during the first half of 1992. Since the savings bank system was built on the principle of mutual financial responsibility for each other's solvency, the situation created potential problems for a number of other savings banks as well. Additionally, one of the major assets of a number of savings banks was stock in Skopbank, the value of which after the Bank of Finland rescue was a matter of administrative convenience.
To resolve the situation without overextending the resources of the Fund, a total of 41 distressed savings banks were forced to merge during 1992 to form the SBF. The remaining savings banks were able to remain independent of both the Fund and the SBF. The merger, finalized in September, was made possible by the provision of adequate capital support by the Government Guarantee Fund, on condition that a restructuring programme be implemented.
The Fund initially provided the emerging SBF with a capital injection (including preferred capital certificates) of FIM 5.5 billion in June, together with a guarantee of FIM 1.7 billion for the issue of a subordinated loan. The subordinated loan was eventually taken up by the Fund itself up to an amount of
FIM 1.4 billion while the. rest of the facility (FIM 0.3 billion) was converted into additional capital support.
As the economic situation of the SBF proved to be worse than initially· estimated, further capital support became necessary. A major reason for this was that the bank's auditors demanded that planned write-downs of real estate holdings had to be speeded up. In December, a further capital injection of FIM 4.7 billion was therefore provided, of which almost FIM 1.2 was in the form of share ac-quisitions. The total amount spent by the Fund on supporting the SBF had thus reached almost FIM 12 billion by the end of 1992. In April 1993, the SBF received a further FIM 1.1 billion.
The ultimate goal of the SBF restructuring programme is that the bank should become profitable again by the end of 1996 through eg reductio~s in operating costs and its branch network. The programme also includes other requirements dictated by the general guidelines:
a Owners of the merging savings banks (primarily savings bank foundations) lost virtually all their capital on the banks' balance sheets. The employment terms of directors were trimmed and may In future reflect the extent to which the· support programme is fulfilled, thus creating incentives for compliance
and efficiency. .
b The bank undertook to convert itself into a joint stock company as soon as legally possible, the majority of voting stock (or convertible preferred capital certificates) to be held by the Government Guarantee Fund. After that, the Fund will be free to dispose of the stock in a manner which bes serves the general interest. The conversion took place in December.
c Apart from the capital infusions, the Fund did not provide the SBF with any funding at special rates. The Bank of Finland has, of course, extended the same rights to the bank as to other major banks in Finland as regards fulfilling the criteria relating to eg solvency.
d The Fund appoints one member of the board as well as one of SBF's auditors. As owner, the Fund also appoints a sufficient number of members to the supervisory board of the bank. The bank is also, of course, obliged to report regularly and when so requested on its activities and on its economic and financial situation.
3.3
STS-Bank
In September 1992, STS-Bank asked the Government Guarantee Fund for support since its assets posed a considerable risk to the solvency of the bank. STS-Bank was a relatively small commercial bank whose status had recently been changed from that of a savings bank. Like many savings banks it was encountering serious profitability problems related to credit losses and reductions in the value of real estate holdings.
As the owners of STS-Bank were unable to provide additional capital and the bank functioned in areas where excess banking capacity existed, it appeared
unviable as an independent entity. The Fund therefore encouraged negotiations on a merger between STS-Bank and Kansallis-Osake-Pankki (KOP), a major commercial bank. In November, STS-Bank announced that it was going to merge with KOP. In the same context, KOP bought the majority of STS-Bank shares at a price close to the going market rate, but substantially below their nominal value. The merger was negotiated in very close cooperation with the Government Guarantee Fund and under its auspices. The Fund assumed responsibility for a substantial part of the problem assets of STS-Bank, subject to subsequent par-liamentary approval. The bank's bad assets were to be transferred for eventual disposal to a separate asset management company ("bad bank"), in which the Fund was to have a large majority holding while KOP was to provide administrative
expertise. _
In the event (see below), Parliament did not approve the creation of such a company, which meant that the provisional agreement could not be finalized as planned. The exact conditions of the merger therefore had to be renegotiated, the situation being complicated by the fact that the amount of problem assets of the STS-Bank turned out to be substantially larger than originally foreseen by the Fund.
On "8 April 1993, the Government Guarantee Fund agreed on an arrangement for managing STS-Bank's problem loans, which totalled approximately FIM 3.4 billion and contained potential losses of some FIM 2.5 billion. These loans are to remain on the books of STS-Bank while other assets will be transferred to KOP. The Fund is responsible for 90 per cent and KOP for 10 per cent of the loan. losses and STS-Bank management costs. Because of the unexpected increase in losses, KOP will, inter alia, pay FIM 75 million to the Fund. Finally, the joint security fund of the commercial banks and Postipankki Oy will transfer all its assets, totalling approximately FIM 342 million, to the Government Guarantee Fund.
STS-Bank will continue to function as a commercial bank but will focus exclusively in its operations on the management of the stock of problem loans (in essence, becoming a "bad bank"). KOP will retain ownership of STS-Bank but the effective control of the bank will be transferred to the Government Guarantee Fund under a separate agreement.
The aim is to implement the arrangement in May 1993. In this context, the name of the bank and its articles of association will be changed to correspond to
the change in the bank's activities.
3.4
Resources used
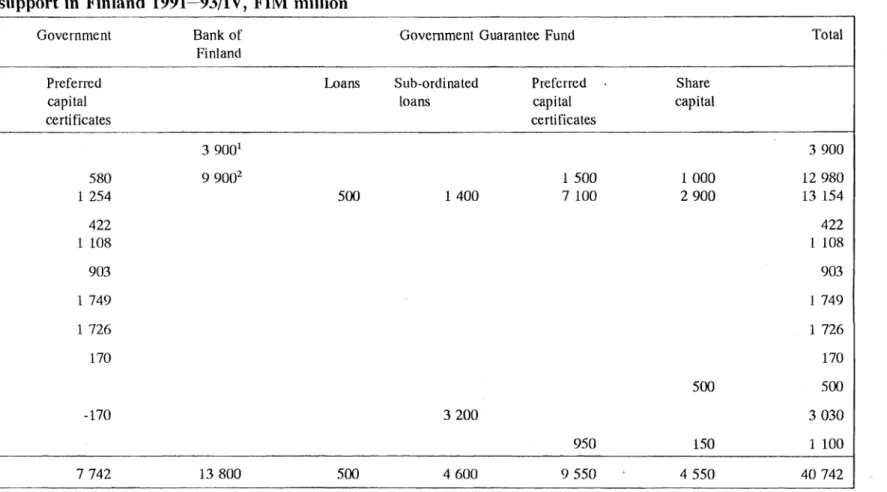
In all, the Fund had used FIM 14.9 billion for various types of bank support by the end of 1992. Together with the FIM 7.9 billion earlier provided by the Government to all banks, and the loss of FIM 4.3 billion by Bank of Finland in conjunction with the Skopbank operation, a total of some FIM 27 billion had been provided to the banks by the authorities by the end of 1992 in the form of new capital or booked losses. In addition, the Bank of Finland had some FIM 9.5 billion of outstanding loans due to the Skopbank operation on its books, bringing the end-1992 sum of funds tied up in bank support to almost FIM 37 billion. The decision on the problem assets of the STS-Bank and further support to the SBF
Table 4. Bank support in Finland 1991-93/IV, FIM million
Government Bank of Government Guarantee Fund Total
Finland
Preferred Loans Sub-ordinated Preferred Share
capital loans capital capital
ce rti fica tes certificates
1991 SKOP 39001 3900
1992 SKOP 580 99002 1500 1000 12980
Savings Banks 1 254 500 1400 7100 2900 13 154
OKO 422 422
Co-operative Banks 1 108 1 108
Post Office Bank 903 903
UBF 1 749 1 749 KOP 1 726 1 726 STS 170 170 1993 SKOP 500 500 STS3 -170 3200 3030 SBF 950 150 1 100 Total 7742 13 800 500 4600 9550 4550 40742
1 Capital injection to SKOP FIM 2000 million plus composition FIM 1900 million.
2 Loans to SKOP totalling FIM 9500 million for transferring risks to the Bank of Finland's holding companies Sponda and Scopulus (effect on capital adequacy FIM 760 million) plus capital injection in Sponda and Scopulus FIM 400 million.
raised the total to some FIM 40.5 billion (more than 8 per cent of GDP) in April 1993 (Table 4).
Apart from incurred and potential capital losses, the investments imply significant opportunity costs; for the Bank of Finland alone the estimated interest earnings foregone amounted to some FIM 1 billion by the end of 1992.
Most of the support has been in the form of investments counted towards Tier 1 capital (preferred capital certificates, shares). Guarantees had not been used by April 1993. While only a small fraction of the Fund's support is in the form of ordinary loans, the Bank of Finland has significant amounts of loans outstanding on its books.
3.5
Reprivatization efforts
As a consequence of the need to provide bank support in a fair and effective manner, the authorities had aquired ownership of two banks of moderate size (Skopbank and SBF) by the end of 1992. Bank ownership is, of course, only incidental to any support programme, and the authorities seek to return ownership to private hands as soon as pOSSIble. Accordingly, a major part of Fund activity in 1992 centered on negotiations aimed at selling off all or parts of these banks.
Talks to this end had already been initiated while Skopbank was in the hands of the Bank of Finland and those with the Union Bank of Finland (UBF) had reached quite an advanced stage. A deal, had it been struck, would have rendered possible cost reductions and a substantial pruning of the banks' joint branch network. However, in October 1992, the negotiations between the Fund and the UBF broke down owing to differences over price, risk-sharing and other considerations. More recently, exploratory talks have been under way concerning the possibility of merging both Skopbank and the SBF with KOP.
Some banks have proposed in public that the banks in government hands should be divided up among the rest of the banking sector. This idea has not been taken seriously by the authorities as the banks have not come up with any concrete proposals as to how this might be implemented. The debate did, however, lead to some leakage of deposits from the SBF.
4
Expanding the Safety Net
4.1
Problem bigger than expected
The amount of funds the Government Guarantee Fund had to use to support the savings bank group in 1992 exceeded the projections made in the spring of 1992 by a substantial margin so that all but FIM 5 billion of the funds authorized had been used or earmarked by the end of the year. Moreover, developments in the economy were worse than anticipated as deflationary forces were stronger and growth in export markets weaker than expected. It was therefore considered prudent to increase the resources at the Fund's disposal.
Also, the administration of bank support proved inadequate. According to its original charter, the Government Guara