Observation of Dynamic Stark Resonances in Strong-Field Excitation
D. Chetty1,∗ R. D. Glover1,2, B. A. deHarak1,3, X. M. Tong4, H. Xu1, T. Pauly5, N. Smith5, K. R. Hamilton5, K. Bartschat5, J. P. Ziegel3, N. Douguet6, A. N. Luiten2, P. S. Light2, I. V. Litvinyuk1, and R. T. Sang1†
1Centre for Quantum Dynamics, Griffith University, Brisbane, QLD 4111, Australia 2Institute for Photonics and Advanced Sensing and School of Physical Sciences,
The University of Adelaide, Adelaide, SA 5005, Australia
3Physics Department, Illinois Wesleyan University, Bloomington, IL 61702-2900 USA 4Center for Computational Sciences, University of Tsukuba,
1-1-1 Tennodai, Tsukuba, Ibaraki 305-8573, Japan
5Department of Physics and Astronomy, Drake University,
Des Moines, Iowa 50311, United States of America and
6Department of Physics, Kennesaw State University, Marietta, GA 30060, USA.
(Dated: April 6, 2020)
We investigate AC Stark-shifted resonances in argon with ultrashort near-infrared pulses. Using 30 fs pulses we observe periodic enhancements of the excitation yield in the intensity regions cor-responding to the absorption of 13 and 14 photons. By reducing the pulse duration to 6 fs with only a few optical cycles, we also demonstrate that the enhancements are significantly reduced be-yond what is measurable in the experiment. Comparing these to numerical predictions, which are in quantitative agreement with experimental results, we find that even though the quantum-state distribution can be broad, the enhancements are largely due to efficient population of a select few AC Stark-shifted resonant states rather than the closing of an ionization channel. Because these resonances are dependent on the frequency and intensity of the laser field, the broad bandwidth of the 6 fs pulses means that the resonance condition is fulfilled across a large range of intensities. This is further exaggerated by volume-averaging effects, resulting in excitation of the 5g state at almost all intensities and reducing the apparent magnitude of the enhancements. For 30 fs pulses, volume averaging also broadens the quantum state distribution but the enhancements are still large enough to survive. In this case, selectivity of excitation to a single state is reduced below 25% of the relative population. However, an analysis of TDSE simulations indicates that excitation of up to 60% into a single state is possible if volume averaging can be eliminated and the intensity can be precisely controlled.
I. INTRODUCTION
Strong-field excitation occurs when the interaction of an atom with an intense laser field results in excitation into higher energy states. In noble gases, a significant portion of these states decay into long-lived metastable states [1, 2]. These states have unique properties that en-able diverse applications, such as atom lithography [3], radiometric dating by way of atom-trap trace analy-sis [4, 5], and precision measurements in beta decay [6, 7]. In recent years, there has been a demand for higher effi-ciency and cleaner sources of metastable atoms, encour-aging all-optical methods of generation to be pursued. Examples include two-photon absorption [8] or meth-ods employing UV lamps [9]. Strong-field excitation is also a promising technique. However, efficient excitation schemes need to be developed to compete with current metastable-generation methods.
In strong laser fields, excitation rates exhibit a com-plex dependence on the laser intensity, showing dis-tinct enhancements at specific intensities dependent on the target atom [10–12]. The intense electric field of
∗Electronic address: [email protected] †Electronic address: [email protected]
the laser modifies the energy levels of the atom due to the AC (or dynamic) Stark shift [13], resulting in res-onances and thresholds at which excitation yields may increase [14–23]. For example, the modification of nar-row features in the photoelectron spectra or unexpected changes in the ionization yield at select intensities have been observed and explained through Freeman reso-nances [24, 25], “channel closing” [17, 18], and “popu-lation trapping” [26–28].
When the laser frequency, ω, is lower than the fre-quency of the transition between the ground state and the first excited state, the ground-state energy drops by −α0I/4, whereIis the laser intensity andα0is the static polarizability of the atom (atomic units are used through-out). The continuum threshold, on the other hand, in-creases with the intensity-dependent ponderomotive en-ergy of the electron, Up = I/4ω2 [13]. Together these shifts can exceed the energy of a single photon, thus increasing the number of photons required for photo-ionization fromNtoN+ 1. At this point, theN-photon ionization channel is said to close, thereby providing the condition for anN-photon channel closing as,
N~ω=Ip+ I 4 1 ω2 +α0 , (1)
where Ip is the field-free ionization potential. The AC Stark effect also shifts the energy levels of the excited
states. For states with a binding energy much less than the ground state, this shift closely follows the contin-uum threshold. Therefore, as the N-photon ionization channel closes, high-lying Rydberg states are expected to come into resonance. As the intensity increases fur-ther, lower-lying states will subsequently shift into reso-nance. If these states defy ionization from the remaining cycles of the laser pulse, for example through stabiliza-tion [29–31], their populastabiliza-tion may accumulate through population trapping.
In experiments investigating above-threshold ioniza-tion, these resonance features in argon photoelectron spectra were found to strongly depend on the laser in-tensity [32]. Soon after this observation, several theoret-ical papers were published [20–22, 33] detailing that the strong intensity dependence is due to low-lying excited states shifting into resonance withN-photon absorption. Hartet al.[34] extended this technique to sodium atoms, demonstrating enhanced ionization at a specific intensity that corresponds to a Freeman resonance for 3-photon absorption into the Stark-shifted 5pstate. These stud-ies, however, did not include the impact on total exci-tation rates, which is central to the aims of the present investigation.
A recent experiment demonstrated the resultant im-pacts by directly observing the excitation yields of argon using 45 fs pulses centered at 400 nm [12]. An increase of more than an order of magnitude was observed at the 6-photon channel closing. The same experiment with 800 nm pulses, however, could not resolve any enhance-ments, even though calculations predict them to persist. Extending this, an even more recent experiment [35] ap-peared to resolve these peak structures in strong-field excitation of xenon with 50 fs pulses centered at 800 nm. In this experiment, a field-ionization technique was em-ployed to detect any excited xenon atoms with principal quantum number 20 < n < 30. Small features were observed in the ratio of field-ionized neutrals to singly ionized xenon that were attributed to the remainder of the peak structure after focal volume averaging.
In this paper, we present experiments probing strong-field excitation of argon with 30 fs and 6 fs FWHM pulses centered at 800 nm with intensities between the multiphoton and tunneling regimes, remaining below-the-barrier throughout. In particular, we focus on the intensities where enhancements are predicted to be most pronounced based on time-dependent Schr¨odinger equa-tion (TDSE) calculaequa-tions. By directly detecting excited states we observe these enhancements experimentally and demonstrate that they are no longer visible for few-cycle pulses. The intensities at which these enhancements oc-cur, as well as an analysis of thenlquantum-state distri-butions predicted by the TDSE, show that the enhance-ments are due to population trapping rather than the closing of an ionization channel.
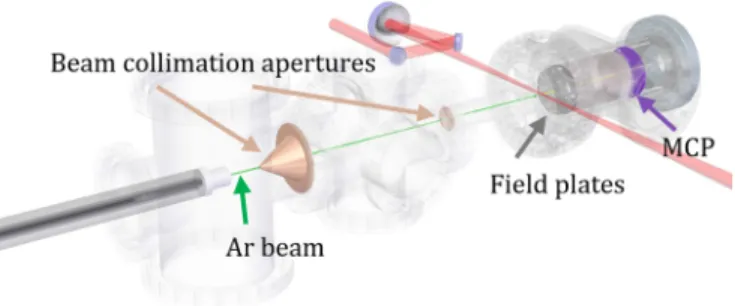
FIG. 1: Scheme of the experimental setup. Linearly polarized laser pulses with duration of either 6 or 30 fs (FWHM) cen-tered at 800 nm are focused into a collimated effusive argon atomic beam. The atomic beam is collinear with a time-of-flight apparatus backed by a microchannel plate (MCP) that allows the identification of particles. The ions are accelerated and temporally separated from the excited neutrals, which remain at thermal speeds. See text for details.
II. EXPERIMENTAL PROCEDURE
We directly detect surviving excited Ar atoms after in-teracting with ultrashort pulses centered at 800 nm with intensities between 70 and 250 TW/cm2. The apparatus is depicted in Fig. 1. We use a commercially available (Femto Power) laser system to generate 30 fs pulses. Op-tionally, these pulses can be further compressed using a hollow core fiber to generate 6 fs pulses. The intensity is varied by attenuating the pulse energy using a combina-tion of numerous thin membrane pellicle beam-splitters in order to preserve the broadband spectrum and chirp of the pulses. These are then focused and crossed with a 500 µm-wide thermal argon atomic beam. A time-of-flight apparatus collinear with the atomic beam and a micro-channel plate (MCP) detector are used to dis-criminate different particles. Ions are accelerated by the electric fields and detected within a few tens of microsec-onds while excited neutral atoms, Ar∗, remain at ther-mal speeds and arrive in a 0.15-0.6 ms window. These excited states may decay to the long-lived metastable states (3p54s)3P
2,0during the flight and are directly de-tected after Penning ionization on the MCP surface due to their high internal energy (>11 eV) [36].
III. THEORETICAL METHODS
For the numerical simulations, we solve the TDSE in the single-active-electron approximation (SAE) with the model potential given in Ref. [37]. The radial space is discretized in a generalized pseudo-spectral grid [38] and the time-dependent wave function is propagated by the second-order split-operator method [39]. We separate the finite box into an inner and outer region to avoid un-physical reflection from the boundary. When the time-dependent wave function propagates into the outer re-gion, we project the wave function onto momentum space to extract the ionization information and then remove it
10−1 100 101 102 103 (a)30 fs Ar* Ar+ N=13 N=14 N=15 70 90 110 130 150 170 190 210 230 10−1 100 101 102 103 (b)6 fs N=13 N=14 N=15 Ar* (VA-TDSE) Ar+ (VA-TDSE) Ar* (expt. 6 fs) Ar+ (expt. 6 fs) 0.0 0.2 0.4 0.6 0.8 1.0 Intensity (TW/cm2) 0.0 0.2 0.4 0.6 0.8 1.0 Yields (arb. units) 1.37 1.09 0.94 0.83 0.76 Keldysh Parameter 75 100 125 0 5 10 13-photon 14-photon
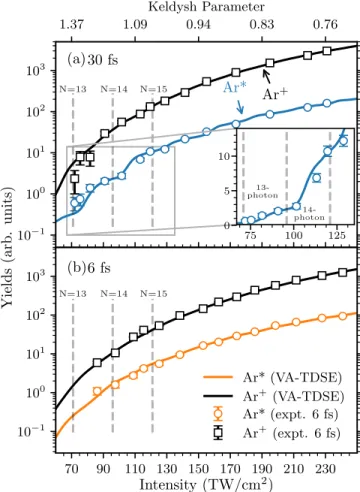
FIG. 2: Yields of singly ionized (black) and excited Ar atoms, Ar∗, as a function of laser intensity for 30 fs (a) and 6 fs (b) laser pulses. The solid lines represent the results of the volume-averaged TDSE simulations and include CEP aver-aging for the 6 fs pulses. The Keldysh parameter is shown above the upperxaxis. The zoomed inset shows the region between the 13- and 15-photon channel closings, correspond-ing to resonances with 13- and 14-photon absorption where a clear modulation is observed for excitation with 30 fs pulses.
from the wave function in real space as discussed in [40]. The final ionization probabilities are obtained by inte-grating the electron momentum distribution over the en-tire momentum space. After the pulse, we project the inner-region wave function on the field-free atomic ex-cited states to get the nl quantum state population up to n= 22, l = 21. Summing over all these populations, we obtain the total excitation probability,P(Ar∗).
The results from the procedure outlined above was compared to independent calculations [41, 42] using the same and other similar SAE potentials, such as those suggested in [43] or generated ab initio from structure codes like [44]. The predictions from the various calcu-lations agree to within 5% at lower intensities and 15% at higher intensities when the same potential is used. As expected, the deviations are somewhat larger for differ-ent potdiffer-entials, but qualitatively the agreemdiffer-ent remains
satisfactory.
To compare directly with experiment, we volume av-erage (VA) the theoretical probabilities to account for the intensity distribution around the laser focus as in Ref. [12]. Since the carrier envelope phase (CEP) of the 6 fs pulse is not stabilized in the experiments, the cal-culations were averaged over four CEP values from 0 to
πin steps of π
4. The experimental intensity for the 6 fs data was calibrated by fitting the ion yield to a phe-nomenological model [45]. For the 30 fs data, a two-step process is implemented. The intensity was initially es-timated by fitting the ion yield to the ionization rates predicted by an analytical non-adiabatic model for ion-ization [46], resulting in an uncertainty in the intensity of less than 11%. The initial step is necessary to estab-lish an estimated intensity with an uncertainty less than the channel-closing interval. This allows us to align the experimental measured peaks to the correct channel. We then fit the Ar∗yields to the VA-TDSE results (solid lines in Fig. 2) with constrained parameters from step 1 to obtain a more accurate calibrated intensity (±2%). As a consistency check, this fitting procedure was repeated for ionization rates from the TDSE results. This produced a calibration factor in agreement with the fit to excita-tion rates within the uncertainty. With this method the location of the enhancements provides excellent markers for calibrating the experimental intensity [12].
IV. RESULTS AND DISCUSSION
The experimental yields of Ar+(squares) and Ar∗ (cir-cles) as a function of the calibrated intensity for 30 fs (a) and 6 fs (b) pulses are shown in Fig. 2. Within the experimental uncertainty, the observed ionization yields exhibit a monotonous increase with increasing intensity. However, with 30 fs pulses, some features are clearly vis-ible in the metastable yield, which are washed out for 6 fs pulses. We observe good agreement between the experimental data and the VA-TDSE calculations. In particular, the features in the Ar∗ yields at the 13- and 14-photon absorption channels are well reproduced.
In order to determine the nature of these features, we further analyze the results from the VA-TDSE cal-culations (see the Supplementary Material for joint nl
distributions). We note that the features in the 13-and 14-photon absorption channels with 30 fs pulses ap-pear near intensities where the AC Stark effect shifts the 5g (86 TW/cm2) and 6h(110 TW/cm2) states into strongest resonance, respectively. However, due to VA ef-fects the distribution of quantum states is still relatively broad, with the resonant state accounting for only 17% and 21% of the total population. As a general trend, we see that while the spread of the quantum-state distribu-tion varies widely across intensities, the most populated states remain the 6h,7hand 8hstates from the 14-photon channel onwards. Similarly, the spread in quantum state distribution varies for the 6 fs pulses, but the most
pop-70 90 110 130 150 170 190 210 230 10−4 10−3 10−2 10−1 30 fs 6 fs 0.0 0.2 0.4 0.6 0.8 1.0 Peak Intensity (TW/cm2) 0.00 0.25 0.50 0.75 1.00 P (Ar ∗ ) 12 13 14 15 16 17 18 19
FIG. 3: TDSE calculations for the total excited state proba-bility, P(Ar∗), for 30 fs pulses in blue (darker line) and 6 fs pulses in orange (lighter line) without volume averaging. The numbers above the upperxaxis correspond to the number of absorbed photons resulting in excitation within that channel. The dashed lines indicate the intensities at which an ioniza-tion channel closes.
ulated state remains at the 5g state for all intensities higher than 82 TW/cm2. Resonances with some of these states were already predicted (see, for example, Ref. [33]), but here we demonstrate that their influence on excita-tion rates are strong enough to be directly measured in our experiment even after VA and experimental instabil-ities. This is further evidence that the AC Stark effect has a significant influence on excitation rates — not only in regards to channel closings, which have been linked to similar features previously, but also due to shifted reso-nances.
The VA results include contributions from lower inten-sities that wash out or obscure patterns, making it diffi-cult to distinguish whether channel closings or resonances are the cause of these enhancements. The results of the TDSE calculations without VA provide a useful tool for distinguishing these processes and are shown in Fig. 3. The numbers displayed above the upper x axis corre-spond to the number of absorbed photons required for excitation into that channel. Successive channel closings occur at∼26 TW/cm2intervals for 800 nm photons and are marked with vertical dashed lines. The general trend is as expected, exhibiting clear enhancements with a pe-riodicity equal to the photon energy separation. For 30 fs pulses, the enhancements are more pronounced at lower intensities, reaching more than an order of magnitude in the 13- and 14-photon absorption channels, consistent to the findings reported in Ref. [12]. These particular en-hancements are significant and are observed under our experimental conditions. For 6 fs pulses, the enhance-ments are less pronounced and not resolved experimtally due to VA effects. For both pulse durations, the en-hancements occur at higher intensities than the predicted channel closings (at∼12TW/cm2 and∼22TW/cm2for 30 fs and 6 fs pulses, respectively), indicating that reso-nances rather than channel closings are the origin of these
(b)
12 13 14 15 16 17 18 19
(12 13a) 14 15 16 17 18 19
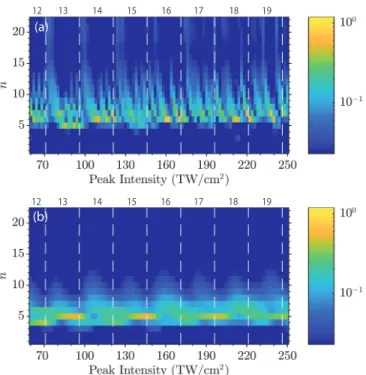
FIG. 4: Relative l distributions found by summing over
n≤22 for 30 fs (a) and 6 fs (b) pulses without volume av-eraging. The numbers above the upperxaxis correspond to the number of absorbed photons resulting in excitation within that channel. The bar graphs represent the distribution inl
summed across all intensities. For both pulse durations, the
l distribution clearly alternates between even and odd par-ity at the closure of successive ionization channels, providing evidence that an additional photon has been absorbed.
features.
In order to confirm this interpretation, we first vali-date that channel closings occur at the predicted inten-sities by analyzing the relative populations of the quan-tum angular momenquan-tum, l, for each intensity. This is done by summing thenl populations over allnand then scaling to the total probability for excitation at that in-tensity (from Fig. 3). The distribution inlexhibits par-ity, preferentially exciting even or odd states due to the dipole selection rules [47]. This has been studied pre-viously both semi-classically [48] and quantum mechan-ically [10, 11, 35, 49]. In argon, which has a 3p(l = 1) outermost electron in the ground state, the absorption of an even (odd) number of photons will preferentially populate odd (even)l’s. This is clearly observed in the
l distributions shown in Fig. 4 for both pulse durations, particularly at lower intensities. The change in parity at successive channel-closing intensities is consistent with the condition that one more photon is absorbed, thus confirming the calculated channel-closing locations.
Additionally, for 30 fs pulses, we observe that the pop-ulation distribution is localized with excitation intol= 5 dominating (c.f., the bar graph in Fig. 4). For 6 fs pulses, the most populated states remain atl= 5, but now the distribution is broadened by excitation into lowerlstates. We now look to at the relativenpopulations to analyze the patterns around channel closings. These are obtained in a similar procedure as the relativel populations, ex-cept by summing overlrather thann; see Fig. 5. In addi-tion, we correlate these observations with those in Fig. 4
(b) (a)
12 13 14 15 16 17 18 19
12 13 14 15 16 17 18 19
FIG. 5: Relativenpopulations for 30 fs (a) and 6 fs (b) pulses without volume averaging. The numbers above the upperx
axis correspond to the number of absorbed photons resulting in excitation within that channel. The dashed lines indicate the intensities at which an ionization channel closes. Highn
states are excited at the channel closing intensities, shifting to individual resonances with the 6h(for 30 fs pulses) and 5g
state (for both) as the intensity is increased further.
for a complete description of the excited-state distribu-tion. See also the supplementary material for jointnl dis-tributions. For 30 fs pulses (c.f. Fig. 5(a)), a broad range of high-lying excited states (n≥12) is populated shortly after the channel-closing intensity as the AC Stark effect shifts the Rydberg quasicontinuum into resonance. For 6 fs pulses (c.f. Fig. 5(b)) the pattern is much the same but not as obvious. This is because the pulse duration is now short compared to the Keppler orbit periods of high-lying Rydberg states, which are therefore not populated as efficiently [15]. As the intensity increases further, the distribution narrows until a strong resonance with either the 5g (for both pulse durations) or 6h(for 30 fs) state is reached.
The behavior of this resonance is markedly different for the two pulse durations. Firstly, the intensities at which the strongest resonances are reached in successive channels are different. For example, with 30 fs pulses, the strongest resonance in the 13- and 14-photon ab-sorption channels is reached with the 5g and 6h states at 86 TW/cm2 and 110 TW/cm2, respectively. On the other hand, with 6 fs pulses it is reached at 90 TW/cm2 and 122 TW/cm2. Secondly, the resonances are less dom-inant and occur over a wider range of intensities for 6 fs pulses compared to 30 fs pulses due to the larger
band-width enabling resonances over a wider range of photon energies. For example, with 30 fs pulses at 162 TW/cm2, the 6hstate accounts for almost 60% of total excitation but then drops close to zero only 4 TW/cm2 higher. In comparison, for 6 fs pulses, resonance with the 5g state occurs in a 12 TW/cm2 intensity range accounting for over 30% of relative population, peaking at 146 TW/cm2 with 35% relative population. This reduced dominance, as well as the larger intensity range where resonance is reached, accounts for the reduced magnitude of the en-hancements.
Interestingly, we note that even though the intensi-ties of these strong individual resonances are very close to those corresponding to the enhancements observed in the measurements (Fig. 2) and theoretical yields (Fig. 3), they are not the sole contributors. A detailed analy-sis of the joint nl distributions from 30 fs pulses indi-cates that the main contributions to the peaks of the 13-and 14-photon enhancements originate from AC Stark-shifted resonances with a trio of states with successive
nand same l (5g, 6g, 7g and 6h, 7h, 8h, respectively). In the case of 6 fs pulses, excitation into the 5g state mainly contributes to the enhancements in odd photon channels, while a broad distribution contributes to the observed enhancements in even photon channels, at least in the multiphoton regime where the locations of the en-hancements are obvious.
V. SUMMARY
We experimentally observed enhancements in excita-tion rates of Ar for 30 fs pulses centered at 800 nm, which were not present for few-cycle pulses of 6 fs du-ration. TDSE calculations support the existence of these enhancements even after focal-volume averaging. Due to the sensitivity of these enhancements to intensity changes, they serve as convenient markers for accurate calibration of the experimental intensity. Analysis of the TDSE predictions shows that the enhancements are due to resonant population trapping in select few states rather than the closing of an ionization channel. Vol-ume averaging effects suppress the relative populations of these states at resonant intensities. However, TDSE calculations predict that the resonances are particularly strong for select intensities when using 30 fs pulses but spread over a larger intensity range for 6 fs pulses due to the large bandwidth of the pulse. In future, enhanced excitation of the 5g and 6hstates might be exploited as a means to increase metastable yields by directly stimu-lating them into the metastable state.
ACKNOWLEDGEMENTS
This project is supported under the Australian Re-search Council’s Linkage Infrastructure, Equipment and Facilities scheme (project LE160100027). D. Chetty is
supported by an Australian Government RTP Scholar-ship. X-.M. T. was supported by a Grant-in-Aid for Scientific Research (Grant No. JP16K05495) from the Japan Society for the Promotion of Science. Further
support was provided by the United States National Sci-ence Foundation under grants No. PHY-1402899 and PHY-1708108 (BdH,JPZ) as well as No. PHY-1803844 (TP,NS,KRH,KB).
[1] T. Nubbemeyer, K. Gorling, A. Saenz, U. Eichmann, and W. Sandner, Physical Review Letters 101, 233001 (2008).
[2] H. Zimmermann, J. Buller, S. Eilzer, and U. Eichmann, Physical Review Letters114, 123003 (2015).
[3] M. Baker, A. J. Palmer, W. R. MacGillivray, and R. T. Sang, Nanotechnology15, 1356 (2004).
[4] Z.-T. Lu, P. Schlosser, W. Smethie, N. Sturchio, T. Fis-cher, B. Kennedy, R. Purtschert, J. Severinghaus, D. Solomon, T. Tanhua, et al., Earth-Science Reviews
138, 196 (2014).
[5] N. C. Sturchio, K. L. Kuhlman, R. Yokochi, P. C. Probst, W. Jiang, Z.-T. Lu, P. Mueller, and G.-M. Yang, Journal of Contaminant Hydrology160, 12 (2014).
[6] A. Knecht, Z. Alexander, Y. Bagdasarova, T. Cope, B. Delbridge, X. Fl´echard, A. Garc´ıa, R. Hong, E. Li´enard, P. Mueller, et al., in AIP Conference Pro-ceedings (AIP, 2013), vol. 1560, pp. 636–640.
[7] B. Ohayon, J. Chocron, T. Hirsh, A. Glick-Magid, Y. Mishnayot, I. Mukul, H. Rahangdale, S. Vaintraub, O. Heber, D. Gazit, et al., Hyperfine Interactions 239, 57 (2018).
[8] M. Dakka, G. Tsiminis, R. Glover, C. Perrella, J. Moffatt, N. Spooner, R. Sang, P. Light, and A. Luiten, Physical Review Letters121, 093201 (2018).
[9] M. Kohler, H. Daerr, P. Sahling, C. Sieveke, N. Jersch-abek, M. B. Kalinowski, C. Becker, and K. Sengstock, EPL (Europhysics Letters)108, 13001 (2014).
[10] Q. Li, X.-M. Tong, T. Morishita, H. Wei, and C. D. Lin, Physical Review A89, 023421 (2014).
[11] B. Piraux, F. Mota-Furtado, P. O’Mahony, A. Galstyan, and Y. V. Popov, Physical Review A96, 043403 (2017). [12] H. Zimmermann, S. Patchkovskii, M. Ivanov, and U. Eichmann, Physical Review Letters 118, 013003 (2017).
[13] N. B. Delone and V. P. Krainov, Physics-Uspekhi42, 669 (1999).
[14] R. R. Freeman, P. H. Bucksbaum, H. Milchberg, S. Darack, D. Schumacher, and M. E. Geusic, Physical Review Letters59, 1092 (1987).
[15] F. Grasbon, G. G. Paulus, H. Walther, P. Villoresi, G. Sansone, S. Stagira, M. Nisoli, and S. D. Silvestri, Physical Review Letters91, 173003 (2003).
[16] A. Rudenko, K. Zrost, C. Schr¨oter, V. De Jesus, B. Feuer-stein, R. Moshammer, and J. Ullrich, Journal of Physics B: Atomic, Molecular and Optical Physics 37, L407 (2004).
[17] P. Kruit, J. Kimman, H. G. Muller, and M. J. V. der Wiel, Journal of Physics B: Atomic and Molecular Physics16, 937 (1983).
[18] H. G. Muller, A. Tip, and M. J. van der Wiel, Journal of Physics B: Atomic and Molecular Physics 16, L679 (1983).
[19] H. G. Muller, Physical Review Letters83, 3158 (1999). [20] H. G. Muller, Physical Review A60, 1341 (1999).
[21] M. J. Nandor, M. A. Walker, L. D. V. Woerkom, and H. G. Muller, Physical Review A60, R1771 (1999). [22] H. G. Muller and F. C. Kooiman, Physical Review
Let-ters81, 1207 (1998).
[23] M. Li, P. Zhang, S. Luo, Y. Zhou, Q. Zhang, P. Lan, and P. Lu, Physical Review A92, 063404 (2015).
[24] R. R. Freeman and P. H. Bucksbaum, Journal of Physics B: Atomic, Molecular and Optical Physics 24, 325 (1991).
[25] R. M. Potvliege and S. Vuˇci´c, Journal of Physics B: Atomic, Molecular and Optical Physics 42, 055603 (2009).
[26] M. P. de Boer and H. G. Muller, Physical Review Letters
68, 2747 (1992).
[27] R. R. Jones, D. W. Schumacher, and P. H. Bucksbaum, Phys. Rev. A47, R49 (1993).
[28] T. Morishita and C. D. Lin, Physical Review A 87, 063405 (2013).
[29] E. A. Volkova, A. M. Popov, and O. V. Tikhonova, Jour-nal of Experimental and Theoretical Physics 113, 394 (2011), ISSN 1090-6509.
[30] A. M. Popov, O. V. Tikhonova, and E. A. Volkova, Jour-nal of Physics B: Atomic, Molecular and Optical Physics
36, R125 (2003).
[31] S. L. Chin and H. Xu, Journal of Physics B: Atomic, Molecular and Optical Physics49, 222003 (2016). [32] M. P. Hertlein, P. H. Bucksbaum, and H. G. Muller,
Jour-nal of Physics B: Atomic, Molecular and Optical Physics
30, L197 (1997).
[33] H. Muller, Optics Express8, 44 (2001).
[34] N. A. Hart, J. Strohaber, A. A. Kolomenskii, G. G. Paulus, D. Bauer, and H. A. Schuessler, Physical Review A93, 063426 (2016).
[35] S. Hu, X. Hao, H. Lv, M. Liu, T. Yang, H. Xu, M. Jin, D. Ding, Q. Li, W. Li, et al., Optics Express 27, 31629 (2019).
[36] F. Penent, P. Lablanquie, R. I. Hall, M. ˇZitnik, K. Buˇcar, S. Stranges, R. Richter, M. Alagia, P. Hammond, and J. G. Lambourne, Phys. Rev. Lett.86, 2758 (2001). [37] X. M. Tong and C. D. Lin, J. Phys. B: At. Mol. Opt.
Phys.38, 2593 (2005).
[38] X.-M. Tong and S.-I. Chu, Chem. Phys.217, 119 (1997). [39] A. D. Bandrauk and H. Shen, J. Chem. Phys.99, 1185
(1993).
[40] X. M. Tong, K. Hino, and N. Toshima, Phys. Rev. A74, 031405 (2006).
[41] E. V. Gryzlova, A. N. Grum-Grzhimailo, E. I. Starosel-skaya, N. Douguet, and K. Bartschat, Physical Review A
97, 013420 (2018).
[42] A. C. Brown, G. S. Armstrong, J. Benda, D. D. Clarke, J. Wragg, K. R. Hamilton, Z. Man, J. D. Gorfinkiel, and H. W. [van der Hart], Computer Physics Communica-tions250, 107062 (2020), ISSN 0010-4655.
[43] A. E. S. Green, D. L. Sellin, and A. S. Zachor, Phys. Rev.
[44] W. Eissner, M. Jones, and H. Nussbaumer, Computer Physics Communications8, 270 (1974), ISSN 0010-4655. [45] W. C. Wallace, O. Ghafur, C. Khurmi, S. Sainadh U, J. E. Calvert, D. E. Laban, M. G. Pullen, K. Bartschat, A. N. Grum-Grzhimailo, D. Wells, et al., Physical Review Letters117, 053001 (2016).
[46] M. Li, J.-W. Geng, M. Han, M.-M. Liu, L.-Y. Peng, Q. Gong, and Y. Liu, Physical Review A 93, 013402 (2016).
[47] K. Krajewska, I. I. Fabrikant, and A. F. Starace, Physical Review A86, 053410 (2012).
[48] D. G. Arb´o, K. I. Dimitriou, E. Persson, and J. Burgdrfer, Physical Review A78, 013406 (2008).
[49] Z. Chen, T. Morishita, A.-T. Le, M. Wickenhauser, X. M. Tong, and C. D. Lin, Physical Review A 74, 053405 (2006).