University of Huddersfield Repository
Ghadge, A., Fang, X., Dani, Samir and Antony, J. Supply chain risk assessment approach for process quality risks Original Citation Ghadge, A., Fang, X., Dani, Samir and Antony, J. (2017) Supply chain risk assessment approach for process quality risks. International Journal of Quality & Reliability Management. ISSN 0265671X This version is available at http://eprints.hud.ac.uk/id/eprint/28474/ The University Repository is a digital collection of the research output of the University, available on Open Access. Copyright and Moral Rights for the items on this site are retained by the individual author and/or other copyright owners. Users may access full items free of charge; copies of full text items generally can be reproduced, displayed or performed and given to third parties in any format or medium for personal research or study, educational or notforprofit purposes without prior permission or charge, provided: • The authors, title and full bibliographic details is credited in any copy; • A hyperlink and/or URL is included for the original metadata page; and • The content is not changed in any way. For more information, including our policy and submission procedure, please contact the Repository Team at: [email protected]. http://eprints.hud.ac.uk/Ghadge, A., Fang, X., Dani, S. & Antony, J. (2017), Supply chain risk assessment approach for process quality risks, International Journal of Quality and Reliability Management, 34 (6).
Supply chain risk assessment approach for process quality risks
Abstract
Purpose- The purpose of the paper is to proactively analyse and mitigate root causes of the process quality risks. The case study approach examines the effectiveness of the fuzzy logic approach for assessing the product and process related failure modes within global supply chain context.
Design/Methodology/approach- The case study of a printed circuit board company in China is used as a platform for conducting the research. Using data triangulation, the data is collected and analysed through interviews, questionnaires, expert opinions and quantitative modelling for drawing useful insights.
Findings- The fuzzy logic approach to FMEA provides a structured approach for understanding complex behaviour of failure modes and their associated risks for products and processes. Supply Chain Managers should conduct robust risk assessment during the design stage to avoid product safety and security risks.
Research Limitations/implications- The research is based on a single case study. Multiple cases from different industry sectors may support in generalising the findings.
Originality/Value- The study attempts to mitigate the root causes of product and processes using fuzzy approach to FMEA in supply chain network.
Keywords- Fuzzy, FMEA, Supply Chain Risk Management, Product Safety and Security
Paper Type- Research paper
1. INTRODUCTION
The product safety and security risks not only pose a threat to the public, but also impacts the brand reputation and market share of the organization. Product related risks are associated with
the negative consequences in terms of physical injury, contamination or loss of performance. Recent vehicle and food recalls has raised the issue of product safety and security to its peak. Such frequent incidents evidence the necessity to conduct the root cause analysis (Kumar and Schmitz, 2011; Marucheck et al., 2011). Failure Mode and Effect Analysis (FMEA) helps in improving the product quality and delivery performance by proactively identifying and mitigating risks. Fuzzy FMEA is the improved methodology for the risk assessment, as it overcomes the limitations of the traditional risk prioritization technique (Liu et al., 2013). In this paper, risks originating from different processes impacting the quality of the product are analysed and compared using both the traditional and fuzzy logic approach to the FMEA.
The need for high quality management standards has been realized by the organizations in pursuing global competitive position. The product quality and safety are the prime competitive factors for the today’s Manufacturers. Continuous improvements with a focus on the customer service can help companies survive in increasingly aggressive market and maintain the leading position. The focus of organizations is shifting from the reactive-based approach to the prevention-based approach (Chen, 2013). In quality management this means focusing beyond inspecting and correcting defective items into improving product quality by emphasizing on the manufacturing process. This shift is found to be due to the variety of reasons such as changing customer requirements, competition and continuous improvement philosophy.
The majority of the product quality-related problems are caused due to inappropriate design and manufacturing process (Dale et al., 2007). In the preventive approach, product and process quality is directed by its inputs such as people, machines, materials, methods, measurements and the environment. It is looked upon as the process-oriented philosophy that aims to enhance customer satisfaction by preventing the non-conforming products being produced. The transformation from the detection to prevention approach requires not just the use of a set of tools and techniques, but the development of a new operating philosophy and/or
approach in the way of thinking. The process-oriented methodologies have not been well investigated in the manufacturing industry. In this paper, fuzzy approach to FMEA is applied as an alternative to overcome the weaknesses in the traditional FMEA. Continuous improvement process is necessary to mitigate product recall risks (Pyke and tang, 2010). The research aims to determine whether fuzzy interface FMEA provides a robust preventive method to assess such risks in the supply chains. Mixed research approach to the data collection and analysis attempts to understand the behavior of supply chain risks from a process quality perspective.
The objective of the study is to analyze and mitigate the root causes of the product and security risks proactively. The fuzzy logic approach to FMEA attempts to conduct logical risk assessment for drawing strong inferences. Literature review begins with a discussion on product safety and security risks. Fuzzy FMEA and its comparison with the traditional FMEA is discussed in the later section to build platform for the research study. Applied mixed research methodology attempts to capture primary and secondary data in the next section. Later, selected case study is introduced to discuss the findings for the study. In the end, conclusions and future research is discussed along with the limitations and managerial implications.
2. LITERATURE REVIEW
2.1. Product safety and security risk
A series of recent recalls in food (horse meat), medicine (energy supplements) and vehicle (auto and aircraft manufacturers) sectors have dampened the public confidence in safety and security provided by the manufacturers and the governments. In case of the vehicle recalls, safety risks have cascaded in terms of lost sales, reduced manufacturing output, increased marketing cost and reduction in the new variants. Product recalls can also lead to an erosion of brand equity, loss of consumer confidence, and may have legal consequences such as lawsuit and bankruptcy (Bates et al., 2005). Several researchers are focusing on finding the root causes
of such risks before it cascades as a ‘global disaster’. It has been observed through above and several other similar cases from the automotive and food sector that the single product safety and security failure can have a wider consequence on the global supply chain network. Assuring the safety, security and reliability of products and services used by the consumers is the prime focus of today's businesses. According to Qvale (2013), reliability is primarily concerned with the systems capability to resist external attack and safety is related to special kind of failure causing disastrous consequences. Although product safety and security are defined and treated as independent, we believe that safety and security risks are interrelated and strongly influence each other.
In the current dynamic environment the quality issues caused by the manufacturing defects are the major concern to complex international supply chain networks. The customer tends to focus on the quality than cost while selecting their products from the global market. Foster et al. (2011) argued that quality builds the buyer-supplier relationships with other focus on various non-price based factors. Karim et al. (2008) initiated a survey based on 1000 manufacturers in Australia and found that product quality and reliability were the main competitive factors compared to the price. The supplier quality can have a considerable impact on the overall cost of the product or service (Soltani et al. 2011). Thus, it is vital for the companies to employ a continuous quality improvement approach to cope with the increased competition and continuous changing environments.
With a volatile global market, companies cannot solely depend on the conventional quality management methods (such as TQM, Lean philosophy) and hence strongly need to reassess the quality-based practices (Mehra and Agrawal, 2003). Current quality management research emphasizes a process-oriented approach rather than a result-oriented approach. “Manufacturing problems, failure analysis, prediction and product data management have not been well investigated” (Karim et al., 2008). There is an evident need for understanding the process quality risks within the context of supply chain network management. Hence,
managing safety and security risks has become one of the priorities of current researchers and practitioners in broad domain of Supply Chain Risk Management (SCRM).
2.2. Fuzzy FMEA
Vagueness, ambiguousness or imprecision are commonly referred to as 'fuzziness'. Fuzzy logic primarily focuses on quantifying the approximations in human thoughts and perceptions (Kahraman et al., 2000). FMEA has been widely used technique to identify and eliminate potential failures to improve the safety and reliability of the system. FMEA predicts Risk Priority Number (RPN) to measure the level of failure modes for a product or system. This information can be further used to mitigate the risks by making appropriate decisions. RPN is determined by three variables of the product namely severity, probability and detectability. In spite of its universal application, FMEA has multiple limitations such as difficulty to predict probability of an event (Xu et al., 2002), questionable criterion and formulation of RPN's, equally weighted RPN values creating evaluation complexity (Song et al., 2013), several interdependencies being neglected (Wang et al., 2009) and impracticality in assessing multiple failure modes with all possible combinations (Xiao et al., 2011). Recently Liu et al. (2013) provided a comprehensive list of all shortcomings through literature review on FMEA for the risk evaluation.
With so many limitations, the FMEA technique needs refinement and improvement (Gilchrist, 1993). Several researchers propose to combine AHP, ANP, TOPSIS and similar other methods to overcome some of the FMEA's limitations. Kumar and Chaturvedi (2011) use similar approach for improving maintainace plan for industrial equipment. Rational and accurate results still cannot be guaranteed following these methods. Hence, fuzzy logic-based approaches are being increasingly practiced. Kumar et al. (2007) uses fuzzy logic RCA and FMEA approach to analyse system failure for maintainace actions. Selim et al (2015) proposes maintainace planning framework using fuzzy TOPSIS approach. Several applications of fuzzy logic are evident in the recent literature (e.g. Vinodh et al., 2012; Wang et al., 2012; Kumru
and Kumru, 2013; Haq, and Boddu, 2014; Aqlan, and Lam, 2015). This modal shift is evident in the recent academic publications published in multiple production, supply chain, quality, reliability and risk management journals. Different linguistic terms are expressed in trapezoidal or triangular fuzzy numbers to assess the ratings and weights for the risk variables in Fuzzy FMEA approach (Wang et al., 2009). Linguistic terms such as likely, important and very high are converted into tangible numbers. Each linguistic term can be modelled by a corresponding trapezoidal or triangular membership function (Wulan and Petrovic, 2012). Fuzzy logic based FMEA incorporates expert's knowledge and expertise to weight subjective and objective values of risk variables for a robust evaluation.
Speier et al. (2011) uses a multi method approach to identify factors influencing safety and security risks leading to the product recalls. Bates et al. (2007) follows regression analysis to predict increased safety and security risk due to vehicle recalls. According to Marucheck et al. (2011), how supply chains can learn to face product safety and recall issues is still an open research question. Tse and Tan (2012) handle quality and safety issue in product recalls by proposing marginal incremental approach. These are some of the recent research studies into identifying and mitigating safety and security risks. Limited literature clearly presents a gap and need for further research in this area.
3. RESEARCH METHODOLOGY
Data triangulation establishes the validity of research by combining qualitative and quantitative methodologies (Malterud, 2001). In this research, the mixed methods approach is used to analyse process quality risks. Qualitative data is associated with the opinions, views and perceptions while quantitative data refer to the numerical and measurable data (Saunders et al., 2009). Primary as well as secondary data sources were used as seen in the Figure 1 to capture the holistic nature of safety and security risks within supply chain network. For analysis, the linguistic fuzzy logic is applied to the FMEA method to compare and contrast
results for insightful findings. For collecting the primary data, semi-structured interviews with the organization’s Process Engineers and Managers were conducted to understand the manufacturing process and identify potential causes for the failure. The findings from these interviews along with the secondary data from the organization were used to collate all the potential process risks. The operational level employees using the traditional FMEA technique prioritized these risks through a questionnaire survey. This information was later used to generate a linguistic fuzzy logic process for prioritizing the risk events associated with the product design, process and service delivery. The fuzzy rule based model was developed and tested using the MATLAB programming platform.
Figure 1. Data collection sources
FMEA is an excellent tool for evaluating the potential failures and risks throughout the design, process and service stages. It helps in quality improvement, defect reduction and on time delivery. Despite the importance of FMEA in improving the product quality, studies using FMEA approach for the supply chain network are notably lacking, highlighting the importance of this research. Conventional FMEA has several shortcomings as seen in the literature and this could be one of the reasons for the reluctance to using this approach within supply chain context. However, different improved approaches in FMEA are developed to overcome such shortcomings. One such approach is to use fuzzy logic based approach to FMEA. The fuzzy
logic-based method for prioritizing failures was first developed by Bowles and Peláez (Xu et al., 2002). Fuzzy theory reduces the bias related to the judgments made by the experts in prioritizing the risks (Yeh and Chen, 2014). The paper aims to adopt this approach to assess the failures throughout the manufacturing process; thus help supply chain network to improve the product quality and increase customer satisfaction by mitigating such foreseen risks.
Type of interview (quantity)
Position held Purpose of interview
In-depth (1) Supply Chain Manager
To understand company’s supply chain network.
In-depth (1) Customer Service Manager
Introduction to the problem and factors influencing the product quality. In-depth (1) Production
Manager
To understand the product requirements and production processes.
Semi-structured (3) Chief Process Engineer
To identify the sub-processes with its functions and requirements. Assess potential failure mode and failure
effects of each failure mode. Semi-structured (2) Quality Manager To confirm the evaluations for all main
production processes.
Table I: List of interviews
4. CASE STUDY: PCB SUPPLY CHAIN NETWORK
A Printed Circuit Board (PCB) company in China was used as a platform for conducting research through data collection, analysis and implementation. The PCB’s are commonly used in the automotive industry, digital products, communication network, power supply, etc. However they belong to category of the customized products, where each customer has their own product design specifications to suit the required product assembly. It means, unlike other
unified products, they cannot be reused, even if large quantities of goods are returned. The non-conforming PCBs have to be scrapped in the majority of situations, as they cannot be repaired or remanufactured to suit the specifications. This serious quality issues during the design and manufacturing not only creates huge loss for the manufacturer, but also the rest of supply chain network by impacting on the lead-time and customer satisfaction. The case company operates with the global customers and hence it is critical to reduce the potential failures and ensure on time delivery to remain competitive in market. This reflects the complex and competitive nature of supply chain network for the PCB products.
In order to understand the problem from supply chain perspective a series of interviews were undertaken with the PCB company employees. Structured and semi-structured interviews were conducted via telephone and in person. Five in-depth and five semi-structured interviews were carried out as shown in Table I. Three in-depth interviews were conducted to understand the company’s supply chain and the challenges with its products. Five semi-structured interviews focused on identifying the manufacturing process with its functions and to assess potential failure mode with their impact. Two in-depth interviews were conducted with the Quality Experts in the company to confirm the results of the previous interviews. The secondary data consisting of process flow charts, company annual reports and product return information was also used to enhance the quality of the data. The aim of this stage was to achieve the severity, occurrence and detection ranking of each failure modes and effects. This requires the reliability of the ratings therefore a questionnaire was developed to facilitate the data collection activity.
Figure 2. PCB sales revenue in terms of industry sector
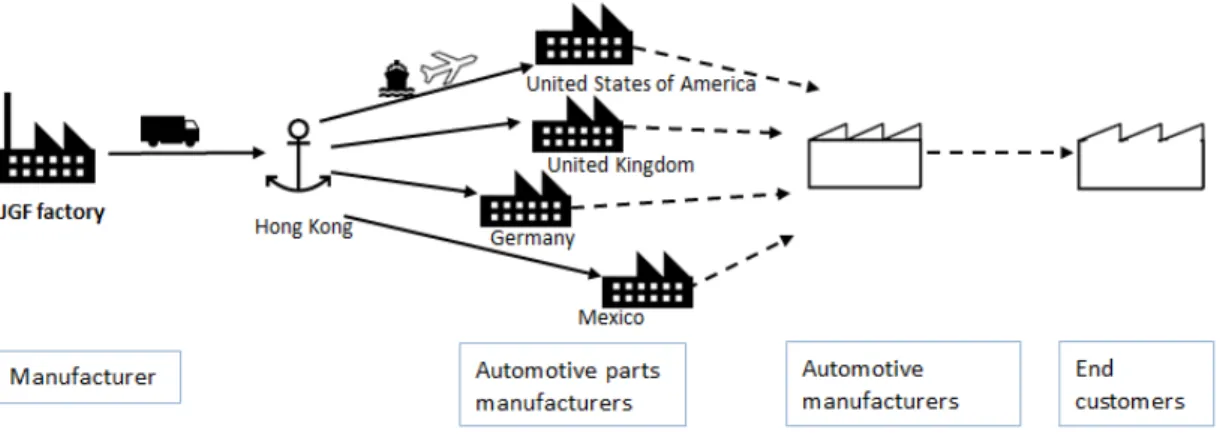
PCB Company selected for the study is one of the world’s top 10 printed circuit board manufacturer located in China. The company was found in 2001 at Jiangmen, Guangzhou province of China. Conventional rigid PCBs are the major product of the company and the sales revenue for the automotive industry accounts for 40 percent with other revenues generated from the electronics and power industry as shown in the Figure 2. Typical PCB supply chain network configuration can be seen in the Figure 3. The local market is the PCB Company’s major supply source for producing laminates, a PCB raw material. This near-sourcing arrangement drastically reduces not just the lead-time within the (supplier and manufacturer) network but also provides stable raw material supply and ability to design tailor-made laminates at a competitive price. The PCB manufacturing company focuses on the quality management aspects involved in the production. The customized, finished PCBs are then transhipped to Hong Kong, (due to lower tax considerations) for marketing to the global customers. The PCB products are then shipped to the different automotive part manufacturers and electronic gadget manufacturers spread across the globe. The automotive part manufactures supply the automotive components to the automotive OEM’s with PCB’s
40%
15% 13%
12% 20%
Industry sector breakdown
1. Automotive 2. Digital Products 3. Communication Network 4. Power Supply 5. Others
embedded in it to meet the functional requirements of each component. The end customer driving the car completes the PCB supply chain network for the automotive sector.
Figure 3. PCB supply chain network configuration
5. DATA ANALYSIS
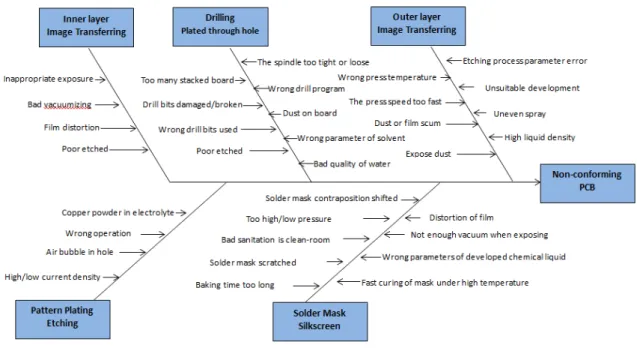
Based on the data collected from multiple sources, the most critical processes that impacted the supply chain network were selected for the further analysis. Quality Experts and Process Engineers identified five major processes of the PCB manufacturing. They further identified the ways in which these critical processes would potentially fail. Additional potential causes and effects recorded using customer complaint database were combined and categorized together. Potential failure modes, effects and causes were identified for each process involved in the manufacturing of PCB’s as seen in the Figure 4. The fish bone diagram shows the different causes associated with each process propagating as a product quality risk further leading to non-conforming PCB’s. Potential sources of failure and their variation identified through the isehkawa diagram provide the platform for conducting the FMEA analysis to identify the highest priority issues and assign actions.
Figure 4. Process wise failure causes for defective PCB
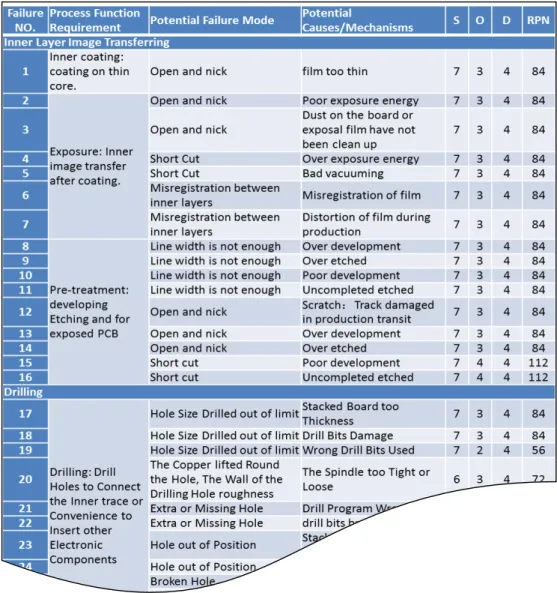
With the help of questionnaire survey and interview data, 80 different failure modes were identified in terms of PCB production process. Questionnaires containing the information to the different failure modes and current process controls were sent to the Process Engineers, Managers and some operational level employees. A snapshot provided in Figure 5 shows the extensive information collected for each failure mode and classified into earlier identified five key processes involved in PCB manufacturing. Ratings were provided for each failure mode based on the expert’s experience and guideline scales provided for the benchmarking. There are several scales proposed by the different researchers in the past for FMEA. We selected the one implemented by the majority of the academics and practitioners. Liu et al. (2013) through his extensive literature review on FMEA suggests a 10-point rating scale for severity, probability and detectability variables (provided in the appendix). In order to ensure data accuracy, all the ratings were reviewed and confirmed by the Quality Advisor and Process Manager. Each failure mode was assessed from three categories, which are the occurrence of failure causes, the severity of failure effects and the detectability of failure modes. The overall Risk Priority Number (RPN) was obtained by multiplying the values of three assessments
following the conventional FMEA approach. The RPN values determine the failure mode that should be prioritized for the mitigation action.
Figure 5. Snapshot of the failure modes identified
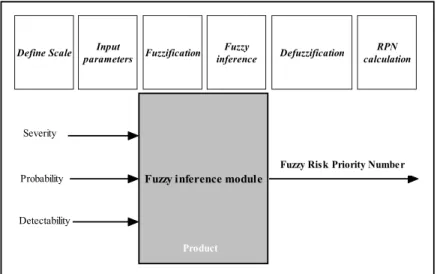
In fuzzy logic based FMEA approach, three variables namely severity, probability and detectability are identified for each case, based on a predefined scale. Fuzzification, fuzzy interface and defuzzification are the three systematic processes followed in any standard fuzzy expert system (Sharma et al., 2005). In the fuzzy interface module the risk variables are applied with membership functions to predict the degree of relationship. Figure 6 shows a pictorial representation of a triangular membership function. After evaluating the result of a fuzzy rule,
a fuzzy conclusion is obtained. This process is also called as a fuzzy inference. The process of Fuzzy FMEA is shown in Figure 7.
Figure 6. Risk membership function
The crisp input is converted to fuzzy input in the fuzzy interface module. During defuzzification, these values are extracted into confidence values. The defuzzification process aims to obtain a crisp result from the associated fuzzy conclusion. According to the defuzzified crisp rankings, the prioritization level for the failure mode could be achieved. Different algorithms can be used for the defuzzification process but the most popular ‘Center of Gravity’ (COG) algorithm was applied to the data.
Figure 7. Fuzzy logic approach to FMEA (Meng Tay and Peng Lim, 2006; Xu et al., 2002) Fuzzy inference module
Severity
Probability
Detectability
Fuzzy Risk Priority Number
Product
Input
parameters Fuzzification inferenceFuzzy Defuzzification calculationRPN Define Scale
Following above process for the fuzzy logic approach to the FMEA, fuzzy RPN numbers were calculated in the next phase. The MATLAB software program was used to model the fuzzy logic-based FMEA. The model integrates three inputs, fuzzy rule base and one output (refer to Figure 7). Therefore membership functions of the three inputs and the output variables need to be defined to generate results. A fuzzy logic platform in MATLAB named ‘Mamdani mechanism’ was employed to calculate the rule result and then the result were defuzzified by the Center of Gravity method as mentioned earlier. The expert opinion was fed to the MATLAB software program to construct the fuzzy rules. The fuzzy rules are formulated by assigning a risk degree for various combinations of failure occurrence, severity and detectability. 40 different fuzzy rules were developed to analyse the data, example of the developed rules is shown in Figure 8.
Figure 8. Example of the developed fuzzy rules.
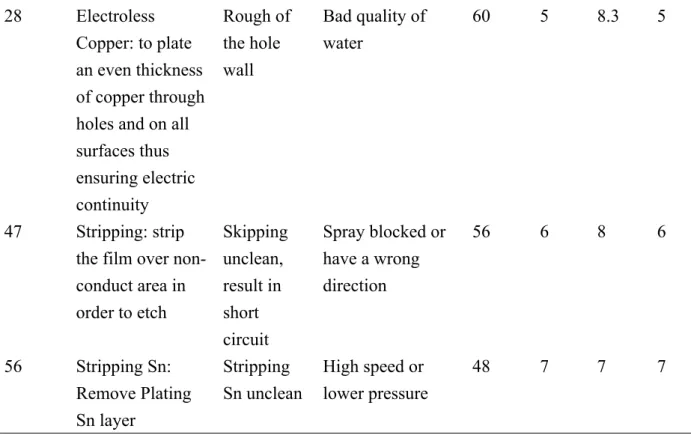
In the end, the fuzzy RPNs for each failure mode were calculated based on the fuzzy rule model. The comparison of the results between the RPN’s of the traditional FMEA and the fuzzy FMEA were plotted to see if there is significant variation in prioritizing the risks. Table II shows the selective failure modes with their RPN values for the conventional and fuzzy approach.
Failure Number (For E.g.) Process: Function Requirement Potential Failure Mode Potential Causes RPN RPN Ran k Fuzz y RPN Fuzzy RPN Rank 15 Pre-treatment: developing Etching and for exposed PCB Short cracks expected Incomplete etching process 112 1 9 3
80 Baking: Cure the solder masks after printing Solder mask peel off Baking is not enough and Control the holding time of silkscreen 98 2 9.7 1 36 Image transfer: transfer the image onto outside of the board to meet the requirements
Open circuit
Dust or film scum 84 3 8.4 4
63 Pattern Plating: Add the thickness of conduct copper and drill hole wall copper, in order to meet customer's requirement Copper thickness too thin Output lower current 84 3 9. 2 2 20 Drilling: Drill Holes to Connect the Inner trace or Convenience to Insert other Electronic Components The Copper lifted Round the Hole, The Wall of the Drilling Hole roughness
The Spindle too Tight or Loose
28 Electroless Copper: to plate an even thickness of copper through holes and on all surfaces thus ensuring electric continuity Rough of the hole wall Bad quality of water 60 5 8.3 5 47 Stripping: strip the film over non-conduct area in order to etch Skipping unclean, result in short circuit Spray blocked or have a wrong direction 56 6 8 6 56 Stripping Sn: Remove Plating Sn layer Stripping Sn unclean High speed or lower pressure 48 7 7 7
Table II. Prioritization of failure modes conventional versus fuzzy FMEA
6. KEY FINDINGS
Due to uncertainty and ambiguity found in the FMEA, fuzzy rule based RPN’s are calculated and then compared with the conventional RPN numbers. Table II presents eight examples of the failure modes identified within the PCB production process for clarity. For the first example in Table II, it can be observed that, the failure modes (with O, S and D rankings) produced highest value of RPN following the traditional FMEA approach. However, same failure mode is ranked third when fuzzy FMEA is applied. A careful comparison of these failure modes (15 and 80), shows that non-conformance of PCB due to probability of cracks being developed (due to incomplete etching) is less likely failure means than the solder mask peeling off during baking. The fuzzy RPN number has carefully considered the expert opinion and holistic risks based on their likelihood of occurrence and chance of detectability, given
the severity of the failure mode is same. It is also found that the failure modes with different characteristics, but based on the same RPN values could not be differentiated using the conventional FMEA approach. Fuzzy rule based method is robust in its approach to provide RPN rankings for such failure modes. For example, failure mode 36 and 63 (as seen in the Table II) has same value of RPN and its difficult to rank them, but fuzzy RPN provides fractional values to prioritize such risks by considering the combinations of three inputs (O, S and D) in the form of If- Then rules. If the RPN numerical ranking data contains a range of uncertainty, the RPN ranking could be misrepresentative. One of the evident advantages of the fuzzy RPN approach is that the qualitative data (such as the construction of rule base and the linguistic ratings) and quantitative data (such as the numerical ratings of O, S and D) can be both used together to assess the orders of the failure modes in a consistent fashion.
The comparative results in Table II shows that, a more reasonable ranking can be obtained by using the fuzzy rule based FMEA approach to assess the orders of failure problems. This approach allows assigning the relative importance of O, S and D that more conforms to the real situations (Pillay and Wang, 2003). According to the rankings produced by the fuzzy FMEA methodology, the next step is to develop recommended actions. These could be developed once the risks are prioritized. Fuzzy FMEA approach exhibits more realistic scenarios to reduce the risk factors involved in the advancement of manufacturing process or product design. This will enable reduction of the failure possibility and the improvement of the way to expose non-conforming PCB. While conducting FMEA, it is important to assign the responsibility and target completion date for each recommended action. The actions taken should be recorded. When actions have been implemented, revised ratings should be entered for the severity, occurrence and detection rankings, based on the action taken. If further action is considered necessary, the process should be repeated to keep the continuous improvement. Internal process controls can be used to eliminate or reduce the occurrence of potential process problems before they cascade into the supply chain network.
The data regarding current process controls obtained through interviews to be used as a mitigation plan for critical failure modes based on their priority.
7. CONCLUSION
The case study presents systematic approach to risk identification, assessment and prioritization. The research provides directions for the effective assessment of process quality risks within SC network. The fuzzy rule based FMEA represents an effective methodology for improving the process quality and reliability by prioritizing the failure problems throughout the process. We demonstrate how results could provide comprehensive understanding of the failure modes in manufacturing processes. Liu et al. (2013) found that fuzzy FMEA approach is better than other approaches (for risk identification) such as grey theory, cost based modelling, AHP/ANP and linear programming. The assessment clearly shows that the focus of total quality management needs to shift further (from inspection, control and assurance) to risk assessment of product and process quality. It is evident that detecting the non-conforming product at design or manufacturing stage is vital for avoiding safety and security risks involves before it flows downstream the supply chain. Researchers and practitioners of the quality management usually stress more on management with little attention on processes (Karim et al., 2008). The research evidently shows the need for focus on processes and their associated risks. Li and Warfield (2011) also emphasized on the need for assuring the quality performance in the global supply chain network. The Fuzzy RPN’s provides accurate and transparent insights into impending failures involved in the product and process design. The research contributes by evidently showing the performance of both FMEA approaches on a challenging case study on supply chain network. The approach presented in this paper can be used for identifying process quality risks within complex networks. Fuzzy logic based approach allows using linguistic variables, that are developed based on expert knowledge and experience (Al-Najjar and Alsyouf, 2003). This knowledge driven, preventive approach is vital for today’s
Managers in proactively mitigating the unforeseen risks. Predictive and preventive risk assessment approach using fuzzy FMEA is vital for creating resilient supply chain network. A number of limitations can be identified from the study. The current research is limited to the single case study. Insights drawn from similar multiple cases could provide directions for developing a possible risk management framework incorporating fuzzy FMEA for product and process quality. Another limitation could be that the process related data is limited to the five processes for PCB manufacturing and does not holistically considers the bigger SC process during the analysis. It is clear that FMEA-practicing supply chain network may have a better performance than non-users of FMEA methodology. It is believed that the supply chain practitioners can proactively mitigate oncoming risks by understanding their behaviour in the supply chain design phase itself. Further developed research in this direction will help academics and practitioners to gain insights into understanding complex and volatile performance of network risks from a process quality perspective. Product quality is directly associated with safety and security risk and it is vital to control such failure modes within complex supply chain network. The research findings justify the need for supply chain risk assessment activity during product and process design stage to reduce the cascading impact on complete supply chain network. The research discussed in the paper is believed to support the ongoing research in mitigating product safety and security risks.
References
Al-Najjar, B. and Alsyouf, I. (2003), “Selecting the most efficient maintenance approach using fuzzy multiple criteria decision making”, International journal of production economics, Vol. 84 No. 1, pp. 85-100.
Aqlan, F. and Lam, S. S. (2015), “A fuzzy-based integrated framework for supply chain risk assessment”, International Journal of Production Economics, Vol. 161, pp. 54-63. Bates, H., Holweg, M., Lewis, M. and Oliver, N. (2007), “Motor vehicle recalls: Trends,
Bowles, J. B. and Pelaez, C. E. (1995), “Fuzzy logic prioritization of failures in a system failure mode, effects and criticality analysis”, Reliability Engineering and System Safety, Vol. 50, pp. 203–213.
Chen, C.-C. (2013), “A developed autonomous preventive maintenance programme using RCA and FMEA”, International Journal of Production Research, Vol. 51 No. 18, pp. 5404–5412.
Dale, B.G., Wiele, T.V.D., and Iwaarden, J.V. (ed.) (2007), Managing quality, Oxford: Blackwell Publishing.
Foster, S. T., Wallin, C., and Ogden, J. (2011), “Towards a better understanding of supply chain quality management practices”, International Journal of Production Research, Vol. 49 No. 8, pp. 2285–2300.
Gilchrist, W. (1993), “Modelling failure modes and effects analysis”, International Journal of Quality and Reliability Management, Vol. 10, pp. 16–23.
Haq, A. N., and Boddu, V. (2014), “Analysis of enablers for the implementation of leagile supply chain management using an integrated fuzzy QFD approach”, Journal of Intelligent Manufacturing, pp. 1-12.
Kahraman, C., Tolga, E., and Ulukan, Z. (2000), “Justification of manufacturing technologies using fuzzy benefit/cost ratio analysis”, International Journal of Production Economics, Vol. 66 No. 1, pp. 45-52.
Karim M.A., Smith A.J.R. and Halgamuge S. (2008), “Empirical relationships between some manufacturing practices and performance”, International Journal of Production Research, Vol. 46 pp. 13, pp. 3583–3613.
Kumar. E. V. and Chaturvedi, S.K. (2011),"Prioritization of maintenance tasks on industrial equipment for reliability", International Journal of Quality and Reliability Management, Vol. 28 No. 1, pp. 109-126.
Kumar, S. and Schmitz, S. (2011), “Managing recalls in a consumer product supply chain–root cause analysis and measures to mitigate risks”, International Journal of Production Research, Vol. 49 No. 1, pp. 235-253.
Kumru, M. and Kumru, P.Y. (2013), “Fuzzy FMEA application to improve purchasing process in a public hospital”, Applied Soft Computing, Vol. 13 No. 1, pp.721–733.
Li, L. and Warfield, J. N. (2011), “Perspectives on quality coordination and assurance in global supply chains”, International Journal of Production Research, Vol. 49 No. 1. Pp. 1-4. Liu, H-C, Liu, L. and Liu, N. (2013), “Risk evaluation approaches in failure mode and effects
analysis: A literature review”, Expert Systems with Applications, Vol. 40 No. 2, pp.82-838.
Malterud, K. (2001), Qualitative research: standards, challenges, and guidelines, The lancet, 358(9280), pp. 483-488.
Marucheck, A., Greis, N., Mena, C., and Cai, L. (2011), “Product safety and security in the global supply chain: Issues, challenges and research opportunities”, Journal of Operations Management, Vol. 29 No. 7, pp. 707-720.
Mehra, S. and Agrawal SP. (2003), “Total quality as a new global competitive strategy”, International Journal of Quality and Reliability Management, Vol. 20 No. 9, pp. 1009-1025.
Meng Tay, K. and Peng Lim, C. (2006), “Fuzzy FMEA with a guided rules reduction system for prioritization of failures”, International Journal of Quality and Reliability Management, Vol. 23 No. 8, pp. 1047-1066.
Pillay, A. and Wang, J. (2003), “Modified failure mode and effects analysis using approximate reasoning”, Reliability Engineering and System Safety, Vol. 79 No. 1, pp. 69-85.
Pyke, D. and Tang, C. S. (2010), “How to mitigate product safety risks proactively? Process, challenges and opportunities”, International Journal of Logistics: Research and Applications, Vol. 13 No. 4, pp. 243-256.
Qvale, T. (Ed.). (2013), Reliability and safety in hazardous work systems: approaches to analysis and design, Psychology Press.
Saunders, M., Lewis, P., and Tornhill, A. (2009), Research methods for business students, 4th ed., Harlow: FT Prentice Hall.
Selim, H., Yunusoglu, M.G. and Yılmaz Balaman, Ş. (2015), “A Dynamic Maintenance Planning Framework Based on Fuzzy TOPSIS and FMEA: Application in an International Food Company”, Quality and Reliability Engineering International.
Sharma, R. K., Kumar, D., and Kumar, P. (2005), “Systematic failure mode effect analysis (FMEA) using fuzzy linguistic modelling”, International Journal of Quality and Reliability Management, Vol. 22 No. 9, pp. 986-1004.
Soltani, E., Azadegan, A., Liao, Y.-Y., and Phillips, P. (2011), “Quality performance in a global supply chain: finding out the weak link”, International Journal of Production Research, Vol. 49 No. 1, pp. 269–293.
Song, W., Ming, X., Wu, Z. and Zhu, B. (2013), “Failure modes and effects analysis using integrated weight-based fuzzy TOPSIS”, International Journal of Computer Integrated Manufacturing, Vol. 26 No. 12, pp. 1172-1186.
Speier, C., Whipple, J. M., Closs, D. J. and Voss, M. D. (2011), "Global supply chain design considerations: Mitigating product safety and security risks", Journal of Operations Management, Vol. 29 No. 7, pp. 721-736.
Tse, Y. K. and Tan, K. H. (2012), “Managing product quality risk and visibility in multi-layer supply chain”, International journal of production economics, Vol. 139 No. 1, pp. 49-57. Vinodh, S. Aravindraj, S., Sathya Narayanan, R. and Yogeshwaran, N. (2012), “Fuzzy assessment of FMEA for rotary switches: a case study”, Total Quality Management Journal, Vol. 24 No. 5, pp. 461–475.
Wang, X., Chan, H. K., Yee, R. W., and Diaz-Rainey, I. (2012), “A two-stage fuzzy-AHP model for risk assessment of implementing green initiatives in the fashion supply chain”, International Journal of Production Economics, Vol. 135 No.2, pp. 595-606.
Wang, Y. M., Chin, K. S., Poon, G. K. K., and Yang, J. B. (2009), “Risk evaluation in failure mode and effects analysis using fuzzy weighted geometric mean”, Expert Systems with Applications, Vol. 36 No. 2, pp. 1195-1207.
Wulan, M. and Petrovic, D. (2012), “A fuzzy logic based system for risk analysis and evaluation within enterprise collaborations”, Computers in Industry, Vol. 63 No. 8, pp. 739-748.
Xiao, N. C., Huang, H. Z., Li, Y. F., He, L. P., and Jin, T. D. (2011), “Multiple failure modes analysis and weighted risk priority number evaluation in FMEA”, Engineering Failure Analysis, Vol. 18, pp. 1162–1170.
Xu, K., Tang, L. C., Xie, M., Ho, S. L. and Zhu, M. L. (2002). Fuzzy assessment of FMEA for engine systems. Reliability Engineering and System Safety, Vol. 75, pp. 17–29.
Yeh, T. M. and Chen, L. Y. (2014), “Fuzzy-based risk priority number in FMEA for semiconductor wafer processes”, International Journal of Production Research, Vol. 52 No. 2, pp. 539-549.