PDF hosted at the Radboud Repository of the Radboud University
Nijmegen
The following full text is a publisher's version.
For additional information about this publication click this link. http://hdl.handle.net/2066/144035
Please be advised that this information was generated on 2017-12-05 and may be subject to change.
Automated analysis of
tuberculosis in chest radiographs
Development and Validation
This book was typeset by the author using LATEX 2ε.
Cover design by Rachel van Esschoten, DivingDuck Design (www.divingduckdesign.nl).
Financial support for publication of this thesis was kindly provided by the department of radiology of the Radboud University Medical Center (Nijmegen, The Netherlands), and the Advanced School for Computing and Imaging (ASCI).
Printed by Vantilt Uitgeverij (Nijmegen, the Netherlands). ISBN: 978-94-6259-857-7
Copyright © 2015 by Pragnya Maduskar. All rights reserved. No part of this publication may be reproduced or transmitted, in any form or by any means, electronic or mechanical, including photocopy, recording or any information storage and retrival system, without permission in writing from the author.
Automated analysis of
tuberculosis in chest radiographs
Development and Validation
Proefschrift
ter verkrijging van de graad van doctor aan de Radboud Universiteit Nijmegen
op gezag van de rector magnificus prof. dr. Th.L.M. Engelen, volgens besluit van het college van decanen
in het openbaar te verdedigen op donderdag 22 oktober 2015 om 10.30 uur precies
door
Pragnya Maduskar
geboren op 5 januari 1985 te Sarni, Madhya Pradesh, India
Promotor: Prof. dr. B. van Ginneken
Copromotor: Dr. ir. C.I. Sánchez
Manuscriptcommissie: Prof. dr. D. van Soolingen Prof. dr. ir. M.A. Viergever Universiteit Utrecht
Prof. dr. F. Cobelens Universiteit van Amsterdam
Advanced School for Computing and Imaging
The research described in this thesis was carried out at the Diagnostic Image Anal-ysis Group, Radboud University Medical Center (Nijmegen, the Netherlands). This work was carried out in the Advanced School for Computing and Imaging (ASCI) graduate school (ASCI dissertation series number 340).
This research was funded by the European and Developing Countries Clinical Tri-als Partnership (EDCTP) grant (TB-NEAT; IP.2009.32040.009): the Evaluation of multiple novel and emerging technologies for TB diagnosis, in smear-negative and HIV-infected persons, in high burden countries (TB-NEAT project).
Automated analysis of
tuberculosis in chest radiographs
Development and Validation
Doctoral Thesis
to obtain the degree of doctor from Radboud University Nijmegen on the authority of the Rector Magnificus prof. dr. Th.L.M. Engelen,
according to the decision of the Council of Deans to be defended in public on Thursday, October 22, 2015
at 10.30 hours
by
Pragnya Maduskar
born on January 5, 1985 in Sarni, Madhya Pradesh, India
Supervisor: Prof. dr. B. van Ginneken
Co-supervisor: Dr. ir. C.I. Sánchez
Doctoral Thesis Committee: Prof. dr. D. van Soolingen Prof. dr. ir. M.A. Viergever Utrecht University
Prof. dr. F. Cobelens University of Amsterdam
Advanced School for Computing and Imaging
The research described in this thesis was carried out at the Diagnostic Image Anal-ysis Group, Radboud University Medical Center (Nijmegen, the Netherlands). This work was carried out in the Advanced School for Computing and Imaging (ASCI) graduate school (ASCI dissertation series number 340).
This research was funded by the European and Developing Countries Clinical Tri-als Partnership (EDCTP) grant (TB-NEAT; IP.2009.32040.009): the Evaluation of multiple novel and emerging technologies for TB diagnosis, in smear-negative and HIV-infected persons, in high burden countries (TB-NEAT project).
To my parents, Aniruddha,
All my family and friends
CONTENTS ix
TABLE OF CONTENTS
1 Introduction 1
1.1 Tuberculosis . . . 2
1.2 Chest radiography . . . 9
1.3 Computer aided detection (CAD) . . . 15
1.4 A review of automated tuberculosis detection in chest radiographs . . 24
1.5 CAD4TB software . . . 27
1.6 Thesis outline . . . 29
2 Tuberculosis detection with bone suppression images 31 2.1 Purpose . . . 33
2.2 Methods . . . 34
2.3 Results . . . 36
2.4 Conclusion and future work . . . 36
3 Cavity segmentation 43 3.1 Introduction . . . 46 3.2 Data . . . 48 3.3 Methods . . . 50 3.4 Experiments . . . 54 3.5 Results . . . 57 3.6 Discussion . . . 65 3.7 Conclusion . . . 68 4 Cavity detection 71 4.1 Introduction . . . 73 4.2 Data . . . 74 4.3 Methods . . . 75
4.4 Evaluation and Results . . . 80
4.5 Discussion . . . 84
4.6 Conclusion . . . 86
5 Pleural effusion detection 87 5.1 Introduction . . . 89
5.2 Data . . . 90
x CONTENTS
5.4 Experiments and Results . . . 101
5.5 Discussion . . . 106
5.6 Conclusions . . . 109
5.7 Acknowledgments . . . 110
6 CAD4TB validation: Zambia 115 6.1 Introduction . . . 117
6.2 Material and Methods . . . 117
6.3 Results . . . 123
6.4 Discussion . . . 126
6.5 Conclusion . . . 128
7 CAD4TB validation: The Gambia 129 7.1 Introduction . . . 131 7.2 Ethics statements . . . 131 7.3 Methods . . . 132 7.4 Results . . . 136 7.5 Discussion . . . 141 7.6 Conclusion . . . 144 8 General discussion 145 Summary 155 Samenvatting 161 Acknowledgements 165 Publications 177 Bibliography 183 Curriculum Vitae 203
Introduction
2 Introduction
Tuberculosis (TB) remains the second leading cause of death due to infectious dis-eases worldwide1. The World Health Organization (WHO) has a Millennium De-velopment Goal aimed towards reversing and restricting the spread of the disease by 2015. World TB Day is held every year on 24th March, to raise awareness on the ongoing epidemic. For World TB Day 2015, the United Nations, the Stop TB Partnership and the WHO are urging all governments and health organizations to mobilize political and social commitment towards eliminating the disease as a public health burden. The World TB day theme this year is “Reach the 3 Million: Reach, Treat, Cure Everyone” - aimed at the three million people who are not treated every year.
Adding to these endeavors, this thesis is a sincere work to accelerate the efforts towards reducing the disease burden. It describes automatic methods to detect various manifestations of TB and validates the software for automated analysis on TB populations from two countries. The work presented in this thesis is part of a larger project - Computer-Aided Detection for Tuberculosis (CAD4TB)∗.
1.1
Tuberculosis
1.1.1
History
TB has claimed many lives throughout human history. It had an epidemic stature in Europe and North America during the 18th and 19th centuries. The disease has been given many names in different evolutionary periods -phthisis andconsumption
from Hippocrates in the 18th century2,the white death3 and the great white plague4
during the 19th century, and other terrifying names such as the robber of youth5,
the Captain of all these men of Death6, the graveyard cough, and the King’s-Evil3. The understanding of the pathogenesis of tuberculosis began in the 19th century with the contributions of Theóphile Laennec, culminating in the demonstration of transmissibility of the infection by Jean-Antoine Villemin in 18656. The discovery of the tubercle bacillus (abbreviated as TB and known as tuberculosis) as the etiologic agent by Dr. Robert Koch in 1882 was a major contribution to medicine, which lead to better understanding and, eventually, the discovery of an effective treatment of the disease in the form of antibiotics.
1.1 Tuberculosis 3
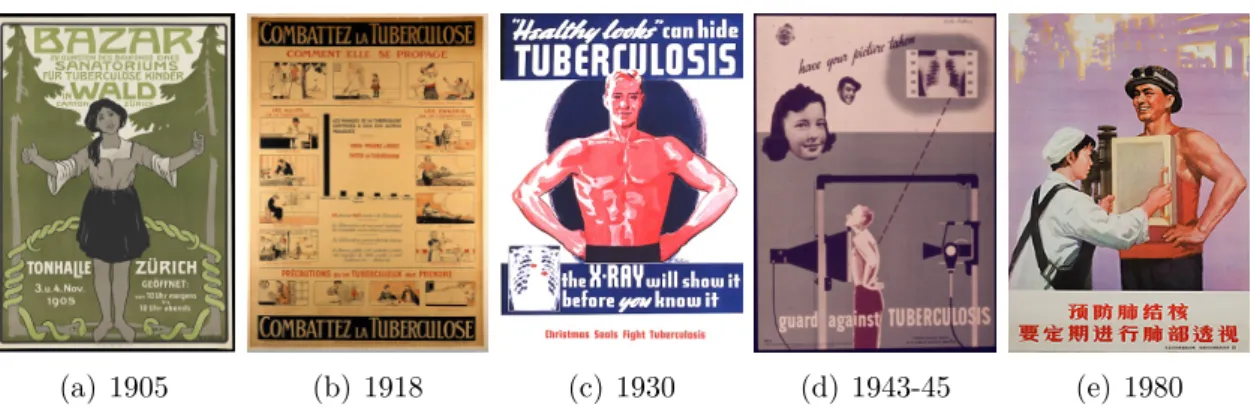
(a) 1905 (b) 1918 (c) 1930 (d) 1943-45 (e) 1980
Figure 1.1: Tuberculosis awareness posters in 20th century from various countries.
1.1.2
Epidemiology
Tuberculosis is the second most common cause of death from infectious diseases after HIV1, with which it is closely related. About one third of the world’s population is estimated to be latently infected with Mycobacterium tuberculosis (M. tuberculosis) bacteria, but only people with weakened immune systems are at a high risk of developing active tuberculosis. In particular, a person with HIV infection is over 15 times more likely to develop active tuberculosis. According to the WHO 2014 TB report1, 13% (360,000) of new tuberculosis cases in 2013 were HIV-positive. Although tuberculosis prevalence rate (decreased by 41% since 1990) and mortality rate (decreased by 45% since 1990) have fallen down over the last decades, still 9.0 million people developed TB and 1.5 million died from the disease in 2013. Most of the estimated number of cases occurred in Asia (56%) and the African Region (29%); smaller proportions of cases occurred in the Eastern Mediterranean Region (8%), the European Region (4%) and the Region of the Americas (3%). Although 60% of TB cases and deaths occur among men, disease burden among women and children is also high. In 2013, 510,000 women and 80,000 HIV-negative children died due to TB infection.
After the discovery of tubercle bacillus bacteria, preventing the spread of tuber-culosis became the prime motivation for many large-scale public health campaigns (see Fig. 1.1). The sanatoria movement began at the same time in approximately 1880, to cure TB and prevent its spread by isolating patients from normal life into quiet and natural environments. Until the development of the single antibiotic drug streptomycin in the 1940s, the focus was on tuberculosis diagnosis rather than cure, for example, use of the stethoscope and discovery of X-rays in the early 1900s. Mor-tality rates began to decline in the late 19th century throughout Europe and the
4 Introduction
(a)
(b) (c) (d)
Figure 1.2: Transmission and pathophysiology of TB. (a) Inhaling of tubercle bacilli through air which enter the air sacs (alveoli)a. (b) The bacilli multiply in
alveoli, where the infection begins. (c) Within 2-8 weeks the immune system pro-duces special cells called microphages that surround the tubercle bacilli and create a barrier shell. (d) In case of a dysfunctional immune system, the microphages can not shield the bacilli which begin to multiply rapidly and cause active TB diseaseb.
aAdapted from
http://clipart-finder.com/clipart/CancercausedbysmokingI621.html
bSource:
http://www.cdc.gov/tb/education/corecurr/pdf/chapter2.pdf
United States, and are the lowest till date. The decline is attributed to many fac-tors, i.e. sanitary measures, sanatoria, improved nutrition, public awareness, timely diagnosis and treatment. In 1948, the WHO was formed, to guide progress in pub-lic health, especially in developing countries where infectious diseases like TB were becoming an epidemic. The WHO formulated a comprehensive approach to TB control, including diagnosis, treatment consistency and monitoring.
1.1.3
Transmission and Pathogenesis
TB is an airborne disease caused by the M. tuberculosis bacteria (tubercle bacilli). The bacteria are carried in small particles, called droplet nuclei (1-5 microns) which get expulsed by coughing, talking, sneezing or singing of a person with TB. These
1.1 Tuberculosis 5
tiny particles can remain suspended in the air for several hours depending on the environmental conditions. M. tuberculosis gets transmitted to a person when these infectious droplet nuclei are inhaled through air, which then traverse the mouth or nasal passages, upper respiratory tract, and bronchi to reach the alveoli of the lungs (Fig. 1.2 (a)). These tubercle bacilli are ingested by alveolar macrophages; the majority of these bacilli are destroyed or inhibited. When the macrophages die, a small number of the remaining bacilli may multiply intracellularly (Fig. 1.2 (b)). Before the development of cellular immunity, these bacilli may spread via lymphatic channels or through the bloodstream to more distant tissues and organs (regional lymph nodes, lung pleura, kidneys, brain, bone, etc.) causing extra-pulmonary tu-berculosis7.
For the majority of individuals with a normal immune system, collections of activated T cells and macrophages form granulomas that limit proliferation of the bacilli (Fig. 1.2 (c)). Lesions in persons with an adequate immune function generally undergo fibrosis and calcification, so that the dormant bacilli are contained in the healed lesions. This condition of presence of inactive bacilli is known as latent TB. In case of immunocompromised persons, granuloma formation is initiated but is unsuccessful, leading to liquefaction of the necrotic tissue, and breakage of the fibrous wall (Fig. 1.2 (d)). The semiliquid necrotic material can then drain into a nearby blood vessel or bronchus, leaving behind an air-filled cavity (a classic sign of active TB). Discharge into a vessel can lead to dissemination of the bacilli to multiple organs causing miliary TB. Approximately 10% of individuals who acquire a latent TB infection and are not given preventive therapy will develop active tuberculosis8. The risk is higher in the first 2 years after infection, when half of the cases will occur. HIV-infected persons with low CD4 cell counts are more prone to develop active TB infection.
1.1.4
Diagnosis
Usually patients with aM. tuberculosis infection in the lungs (pulmonary TB) start developing symptoms indicative of TB infection. Common symptoms include cough of more than 2 weeks, which may be accompanied by other respiratory symptoms -shortness of breath, chest pains, haemoptysis and/or constitutional symptoms - loss of appetite, weight loss, fever, night sweats, and fatigue9. Since the clinical features of TB are rather non-specific, a confirmatory examination is always required for a definitive diagnosis.
6 Introduction
Many diagnostic tests are available and under constant development to improve TB diagnosis. A recent overview can be found in Pai and Schito10 and is summa-rized in Fig. 1.3. The diagnostic tests can be broadly divided into six categories: radiographic, bacteriological, immunological, histopathological and molecular.
Chest radiography (Fig. 1.4(a)) is one of the most common diagnostic tools to look for radiological manifestations of TB and, as the focus of this thesis, will be discussed in detail in the next section. Computed tomography (CT) (Fig. 1.4(b)) imaging has a higher accuracy than chest radiography but its limited availability and high costs makes its implementation harder in low-resource countries. Over 90% of the worldwide burden of tuberculosis is in low-resource countries11, hence affordable and logistically feasible solutions are needed in such scenarios.
Bacteriological tests include acid-fast bacilli (AFB) sputum smear (Fig. 1.4(c),(d)) and culture examination (Fig. 1.4(e)). Both analyze the coughed up sputum for the presence of M. tuberculosis. M. tuberculosis are also called AFB because of their rod-like structure (bacilli) seen under the microscope following a staining procedure where the bacteria retain the color of the stain after an acid wash (acid-fast). Flu-orescence microscopy has higher sensitivity at similar specificity than conventional Ziehl-Neelsen light microscopy and now cheaper LED based fluorescent microscope are available, which is the preferred method for AFB sputum smear12. Sputum smear is cost-effective and provides immediate diagnosis with high specificity, but has only moderate sensitivity and even lower sensitivity in HIV-positive popula-tion13.
Sputum culture on Löwenstein-Jensen (LJ) solid media is the gold standard for active TB diagnosis but has a very long processing time of around 3-8 weeks. Liquid media such as the Mycobacteria Growth Indicator Tube (MGIT) is a quicker (on av-erage around 2 weeks14) and reliable alternative with higher yield than conventional LJ media15. Costs of both culture methods are comparable and as high as US$ 28-3215. Another drawback is that they require high quality laboratory environments that are typically scarce in countries with a high burden of TB.
Latent TB infection is diagnosed using immunological tests, most commonly using a tuberculin skin test (Mantoux test) (Fig. 1.4(f)) or an interferon-gamma release assay examination. Histopathological examination of tissue specimens (e.g. needle biopsy of lymph nodes or pleura) is used for confirming the diagnosis of many forms of extra-pulmonary TB.
A new molecular test Xpert®MTB/RIF (Cepheid, Sunnyvale, CA) is being rolled out in various countries1,16–18 after endorsement by the WHO in 2010. Xpert®
1.1 Tuberculosis 7
Figure 1.3: Current tuberculosis diagnostics pipeline listing the development phases and the types of technologies in development or evaluation. Complexity categorization was based on criteria that are used for similar diagnostics by the US Food and Drug Administration. Early development refers to prototype devel-opment after the proof-of-concept stage. Late-stage develdevel-opment refers to turning the prototype into a design-locked, manufacturable product. The figure is taken from Pai and Schito10, reproduced with permission from the Journal of Infectious Diseases. Note that CAD4TB is listed in the “Late or Completed Development” category.
8 Introduction
MTB/RIF detects DNA sequences specific to M. tuberculosis in a sputum sample in less than 2 hours (Fig. 1.4(g)). Additionally, it can detect the genetic mutations associated with resistance to the drug rifampicin19. The test has major benefits in detecting multidrug-resistant TB (MDR-TB)20,21, HIV-associated TB22–24, or child TB25. With support of large donor organizations, FIND (Foundation for Innovative New Diagnostics) has negotiated a reduced price with Cepheid, amounting to US$ 10 per examination, which is still expensive for large scale implementation in resource-constrained countries.
1.1.5
Treatment
After TB has been diagnosed and the type of infection has been detected (active vs latent), medication is usually prescribed for a period of 6-12 months. In case of latent infection, preventive medication includes a daily dosage of isoniazid for 6 to 9 months to kill the latent bacteria. Active TB infection with no drug re-sistance is treated using a combination of several drugs for 6 to 12 months. The most common medication for active TB is a cocktail of isoniazid with two to three other drugs including rifampicin, pyrazinamide and ethambutol. TB is a curable disease, but it is crucial to complete the treatment regimen, incomplete treatment can lead to MDR-TB or TB relapse. Active MDR-TB treatment is usually longer and second-line TB drugs are used, based on drug-susceptibility testing26. The DOTS-plus (Directly Observed Treatment, Short-course) strategy by the WHO9 is specifically implemented for treatment and monitoring of MDR-TB and has a suc-cess rate exceeding 80%27, preventing the emergence of further MDR strains of TB. Extensively drug-resistant TB (XDR-TB), an extreme form of MDR-TB, is treated using third-line of TB drugs28.
1.1.6
Research
Active TB research is being conducted to reduce disease burden, and is focused on three main areas: vaccination, new/improved drugs, and better diagnostic tools. The Bacillus Calmette-Guérin (BCG) vaccine, invented in 1921, is given to children to protect from severe forms of TB infection, but it fails to immune them from the most common form - pulmonary TB. The vaccination has therefore not helped to reduce the number of TB cases. There have been a lot of efforts on the development of TB vaccinations, but unfortunately none of the vaccine candidates got promising results in a clinical trial yet, and BCG still remains the only available vaccine for the next few years.
1.2 Chest radiography 9
New drugs are being developed to reduce the treatment regime of non-resistant TB and to fight against MDR-TB and XDR-TB. Many drugs are in the final phase of clinical trials29 or have already received partial regulatory approval for treatment of MDR-TB28,30. In the future these drugs will be able to replace the long existing treatment regime, but they either have similar mechanisms of action (bedaquiline and clofazimine28), or can cause drug resistance (linezolid30). Therefore, it is ex-tremely important to monitor for drug resistance during the treatment, particularly in case of MDR-TB and XDR-TB to avoid the chance of developing resistance to the remaining drugs.
The disease burden can be truly reduced when an accurate and early diagnosis is combined with an optimal treatment regimen. Advancement in TB diagnosis plays a major role in achieving this; many new TB diagnostic tools are under different stages of development10,31. In recent years, massive roll out of Xpert® MTB/RIF has changed the diagnostic algorithm of TB detection and patient management32. Although Xpert® MTB/RIF has been successfully implemented in many high TB burden countries, majority of these were donor funded, and largely dependent on testing in centralized laboratories33. A range of new molecular technologies are under development which can replace smear microscopy34 in the future and will be competing with Xpert technology. In the longer run, biomarker-based techniques are needed to identify latent TB infection at an early stage and eliminate the risk of progression to active TB. However, the current research on TB diagnosis focuses on reducing the costs and a wide-scale implementation of Xpert® MTB/RIF as a point-of-care test. Various algorithms are being investigated where an inexpensive point-of-care test can be used in conjunction with Xpert® MTB/RIF, for example sputum smear or chest radiography32,35–37. Our research focuses on making chest radiography an easy-to-use, cost effective point-of-care tool for active screening or TB prevalence surveys.
1.2
Chest radiography
In 1974, the WHO recommended to abandon chest radiography for mass TB screen-ing and advocated to perform sputum smear microscopy on symptomatic patients. Conventional analog X-ray imaging suffered from high running costs (films, chemi-cals) and low image contrast if the required parameters, i.e. tube kilovoltage, expo-sure, film processing etc. are not properly adjusted38. The advent of digital chest radiography has been a game changer bringing improved image quality, immedi-ate digital image availability and substantially lower operational costs, as films and
10 Introduction
(a) Chest Radiography (b) Coronal CT slice
(c) Ziehl-Neelsen (d) Fluorescence (e) Culture
(f) Mantoux skin test (g) Xpert
Figure 1.4: Most commonly used tuberculosis diagnostic tools.
chemicals are no longer required39. In 1992, the WHO’s Essential Technologies group made recommendations that stressed the role of chest radiographs (CXRs) at the primary referral level. The WHO again endorsed usage of preferably digi-tal CXRs to expedite the diagnosis of smear-negative pulmonary TB in high HIV prevalence population in resource-limited settings40 and incorporated CXRs in the algorithm for TB prevalence surveys41. Nowadays, CXRs are a common part of the diagnostic pathway for TB, either in clinics or in a screening algorithm, where sputum culture or Xpert® MTB/RIF is performed as a confirmatory diagnosis. The following subsections focus on the basics of chest radiography and provide details about the various TB manifestations on CXRs.
1.2.1
Background
X-rays were accidentally discovered in 1895 by Wilhelm Conrad Röntgen. While working with a cathode-ray tube to see if cathode rays could pass through glass, he
1.2 Chest radiography 11
noticed a glow coming from a nearby chemically coated screen. One of Röntgen’s first experiments was a film of the hand of his wife, Bertha. Röntgen’s discovery was a breakthrough for the field of medicine and X-rays soon became an important diagnostic tool, enabling doctors to study the inside of the human body without surgery.
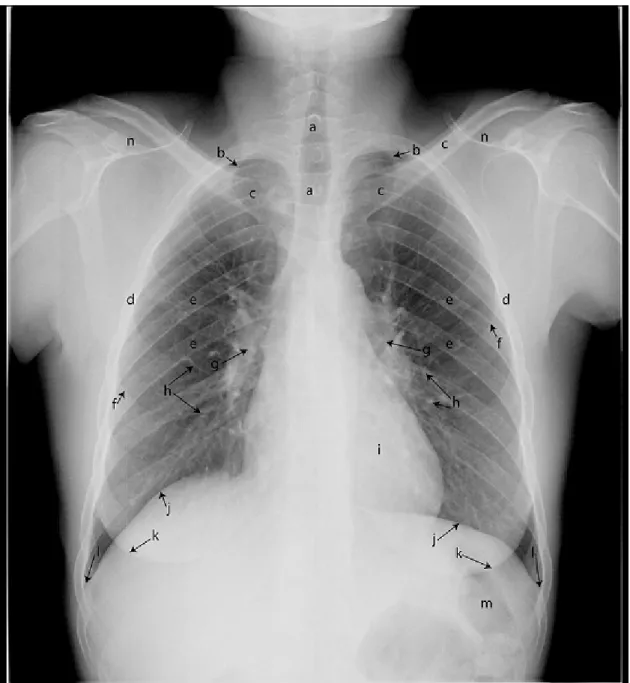
Chest radiography accounts for ≈30-40% of all X-ray examinations performed at any healthcare facility42. It provides a two-dimensional projection image of the chest to diagnose abnormalities affecting lungs or other structures in the field of view (heart, hilum, trachea)(see Fig. 1.5). Different views of the chest can be obtained by changing the relative orientation of the body with respect to the direction of the X-ray beam. The most commonly used views are frontal (postero-anterior or posterior) and side (lateral) views. Postero-anterior (PA) and anterior-posterior (AP) refers to the patient position when X-ray beam enters from the posterior (back) or anterior (front) of the patient, respectively. Lateral views of the chest are taken from the left side of the chest with both arms raised. Lateral images are often omitted in TB diagnosis, therefore, in this thesis we will only consider PA CXRs. Chest radiography employs ionizing radiation in the form of X-rays, with the mean radiation dose to an adult being around 0.02 mSv for a frontal view (PA/AP) and 0.08 mSv for a side view (lateral)43. The risk associated with these amounts of radiation is extremely low. A CXR image represents a map of X-ray attenuation by different anatomical structures depending on density and thickness of tissues (Fig. 1.5). For example, bones attenuate X-rays more than lung tissue, resulting in white (dense) as compared to dark appearance on a CXR.
The conventional chest radiography switched to digital technology in the early 1980s when the first Computed Radiography (CR) technology based detector was introduced. CR systems use an analog cassette-based system where the image in-formation is stored in a phosphor plate which is later digitized using a special laser scanner (CR reader). Direct radiography (DR) with a flat panel detector system is a true form of digital radiography in which a semiconductor based sensor directly converts X-ray energy into electrical signals, hence eliminating the digitization step by the image plate reader. DR systems offer better image quality, and higher spatial resolution and dose efficiency as compared to CR systems. Pixel sampling interval ranges between 0.5 and 200 µm for CR systems, and between 140 and 200 µm for DR systems44. Digital CXRs of varied pixel resolutions have been used in this thesis which were collected from various countries in Africa - Zambia, South Africa and The Gambia. The CXRs in Zambia and South Africa were scanned using a slot
12 Introduction
scanner (a thin detector strip which is cheaper than a full field detector, that moves during the acquisition), and in The Gambia a mobile DR system was used.
1.2.2
Tuberculosis detection
Tuberculosis manifestations on CXRs include various abnormalities which are non specific and can also be indicative of other diseases, for example, lung cancer, inter-stitial lung disease, chronic obstructive lung disease (COPD) or pneumonia. Hence, CXR is usually used as a triage and not as a diagnostic test to select subjects to per-form confirmatory tests for definitive TB diagnosis. If culture or Xpert® MTB/RIF is unavailable, CXR is used in conjunction with clinical symptoms and patient his-tory to make a diagnosis45,46 and start TB treatment. The most common form is pulmonary TB (PTB) which affects the lung parenchyma causing textural changes. Typical PTB manifestations include upper lobe infiltrates47, cavities (Fig. 1.6(a)), consolidations (Fig. 1.6(b)) and opacifications (Fig. 1.6(c,d)). Cavitation in the up-per lobes is the hallmark sign of PTB47, which appears as a dark air filled hole with a band of dense tissue around it. However, appearances of TB are often atyp-ical in patients with advanced immunodeficiency, such as lower lobe opacifications, miliary patterns (Fig. 1.6(e)), pleural effusions (Fig. 1.6(f)) and lymphadenopathy (Fig. 1.6(g))48. Signs of TB on CXRs are also determined by various demographic factors: age, ethnicity, immunity level and severity of the disease49. Therefore, it is a difficult task for the human experts (radiologists or clinical officers) to perform TB diagnosis on the basis of a CXR alone. CXR reading by human readers has sub-stantial inter- and intra-observer variability, and the literature also shows a range of sensitivities and specificities achieved in different settings by readers with varied years of experience (see Fig. 1.7).
Many scoring systems have been developed for consistent reading of CXRs and to reduce inter-observer variability51. The most widely used scoring system, Chest Reading and Recording System (CRRS)52, is designed to characterize all the visi-ble findings in a structured way. The form comprises of sections describing various abnormalities, primarily parenchymal, pleural, central or others. The identified find-ings are then summarized based on a subjective assessment of whether the recorded abnormalities are consistent with active TB. The scoring system has been validated on HIV positive53, smear negative54 and prevalence52 populations, with a high de-gree of inter-reader ade-greement. Readers can become CRRS certified after attending the CRRS course followed by an examination. In this thesis, the term “CRRS certi-fied reader” has been used throughout, as most of the human readers in our studies
1.2 Chest radiography 13
Figure 1.5: Important anatomical structures labeled in a normal PA chest radio-graph. a) The trachea, b) The anterior first rib, c) The clavicles, d) The rib cage, e) The posterior ribs, f) The anterior rib shadow, g) The left and right hilum, h) The vessels running parallel or perpendicular to the image, i) The heart, j) The left and right diaphragm, k) The left and right breast shadow, l) The left and right costophrenic recess/angle, m) Stomach bubble, n) The scapula
14 Introduction
(a) Cavities (b) Consolidation (c) Large opacity
(d) Small opacities (e) Miliary TB (f) Pleural effusion (g) Lymphadenopathy
Figure 1.6: Common TB manifestations in chest radiographs.
Figure 1.7: Sensitivity and specificity of human readers as reported in the liter-ature. The figure is adapted from Maduskar et al.50
1.3 Computer aided detection (CAD) 15
are CRRS certified.
The objective of CXR reading is always guided by the intended use of chest ra-diography. There are mainly three scenarios in TB detection: active case finding, prevalence surveys or a clinical setting. Active case finding programs identify and target high risk groups which are more prone to TB infection rather than waiting in a clinic for people to show up55. TB prevalence survey is an initiative taken by the WHO to estimate TB burden in countries by mass screening representative groups1,41. A clinical setting refers to passive case finding where subjects with TB symptoms present themselves for diagnosis and treatment. Active case finding or prevalence surveys involve screening TB suspects using chest radiography and symp-tom screening, and selecting subjects which need further expensive examinations. Hence, a high detection rate at the cost of many false alarms is preferred. However, in clinics, specially in low resource countries, TB diagnosis is made on the basis of chest radiography due to unavailability of other tests, which demands high accu-racy of the CXR reading. In this thesis, validation studies have been performed on datasets from a prevalence population (The Gambia National TB prevalence survey) and from TB clinics in Zambia and South Africa (TB suspects population with high TB incidence)22,39.
1.3
Computer aided detection (CAD)
Computer aided detection (CADe) or computer aided diagnosis (CADx) refers to the field of research and development of software technology to assist doctors in the interpretation of medical images. Research on automated analysis of medical images began in 1960s, but the early attempts were unsuccessful. The failure was blamed at that time on a wrong vision of replacing radiologists and also lack of pow-erful computers56. Later in the 1980s, a new direction was taken where computers were considered as an aid to radiologists and the research line of computer aided diagnosis (CAD) emerged. First time in 1990, Chan et al. showed improvement in radiologist’s performance with CAD for the task of micro-calcifications detection in mammograms57. In the recent years, CAD has been successfully applied in many other fields of medicine, markedly, mass detection in breast cancer screening58–60, nodule detection in lung cancer screening61–64, polyp detection in colorectal can-cer65,66, automatic detection of diabetic retinopathy67, histopathology image ana-lysis68, and melanoma detection on digitized epiluminescence microscopic images69. Although CAD systems were thought to be only used as an aid, these days CAD systems are being used independently as an automatic tool for a number of tasks, to
16 Introduction
name a few, TB detection on CXRs35,70, bone age assessment on CXRs71, and breast density estimation on mammograms72,73. The work in this thesis is aimed towards development and validation of the CAD4TB software as a standalone application. The work described here is intended to assist in TB reduction and to detect more TB cases with automated CXR reading, in the resource-limited countries with high TB burden and limited availability of human experts (radiologists/clinical officers).
1.3.1
Design
Design of CAD systems is an amalgamation of three fields - medicine, image pro-cessing, and machine learning. The domain knowledge from the field of medicine is incorporated in the CAD systems using the latter two fields of study. The design is based on the pattern recognition paradigm in which computers are taught to learn the features radiologists look for in an image. This is known as supervised learning methodology where the program learns to distinguish between two or more classes, for example, cancerous or healthy image, by seeing enough examples of the two classes.
The pipeline of a CAD system can be divided in four main components: Prepro-cessing, segmentation, feature extraction and classification.
Preprocessing: Preprocessing of images is usually performed to improve image qual-ity and to reduce intensqual-ity variation between images of the same or different patients. These differences might occur due to patient positioning, scanner models, scanning technologies or image acquisition protocols. These days, all X-ray scanners have proprietary preprocessing algorithms for noise reduction and produce good qual-ity X-ray images with a large dynamic range. As every vendor applies a unique preprocessing method, the dynamic range of CXRs varies a lot between scanner models. The human eye can deal with these intensity variations but CAD systems trained on images from one scanner can’t correctly analyze CXRs from other scan-ners. The most commonly used preprocessing techniques include local histogram equalization74,75, unsharp masking76, contrast enhancement77, zero mean and unit standard deviation scaling or frequency normalization78. In this thesis, we have used a localized multiscale frequency based normalization as described by Philipsen et al.79.
Preprocessing can also involve suppression of various anatomical structures or artifacts to clearly visualize the abnormalities. In chest radiography, these struc-tures include ribs, clavicles or any foreign object in the field of view (for example catheters, zipper, cell phone, jewelery etc.). Automatic suppression of ribs and
1.3 Computer aided detection (CAD) 17
clavicles on CXRs have been studied extensively in the literature80–83 and have shown significant improvement in radiologists’ performance with bone suppression images84–87. Hogeweg et al.88 developed a method for suppression of foreign objects in CXRs to prevent false detections by a CAD system. In Chapter 2, we develop a CAD system using bone suppression images and evaluate its performance in com-parison with CAD4TB trained using original CXR images.
Segmentation: Segmentation of relevant structures is essential for mainly two objec-tives. Firstly, to restrict the analysis in the region of interest (ROI) and secondly to segment the diseased region to know the extent of disease. Commonly used segmentation methods in the field of medical imaging are based on active contour models89,90, active shape models91, graph cuts92 or pixel classification93. We use a pixel classification based approach to segment the lung fields and confine analysis within the lungs for TB detection. The lung field segmentation is used throughout in the thesis. In Chapter 3, we propose a method to segment cavities, an important biomarker to measure disease severity and TB treatment response. In Chapter 5, the lateral rib cage is segmented and used as a landmark for the detection of pleural effusion.
Features: Identifying relevant features which can discriminate between two or more classes is a crucial step in designing a CAD system. In this thesis, new features are designed to classify pixels or regions in a CXR image as normal or abnormal. Features can be generic, such as the mean intensity value of a region to be char-acterized, or very specific to the field of domain. Local pixel level features include filtering operations like Gaussian, Gabor or Fast Fourier Transform, or edge detector operators - Canny, Sobel or the Laplacian94. Region or object features can be cate-gorized as texture, morphology or context based. Frequently used texture features are higher order moments, co-occurrence matrix, local histogram and local binary patterns (LBPs)94. Morphology or shape descriptors consist of a wide range of fea-tures, i.e. blobness, curvature, eccentricity, convex hull etc. Context features include the relative location of an object with respect to an anatomical structure. In our case, TB related abnormalities usually occur in upper lobes and hence the position of a region relative to the lung fields or distance to the hilum are informative context features. In Chapter 2 and 3, local, texture and context features have been utilized. Chapter 5 uses morphology features in addition to texture and context features.
The above mentioned features are also known as “hand crafted” features, as they are designed and picked specifically for a particular detection task. A novel field named “deep learning” focuses on layer-wise stacking of specific underlying model
18 Introduction
architectures, such as sparse auto-encoders, restricted Boltzmann machine (RBM) or neural networks to perform automatic feature learning95. Neural networks with many layers were re-branded as deep learning in 2006 gaining enormous popular-ity96,97, and introducing a new paradigm for feature learning. A subclass of the neural networks, the so-called convolutional neural networks (CNN), was already introduced in the 1980’s, but has attracted much attention in recent years with the rise of computing power. Literature reports that it outperforms other state of the art algorithms in many computer vision tasks98–102. CNN is nothing but a deep neural network with many layers and a large number of neurons in each layer, inspired to learn in a similar way as the human visual cortex with millions of connected neurons in layers V1, V2, V3, etc. These networks are similar to the standard feed-forward neural networks but have fewer parameters because of their convolution layers, and hence are comparatively easier to train103,104. Each convolution layer in a multi-layer deep CNN is constructed using a set of filters that are convolved with the previous input layer, producing feature maps as output, creating a complex set of features which are learned during the CNN training. In Chapter 4, we explore CNN based feature learning for automatic detection of cavities.
Classification: Classification refers to categorizing objects into different classes. For TB detection, we are interested in stratifying CXRs as “Normal”, “Abormal for Active TB”, or “Other Abnormalities”. As TB manifestation on CXR images is non-specific, we focus on labeling CXRs as “Normal” or “Abnormal”. Classification is the final step in a CAD pipeline. This step has two phases - training and test phase. In the training phase, a statistical model is trained using labeled examples of normal and abnormal classes. The labels are obtained by following an exten-sive process of annotating regions on CXR images by a trained reader. Features are extracted from these labeled regions and fed into an algorithm that implements the classification strategy (known as a classifier). Classifiers can solve a binary (2-class) or a multi-class classification problem, depending upon the labeled examples. In this thesis, 2-class classification has been used. “Classifier design” is a huge field of study in itself and many classification algorithms exist in the literature105. We have used and compared different classification strategies in this thesis, namely k-Nearest Neighbor (kNN)105,106, Linear Discriminant Analysis (LDA)105, Gentle-Boost (GB)107, Random Forest (RF)108, and Support Vector Machine (SVM)109. In the test phase, the trained classifier is used to assign a probability of being abnormal to the pixels or regions of an unseen CXR image. These pixel/region level scores can be used individually to identify abnormal regions in an image, or can be combined
1.3 Computer aided detection (CAD) 19
using rules such as max, min or 95% percentile rule to assign an image a probability of being abnormal.
CNN can provide an excellent alternative to the traditional supervised classifi-cation approaches. We have trained a CNN with cavity and non-cavity (normal) patches in Chapter 4 to distinguish between the two, exhibiting the discriminating power of CNNs without any feature engineering.
1.3.2
Evaluation procedures
After developing a CAD system, the most important question which comes to mind is: “How good is my CAD system as compared to a human expert”? The perfor-mance evaluation plays an important role in deciding the intended use of the CAD system and if it is ready to be deployed in clinical practice. To address all these questions, standard evaluation criteria exist in the literature to measure the accu-racy of CAD systems. For better understanding of the rest of the thesis, in the following subsections we elaborate on the evaluation criteria used in this work.
Reference standards
Two types of reference standards are considered in TB detection with chest radio-graphs: Radiological and Bacteriological. Radiological reference standard is usually set by a reader with many years of experience in reading CXRs, i.e. a radiologist or a pulmonologist. An experienced reader can distinguish between different TB manifestations and can categorize a CXR image into “Normal”, “Abnormal - Active TB”, “Abnormal - Healed TB” or “Other abnormalities”. In Chapter 7, radiolo-gists assigned to CXRs one of the above four categories. On the other hand, for a CRRS reader or a clinical officer, differentiating between active and healed TB is comparatively a difficult task as compared to labeling an image as “Normal” or “Ab-normal”. Hence, field readers in Chapter 7 read the CXRs as “Normal”, “Abnormal” or “Other”.
Reference standard is also required to train the CAD systems. For training the automated algorithms, abnormal regions were annotated by CRRS readers and later checked by a radiologist. In Chapter 3, cavities were manually segmented by two radiologists, and in Chapter 5, amount of pleural effusion was quantified on a scale of 1-5 (1-normal, 5-severe) by an experienced radiologist. To compare the software performance with human readings, in Chapter 6, clinical officers were asked to score the CXRs in a similar way as a CAD system, on a scale of 0-100 (0-normal, 100-abnormal).
20 Introduction
Bacteriological reference standard is set using an examination which can detect the presence of M. Tuberculosis bacteria and can confirm active TB infection. Cur-rently, sputum culture and Xpert® MTB/RIF, are used as confirmatory tests for active TB diagnosis. We have performed two software validation studies in Zambia and The Gambia, where culture was used as the bacteriological reference standard. The current reference standard is bacteriological examination, hence it is vital to compare the performance of the CAD software against the bacteriological reference before deploying it in a clinic. However, it also suffers from key problems, such as poor quality sputum, contamination risks, or failure to detect paucibacillary TB.
Overlap and distance measures
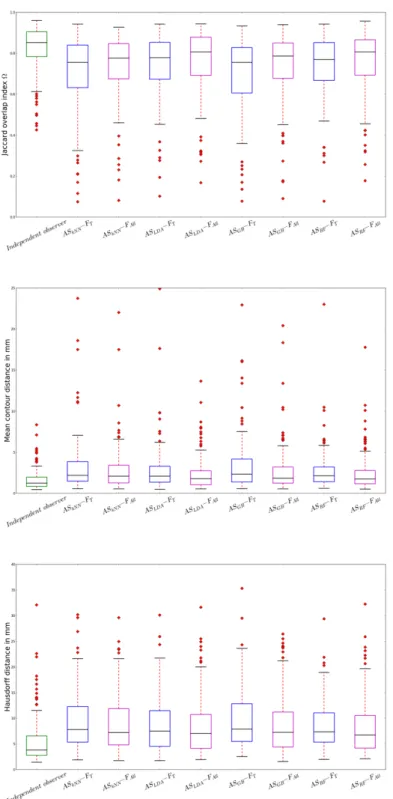
Correctness of automatically segmented structures is measured using overlap mea-sures. A human expert segments an organ or ROI, which is then compared with the automatically generated segmentation. We have used Jaccard overlap measure110in Chapter 3 and 4 for cavity segmentation and detection task, where a score of 1 rep-resents a perfect agreement and 0 no agreement. The measure does not differentiate between over and under-segmentation of the segmented object in comparison to the reference, hence over-segmentation and under-segmentation measures are addition-ally used in Chapter 3. They identify the false positive and false negative pixels with respect to the reference segmentation. The over and under-segmentation values are normalized with respect to the size of the reference object. More details regarding the overlap measures can be found in Chapter 3.
Distance measures are utilized for calculating the differences between automati-cally segmented and reference contours, and between software identified and manu-ally annotated reference landmark points. In Chapter 3, two distance measures111, namely Hausdorff and mean absolute contour distance, are computed between the automatic and reference cavity contours. In Chapter 5, L2 distance is measured between the manually indicated and the automatically detected landmark point for detection of pleural effusion.
Receiver Operating Characteristic (ROC) analysis
A classifier in a CAD system computes a continuous score between 0 and 1, which represents the likelihood or probability of belonging to a particular class. This value needs to be thresholded to calculate a binary output, i.e. “Normal”(0) or “Abnormal”(1). At every threshold, each example is labeled as 0 or 1 based on the assigned score by the classifier. A true positive (TP) finding is the one in which both true and assigned labels are 1, however if the true label is 1 and is assigned
1.3 Computer aided detection (CAD) 21
a 0 by the classifier, it is a false negative (FN) finding. Similarly, if a true normal example is assigned a 0 label, it refers to a true negative (TN), otherwise a false positive (FP). Diagnostic accuracy of a test is usually summarized by these four numbers - sensitivity (Se), specificity (Sp), positive predictive value (PPV) and negative predictive value (NPV), which can be derived from TP, FN, TN, FP, as shown in Table 1.1.
Se, Sp, PPV and NPV values are compared between two diagnostic tests to determine a superior test. A test is considered superior if it has high Se, Sp, PPV and NPV values which is very unlikely in real world scenario. A trade-off between Se and Sp is required, which can be explored using receiver operating characteristic (ROC) analysis. ROC curve is a graphical representation between Se and FP rate (1-Sp) (See Fig. 1.8). ROC curve is constructed by calculating Se and Sp at each possible threshold value on the score assigned by a classifier. ROC analysis has been extensively used for the evaluation of diagnostic tests, in epidemiology and radiology studies.
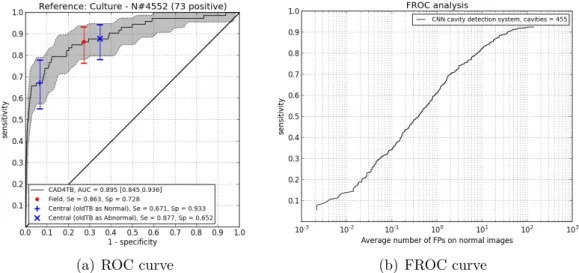
Fig. 1.8 (a) shows an example ROC curve for CAD4TB system from Chapter 7. The shaded gray area around the ROC curve is the 95% confidence interval, which is calculated using bootstrapping112. Bootstrapping is a statistical method in which samples are drawn a large number of times (n) from a given population and the required statistics (ROC curve in this case) are calculated each time. Then, 95% confidence interval of the ROC curve is computed from these n number of boot-strapped samples. In practice, human readers read images as 0 or 1 and not on a continuous scale; their Se and FP rate can be plotted on the curve to compare the performances. Area (AUC) under the ROC curve summarizes the overall per-formance of a ROC curve computed for a CAD system. AUC of two non-identical ROC curve can be the same, and in that case partial AUC should be computed in the area of interest to pick the best system. The optimal operating point can be chosen based on the required Se and Sp, or by picking the point on the curve with minimum distance to (0,1) which gives equal weight to Se and Se and imposes no cost or prevalence constraints.
Free Receiver Operating Characteristic (FROC) analysis
ROC analysis is not adequate when multiple abnormalities are required to be located on an image (e.g., detecting multiple nodules). Free Receiver Operating Character-istic (FROC) approach113 is a commonly used method when we are interested in analyzing the number of true findings detected per subject. The FROC curve is a
22 Introduction
(a) ROC curve (b) FROC curve
Figure 1.8: Example ROC and FROC curve. ROC and FROC curves have been taken from Chapter 7, and Chapter 4, respectively.
Test outcome Reference Positive Negative Positive TP FP P P V = T P T P+F P Negative FN TN N P V = T N F N+T N Se= T P T P+F N Sp= T N F P+T N
Table 1.1: The four outcomes of a diagnotics test formulated in a 2×2 contingency
table. TP: true positive, FP: false positive, FN: false negative, TN: true negative, PPV: positive predictive value, NPV: negative predictive value, Se: sensitivity, Sp: specificity.
1.3 Computer aided detection (CAD) 23
graphical plot between Se and number of FP findings per subject, where Se refers to the correctly detected abnormal regions by the CAD system. The FROC curve can be computed the same way as ROC curve, but the reference standard (positive class) is marked on a region level (normal/abnormal region), rather than providing an image label as 0 or 1. At each possible threshold value on the score per region, sensitivity and average number of FPs per image can be estimated and plotted as an FROC curve (see Fig. 1.8 (b)). In case of FROC curves, an optimal operating point is chosen based on the number of acceptable FPs per subject at a reasonable Se. The area under the FROC curve is an inappropriate performance measure, as more FPs per image also results in a higher area under the FROC curve. Alternatively partial area under the FROC curve, or a mean true-positive fraction (MTPF) in a certain FPs per image interval are used in literature. FROC analysis is used in many CAD applications, e.g., nodule detection in lung CT scans, polyp detection in colon CT scans, mass detection in mammograms, etc. The example FROC curve in Fig. 1.8 (b) is taken from Chapter 4 where FROC analysis has been used for cavity detection in CXRs.
Statistical analysis
A CAD system or any diagnostic test, before it can be used, needs to be evaluated for significance, i.e. if it is significantly better than the available CAD systems or other diagnostic tests in the market. Significance testing on AUC or pAUC for ROC and FROC is commonly performed using statistical tests such as bootstrap-ping114,115. Significant differences are determined with patient-based bootstrapping using n bootstrap samples112. Cases are resampled with replacement n times, such that every bootstrap sample has the same number of cases as the original data set. For each bootstrap sample, two ROC or FROC curves corresponding to the two sys-tems being compared are constructed, and the difference in AUC (∆AUC) or pAUC (∆pAUC) is calculated. After resamplingntimes,nvalues of ∆AUC or ∆pAUC are obtained. p-values are defined as the fraction of ∆AUC or ∆pAUC values that are negative or zero. p-value <0.05 is considered as a significant difference between the two curves under comparison. We have used this method to compare ROC curves in Chapters 5- 7. McNemar’s test116 is often used to compare sensitivities and specificities of two diagnostic tests using a 2×2 contingency table (Table 1.1). The statistical test follows a chi-square distribution and tests for equivalence between the two tests rather than inferiority or superiority. Chapter 7 utilizes McNemar’s test to show the equivalence between sensitivities and specificities of the CAD system
24 Introduction
Kappaκ Agreement
<0 Less than chance agreement
0.01-0.20 Slight agreement
0.21-0.40 Fair agreement
0.41-0.60 Moderate agreement
0.61-0.80 Substantial agreement
0.81-0.99 Almost perfect agreement
Table 1.2: Interpretation of kappa κ, adapted from Viera and Garrett117
. and human experts.
We use various statistical tests to pairwise compare measurement values. Inter-reader agreement in Chapter 6 between human Inter-readers and the CAD system is calculated using Cohen’s kappa (κ)117. The κcalculation is based on the difference between actual agreement (“observed”) compared to the expected agreement present by chance alone (“expected”) (see Eq. 1.1). κ lies on a scale of -1 to 1, where 1 is a perfect agreement, 0 is what would be expected by chance, and a negative value shows agreement less than chance, i.e. potential disagreement between the readers. The interpretation of κ has already been described extensively in literature117(see Table 1.2).
kappa, κ= (po−pe) (1−pe)
(1.1)
We employ Wilcoxon signed rank test118, a non-parametric test which compares differences in median between two distributions when normal distribution cannot be assumed, to measure significant differences between overlap values of different seg-mentation methods (Chapter 3). Paired t-test calculates difference between paired measurements and assumes these are normally distributed, and is used to evaluate significant differences for L2 distances computed between reference landmark point and automatically detected landmark point in pleural effusion detection algorithm in Chapter 5.
1.4
A review of automated tuberculosis detection
in chest radiographs
Automated analysis of CXRs is one of the first applications of image analysis in radiology119. Lodwick et al. published the first study on the analysis of pulmonary nodules in chest radiographs120. Since then, research on automated analysis of
1.4 A review of automated tuberculosis detection in chest radiographs 25
CXRs has advanced, and continues to grow further. Past research focused mainly on detection of nodules in CXRs121–123, and limited research was done in other areas like interstitial lung disease, subtraction imaging and pneumothorax124. As the focus of this thesis is TB detection, we will review the existing automated analysis methods relevant for TB detection.
Existing methods for the task of automatic detection of TB are reviewed ex-tensively in Jaeger et al.125. Most methods follow the standard CAD pipeline: preprocessing and segmentation followed by feature extraction and classification. Here, we briefly review the available methods in the literature for which the per-formance numbers were reported. We first review the methods published by our group, followed by the work done by others. van Ginneken was the first one to analyze CXRs automatically for tuberculosis detection in 2001122. He followed an approach where the lung fields were divided into 41 regions, moments of Gaussian were calculated as region features, and k-nearest neighbor classifier was used to estimate the probability of being abnormal per region. The region scores were com-bined to obtain an image level score, using a classification rule which multiplies the probabilities of the regions being normal. The method was tested on a database of 290 normals and 326 abnormals from a TB screening program for people seeking asylum in The Netherlands, and an AUC of 82% was achieved. Arzhaeva et al. applied a completely different approach of multi-valued dissimilarity-based classifi-cation by computing distances to a set of prototype objects as feature vectors, locally on regions inside the lungs and globally on the lung fields126. Combining local and global classification increased the AUC from 81% obtained with global features to 83%, on a set of 217 CXRs (128-normal, 89-abnormal). Hogeweg et al. reported an AUC of 86% on 149 CXRs (69-normal, 80-abnormal) from a TB clinic in Africa, by combining clavicle detection, shape and texture abnormality detection systems127. Clavicle detection system was used to suppress false responses on clavicles, com-bining various complimentary detection systems is a common approach to improve detection rate and reduce FPs. The most recent work by Hogeweg et al. shows the performance of a combined approach with texture, shape and focal abnormality detection systems128. The results have been reported using 10-fold cross-validation classification on two datasets of 200 CXRs each, collected from the Find and Treat screening program in London, United Kingdom and TB suspect screening popula-tion from Cape Town, Africa. The dataset from London achieved an AUC of 84.7% and 86.8% (87-bacteriological proven TB cases); the dataset from Cape Town got an AUC of 89.9% and 74.1% (66-bacteriological proven TB) against radiological and
26 Introduction
bacteriological reference standard, respectively.
In another approach by Noor et al.129, texture features computed from Daubechies wavelet transform followed by principal component analysis for dimensionality re-duction were used to discriminate between normal and abnormal ROIs in 40 test CXRs (20-normal, 20-bacteriological proven TB). An accuracy of 94% was reported on this small dataset. A semi-automatic method was proposed by Tan et al.130, in which lungs were segmented interactively using a snake model, first-order statistical texture features were extracted on the intensity values, and a decision tree classi-fier in 3-fold classification was trained using 95 CXRs (50-normal, 45-bacteriological proven TB), achieving an AUC of 92.8%. Rijal et al. employed phase congruency features and Euclidean distance measure as classification to differentiate between PTB, healthy tissue and bony structures in regions of 32×32 pixels, and reported an accuracy of 100%, 90% and 50%, respectively131. The method was evaluated on a small dataset of 10 PTB CXRs and 10 normal CXRs. Jeager et al. extracted a set of features, namely LBP, intensity and Hessian shape features from the automati-cally segmented lung fields and trained a linear SVM to distinguish between normal and abnormal X-rays. An AUC of 83.12% was obtained on a dataset from a TB control program in Montgomery County (MC) Maryland, United States, containing 138 CXRs (80-normal, 58-abnormal)132. A more recent work from the same author group used a very large set of features (histograms, shape, curvature, LBP etc.) and applied leave-one-out classification approach, achieving an AUC of 87% and 90% on MC dataset (80-normal, 58-abnormal) and Shenzhen dataset from China (340-normal, 275-abnormal), respectively133.
The above mentioned CAD systems are mostly based on texture analysis and are not trained to detect all manifestations of TB. Many appearances of TB can not be detected by such systems, namely cavitation, pleural effusion, hilar lymphadenopa-thy, millary TB. A few algorithms in literature specifically focus on detection of a particular manifestation of TB. Shen et al.134 proposed a cavity detection system which analyzes only upper lung zones in CXRs. Initial probable cavity contours were defined by adaptive thresholding and mean shift segmentation followed by an active contour model. These cavity candidate contours were classified as a cavity or a non-cavity using a Bayesian classifier. A second classification step was performed to detect the missed cavities in the upper lobes near clavicles. The technique was tested on only 16 CXRs with cavitation and a threshold on Jaccard overlap measure was used to classify detected cavity regions as true or false positives. A sensitiv-ity of 82.35% at 0.237 FPs per image, and 0.05 per normal image was reported.
1.5 CAD4TB software 27
Another automatic cavity detection system was presented by Xu et al.135 based on a coarse-to-fine dual scale methodology, where coarse features, like Gaussian-based matching and LBP, were applied at a coarse scale, while complex features, like cir-cularity and Kullback-Leibler divergence measures, were applied on a finer scale for the cavity classification. This method was validated on 35 CXRs containing 50 cavities. The candidate detector identified 160 contours, out of which 43 were true cavity contours. 70% sensitivity at 60% specificity was attained on these 160 can-didate contours. Koeslag and de Jager136 proposed a template matching technique in Fourier domain using 16 templates to detect miliary TB. Simple threshold on the correlation value with the 16 templates was used to classify as “Miliary” or “Nor-mal”, resulting in an accuracy of 94% in the miliary TB set (31/33), and 68% in the healthy set (19/28). Avni et al.137 used “bag of visual words” features and SVM classifier to differentiate between various pathologies vs normal images (38) - left (21) and right (17) pleural effusion, enlarged heart (24), abnormal mediastinum/hi-lar region (19), any pathology (55); achieving AUC values of 82%, 81%, 88.2%, 79.2%, and 82%, respectively. Armato et al.138 developed a technique to calculate the amount of pleural effusion in each hemithorax by automatically measuring the angle between the hemidiaphragm and lateral chest wall, commonly known as the costophrenic angle138. An AUC of 75% was reported on 1,166 hemithoraces (≈200 abnormal).
Due to different datasets being used in the above studies, it is not possible to directly compare the performance of the above mentioned methods. Dataset from Cape Town as described in Hogeweg et al.128 ∗, and both the datasets in Jaeger et al.133 are publicly available along with the ground truth information†.
1.5
CAD4TB software
The CAD4TB software has been under development for many years. It started as a PhD project of van Ginneken in 1996 in collaboration with Delft Imaging Sys-tems, who invented the Odelca camera in the 1960s. The PhD thesis resulted in a prototype software for TB detection, but was not tested clinically, as in those days digital X-ray machines were not widely used for TB detection. The first CAD4TB beta prototype (CAD4TB v0.01) was delivered in January 2010, and field tested in TB clinics in Zambia and South Africa. The beta prototype was improved later and
∗Download fromhttp://crass.grand-challenge.org/
†Access to the datasets can be requested onhttp://archive.nlm.nih.gov/repos/chestImages. php. More information available in Jaeger et al.139.
28 Introduction
the first official CAD4TB prototype was released in 2011 (CAD4TB v1.08), which was trained on a much larger dataset. Interest in automated reading, and hence in CAD4TB software has increased over the years due to resurgence of chest radiogra-phy for active case finding and TB prevalence surveys, and usage of digital X-rays. Every year a new prototype version of the software is released, the latest one being in 2014 version v4.10, which has also received a CE label. The software is com-mercially available via Delft Imaging Systems and is currently operational in seven countries: Zambia, Tanzania, Pakistan, Bangladesh, Rwanda, Zimbabwe and Libya, with new installations planned in South Africa, Indonesia and The Philippines. The software has been tested with CXRs from over 15 countries.
The CAD4TB software runs a preprocessing algorithm which analyzes an X-ray image and labels the image as a “PA CXR” or “non-PA CXR”. If the image is a PA CXR, the rest of the components are executed, otherwise the software terminates itself. Firstly, the input image is normalized to minimize differences between images acquired from different scanners, as described by Philipsen et al.79. Template matching is done between the input image and 25 PA CXR template images (13 normal, 12 abnormals) acquired with different scanners. The template images at various scales are translated over the input image and normalized cross correlation is computed between the overlapping input sub-image and the template image. The final correlation score is determined by taking average of the 5 maximum correlation values, which is then thresholded to determine if an X-ray image is a valid PA CXR. This method has been validated on 153,818 X-rays (13,475 non-PA CXR) achieving an AUC value of 99.4%.
The CAD system consists of a number of individual detection systems for the detection of various abnormal and normal structures. Lung fields are segmented first93, which is used by the detection systems for further processing. The indi-vidual detection systems are trained with examples from thousands of CXRs. The algorithmic details of the detection systems, namely shape, symmetry, texture and blunt costophrenic angle detection, have been described in the literature127,128,140. Finally, the output of these subsystems are combined using a random forest classifier to compute a score between 0 and 100 indicating the likelihood of having active TB. The goal of the work done in this thesis is twofold. Firstly, new algorithms were developed to improve the performance of CAD4TB software. Secondly, validation studies were conducted to compare the readings of existing CAD4TB software with human experts’ findings.
1.6 Thesis outline 29
Chapter No.
Country Setting Scanner Training Set Test Set
2 SA, Zambia TB suspects Odelca-DR, DIS 865 900 3 SA, Zambia TB suspects Odelca-DR, DIS 50 100 4 SA, Zambia TB suspects Odelca-DR, DIS 1,238 1,238* 5 Zambia TB suspects Odelca DR, DIS 629 638 6 Zambia TB suspects Odelca DR, DIS 945 161 7 Gambia Prevalence survey Atomed mobile X-ray, DIS 841 4,552
Table 1.3: Overview of datasets used in various chapters of the thesis. SA: South Africa, DIS: Delft Imaging Systems. *Training done in 5-fold cross validation, where the dataset was divided into 5 parts, and in each fold 3 parts were used as the training set, one as validation set and one as the test set. Results of all the folds were pooled together, hence training and test sets are the same.
1.6
Thesis outline
After years of research on automated detection of TB in CXRs, the accuracy has im-proved and is approaching human expertise. Many issues still need to be addressed, and a few of them are covered in this thesis. Primarily, we focus on detection of specific manifestations which can be missed by CAD4TB software, namely cavities and pleural effusion. These abnormalities can go undetected by the texture analysis of the lung fields if they are the only abnormalities present in the lungs. Secondly, we perform two validation studies of CAD4TB, to compare the performance of the software with human experts. These validation studies provide a stepping stone towards the potential use of the software prospectively in the field.
Many algorithms have been developed to automatically detect and suppress bony structures (ribs/clavicles) in PA CXRs, but the effect of bone suppression images on a CAD system for TB has not been evaluated. In Chapter 2, we evaluate the benefit of using bone suppression images for training and testing a CAD system for TB. A commercially available software package developed by Riverian (ClearRead Bone Suppression 2.4, Riverain Medical, Miamisburg, Ohio) was used to generate bone suppression images of PA CXRs.
A few automated methods exist in the literature to detect and segment cavities in CXRs, but the performance is still not optimal to use these methods in a clinic. In Chapters 3 and 4, we propose novel methods to segment and detect cavities in CXRs. Cavity segmentation is a semi-automatic method which requires a seed point near the center of the cavity as input, to perform the segmentation. In Chap-ter 4, we use the cavity segmentation algorithm described in ChapChap-ter 3 to develop a candidate detector. The cavity detection method uses state of the art methodology
30 Introduction
of convolutional neural networks to classify the detected candidates as “cavity” or “non-cavity”. Chapter 5 proposes a novel scheme for automatic detection of pleu-ral effusion in CXRs. The approach shows significantly improved performance as compared to the methods available in the literature.
Software validation studies have been performed in two different settings. Chap-ter 6 reports the evaluation of CAD4TB on a dataset of TB suspects with high TB prevalence from a TB clinic in Lusaka, Zambia. Here, we compare the scores generated by the software with the CXR readings of four clinical officers working in Zambia. Chapter 7 validates the software in a completely different setting where the majority of participants were normal. CAD4TB was compared with field readings by research clinicians and central readings by experts on the data obtained from The Gambia National Tuberculosis Prevalence Survey.
Table 1.3 provides an overview of the datasets used in the thesis. The overview shows that we have used a substantially larger number of CXRs compared to the number of CXRs used in the literature, to evaluate the proposed algorithms in this thesis. Finally, Chapter 8 concludes the thesis and provides a general discussion regarding the results obtained in the thesis.
Tuberculosis detection with bone
suppres-sion images
2
Pragnya Maduskar, Laurens Hogeweg, Rick H. M. M. Philipsen, Steven Schalekamp and Bram van Ginneken
Original title: Improved texture analysis for automatic detection of tuberculosis
(TB) on chest radiographs with bone suppression images
Published in: Medical Imaging, volume 8670 of Proceedings of the SPIE, 2013,