Evaluation of electrohysterogram
measured from different gestational
weeks for recognizing preterm delivery: a
preliminary study using random Forest
Peng, J., Hao, D., Yang, L., Du, M., Song, X., Jiang, H., Zhang, Y.
& Zheng, D.
Published PDF deposited in Coventry University’s Repository
Original citation:
Peng, J, Hao, D, Yang, L, Du, M, Song, X, Jiang, H, Zhang, Y & Zheng, D 2020,
'Evaluation of electrohysterogram measured from different gestational weeks for
recognizing preterm delivery: a preliminary study using random Forest'
Biocybernetics and Biomedical Engineering, vol. 40, no. 1, pp. 352-362.
https://dx.doi.org/10.1016/j.bbe.2019.12.003
DOI 10.1016/j.bbe.2019.12.003
ISSN 0208-5216
Publisher: Elsevier
© 2019 The Author(s). Published by Elsevier B.V. on behalf of Nalecz Institute of
Biocybernetics and Biomedical Engineering ofthe Polish Academy of Sciences. This
is an open access article under the CC BY license
(http://creativecommons.org/licenses/by/4.0/).
Copyright © and Moral Rights are retained by the author(s) and/ or other
copyright owners. A copy can be downloaded for personal non-commercial
research or study, without prior permission or charge. This item cannot be
reproduced or quoted extensively from without first obtaining permission in
writing from the copyright holder(s). The content must not be changed in any way
or sold commercially in any format or medium without the formal permission of
the copyright holders.
Available
online
at
www.sciencedirect.com
ScienceDirect
journalhomepage:www.elsevier.com/locate/bbe
Original
Research
Article
Evaluation
of
electrohysterogram
measured
from
different
gestational
weeks
for
recognizing
preterm
delivery:
a
preliminary
study
using
random
Forest
Jin
Peng
a,
Dongmei
Hao
a,*
,
Lin
Yang
a,
Mengqing
Du
a,
Xiaoxiao
Song
a,
Hongqing
Jiang
b,1,
Yunhan
Zhang
a,
Dingchang
Zheng
c,*
a
CollegeofLifeScienceandBioengineering,BeijingUniversityofTechnology,IntelligentPhysiologicalMeasurement
andClinicalTranslation,BeijingInternationalPlatformforScientificandTechnologicalCooperation,Beijing,China
bBeijingHaidianMaternalandChildrenHealthHospital,Beijing,China
cCentreforIntelligentHealthcare,FacultyofHealthandLifeScience,CoventryUniversity,Coventry,UK
a r t i c l e
i n f o
a b s t r a c t
Articlehistory:
Received15June2019 Receivedinrevisedform 12November2019 Accepted4December2019 Availableonline Keywords: Electrohysterogram(EHG) Featureextraction Gestationalweek Pretermdelivery Randomforest(RF).
Developingacomputationalmethodforrecognizingpretermdeliveryisimportantfortimely diagnosisandtreatmentofpretermdelivery.Themainaimofthisstudywastoevaluate electrohysterogram(EHG)signalsrecordedatdifferentgestationalweeksforrecognizingthe pretermdeliveryusingrandomforest (RF).EHGsignalsfrom300pregnantwomenwere dividedintotwogroupsdependingonwhenthesignalswererecorded:i)pretermandterm deliverywithEHGrecordedbeforethe26thweekofgestation(denotedbyPEandTEgroup),
andii) preterm and termdelivery withEHG recorded duringor afterthe26thweekof
gestation(denotedbyPLandTLgroup).31 linearfeaturesandnonlinear featureswere derivedfromeachEHGsignal,andthencomparedcomprehensivelywithinPEandTEgroup, andPLandTLgroup.Afteremployingtheadaptivesyntheticsamplingapproachandsix-fold cross-validation,theaccuracy(ACC),sensitivity,specificityandareaunderthecurve(AUC) wereappliedtoevaluateRFclassification.ForPLandTLgroup,RFachievedtheACCof0.93, sensitivityof0.89,specificityof0.97,andAUCof0.80.Similarly,theircorrespondingvalues
*Correspondingauthors.
E-mailaddresses:[email protected](J.Peng),[email protected](D.Hao),[email protected](L.Yang),
[email protected](M.Du),[email protected](X.Song),[email protected](H.Jiang),
[email protected](Y.Zhang),[email protected](D.Zheng).
1 Co-firstauthor.
Abbreviations:EHG,electrohysterogram;RF,randomforest;PE,pretermdeliverybeforethe26thweekofgestation;PL,pretermdelivery
afterthe26thweekofgestation;TE,termdeliverybeforethe26thweekofgestation;TL,termdeliveryafterthe26thweekofgestation;IUPC, intrauterinepressurecatheter;TOCO,tocodynamometer;K-NN,K-nearest;LDA,lineardiscriminantanalysis;QDA,quadratic discrimi-nantanalysis;SVM,supportvectormachine;ANN,artificialneuralnetwork;DT,decisiontree;TPEHG,term-pretermelectrohysterogram; RMS,rootmeansquare;tz,zero-crossing;PF,peakfrequency;MDF,medianfrequency;MNF,meanfrequency;SE,energyvaluesinsignal;
SM,maximumvaluesinsignal;SS,singularvaluesinsignal;SV,variancevaluesinsignal;AR,auto-regressivemodel;Tr,timereversibility; CorrDim,correlationdimension;SampEn,sampleentropy;LE,Lyapunovexponent;SD,standarddeviation;ADASYN,adaptivesynthetic samplingapproach;ACC,accuracy;AUC,theareaunderthecurve;ROC,thereceiveroperatingcharacteristiccurve.
https://doi.org/10.1016/j.bbe.2019.12.003
0208-5216/©2019TheAuthor(s).PublishedbyElsevierB.V.onbehalfofNaleczInstituteofBiocyberneticsandBiomedicalEngineeringof thePolishAcademyofSciences.ThisisanopenaccessarticleundertheCCBYlicense(http://creativecommons.org/licenses/by/4.0/).
were0.92,0.88,0.96and0.88for PEandTEgroup,indicatingthatRF couldbeusedto recognizepretermdeliveryeffectivelywithEHGsignalsrecordedbeforethe26thweekof
gestation.
©2019TheAuthor(s).PublishedbyElsevierB.V.onbehalfofNaleczInstituteof Bio-cyberneticsandBiomedicalEngineeringofthePolishAcademyofSciences.Thisisanopen accessarticleundertheCCBYlicense(http://creativecommons.org/licenses/by/4.0/).
1.
Introduction
Pretermdelivery,definedasbirthbefore37completedweeks of gestation, is aleading cause of neonatal morbidity and mortality,andhaslong-termadverseconsequencesforfetal health[1].Accuratediagnosisofpretermdeliveryisoneofthe mostsignificantproblemsfacedbyobstetricians.
The existing measurement techniques for diagnosing preterm delivery include tocodynamometer (TOCO), ultra-soundandfetalfibronectin.However,theyaresubjective,or suffer from high measurement variability and inaccurate diagnosisorpredictionofpretermdelivery[2].TOCOisoften influencedbysensorposition,thetightnessofbindingbythe examiner and maternal movement. Short cervical length measuredbytransvaginalultrasonographyhasbeen associ-ated with an increased risk of preterm delivery. But its accuracyforpredictionofpretermdeliveryisnotsatisfieddue tothehighfalsepositiverate.Fetalfibronectintest,whichis performedlikeapapsmear,hasnotbeenshowntoaccurately predictpretermdeliveryinwomenwhoareatlowriskorwho have noobvious symptoms. Comparatively, electrohystero-gram(EHG)whichreflectsthesumoftheelectricalactivitiesof the uterinecells could berecorded noninvasivelyfrom the abdominal surface. The parameters of EHG signals might provideaneffectivetoolforthediagnosis andpredictionof pretermdelivery[3].Therefore,usingEHGsignalisareliable methodatevaluatinguterineactivityandithasbeenusedin analyzinguterineactivityofnon-pregnantwomenaswell[4]. Manyfeatureshave beenextracted fromEHG signalsto recognizepretermdelivery,whichcanbegroupedintothree classes: linear features, nonlinear features and features related toEHG propagation[5]. Time, frequency and time-frequency features, such as root mean square, median frequency,peakfrequencyandenergydistributionhavebeen used to characterize EHG signals and distinguish between termandpretermdelivery[5–7].Besides,nonlinearfeatures, includingcorrelationdimension(CorrDim)[8],sampleentropy (SampEn)[9],Lyapunov exponent(LE)[10],andmultivariate multiscalefuzzyentropy[11]havebeenappliedtodescribethe nonlinearinteractionsbetweenbillionsofmyometriumcells [12,13].Inrecentyears,thepropagationvelocity,directionof the EHG signals, intrinsic mode functions from empirical modeldecomposition(EMD)[14]havebeenproposedasthe potentialdiscriminatorstopredicttheprogressofpregnancy. However,selectionofEHGfeatureswassomehowarbitraryin thesepublished studies.Acomprehensiveanalysisof these featuredifferencesbetweenpretermandtermdeliverywould thereforebeclinicallyandphysiologicallyuseful.
Machine-learning algorithms have been investigated to recognize the preterm delivery using EHG signals [15].
Conventional classifiersincludetheK-nearestneighbors (K-NN),linearandquadraticdiscriminantanalysis(LDAandQDA, respectively), support vector machine (SVM) [6], artificial neuralnetwork(ANN)classifiers[8,16,17],decisiontree(DT) [18],penalizedlogisticregression,rule-basedclassifier[19]and stackedsparseautoencoder(SSAE)[20].However,theKvalue of the K-NNclassifierissetsubjectively, LDA and QDAare affected bysample distribution, ANN and SSAEhave high computationalcomplexity[16],andSVMrequiresadditional stepstoreducethedimensionoftheextractedfeatures[21]. The published studies have reported that ANN, SSAE, Adaboost, DT, SVM, logisticand polynomial classifier have achievedbetterperformanceinrecognizingpretermdelivery. However,theseclassifierswereevaluatedondifferent data-base usingdifferent EHGfeatures, and therefore unableto determinethemostsignificantfeaturesforpredictingpreterm delivery.Randomforest(RF)isanensemblelearningmethod forclassification.DTisthebaselearnerinRF,whichhasbeen employedindataminingandfeatureselection[22].Classifi -cationaccuracycouldbeimprovedbygrowinganensembleof treesandlettingthemvoteforthemostpopularclass.Ren et al. reportedthatRF with simplerstructure achieved the sameaccuracyasANNforclassifyingpretermdeliverywith EHG signals [17]. Idowu et al. [19] also indicated that RF performedthebestandrobustlearningability.
ThemainaimofthisstudywastoevaluatetheEHGsignals recorded at different gestational weeks for recognizing pretermandtermdeliveryusingRF.Meanwhile,the impor-tanceofEHGfeaturesforpredictingpretermdeliverywouldbe ranked.
2.
Materials
and
methods
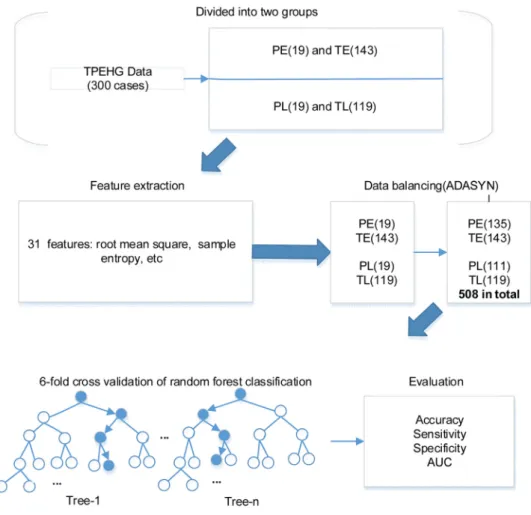
Theoverviewflowchartoftheproposedmethodinthisstudy is shown inFig. 1. Briefly, EHG signals from 300 pregnant womenweredividedintotwogroupsdependingonwhether the EHGsignalswererecorded beforeorafter 26th week of
gestation.Thirty-onelinearandnonlinearfeatureswerethen derivedfrom each EHGsignaland fedtoaRF classifierfor automaticidentificationoftermandpretermdelivery,andthe importanceoffeatureswasrankedbyDTs.Theperformanceof RFforrecognizingpretermdeliverywasthenevaluatedand compared betweenEHGsignalsrecordedat different gesta-tionalweeks.ThedetailsofeachsteparepresentedinFig.1.
2.1. EHGdatabase
EHGsignals inourstudywerefromthe openaccess term-preterm EHG (TPEHG) database developed in 2008 at the Faculty ofComputer andInformationScience, Universityof
Fig.1–Flowchartoftheproposedmethod.
Note:PE:pretermdeliverywithEHGrecordedbeforethe26thgestationweek,TE:termdeliverywithEHGrecordedbeforethe 26thgestationweek,PL:pretermdeliverywithEHGrecordedafterthe26thgestationweek,TL:termdeliverywithEHG recordedafterthe26thgestationweek,ADASYN:adaptivesyntheticsamplingapproach,AUC:theareaunderthecurveof
receiveroperatingcharacteristic.
Ljubljana,Ljubljana[23].ThreechannelsofEHGsignalswere recordedfromtheabdominalsurfaceusingfourelectrodes,as showninFig.2. Three-channelEHGsignalsweremeasured between the topmost electrodes (channel 1: E2-E1), the leftmostelectrodes (channel2:E2-E3), the lowerelectrodes (channel3:E4-E3)separately.Therecordingtimewas30min withthesamplingfrequencyof20Hz.Apreviouslypublished research has confirmed that the EHG from channel 3was regardedasthemostdistinguishable signalsfor classifying pretermand termdelivery[17]. Therefore,asa pilotstudy, channel3wasselectedforfurtheranalysis.
EHGsignalsfrom300pregnantwomen(262casesofterm delivery,and38casesofpretermdelivery)weredividedinto twogroupsdependingonwhenthesignalswererecorded:i) pretermandtermdeliverywithEHGrecordedbeforethe26th
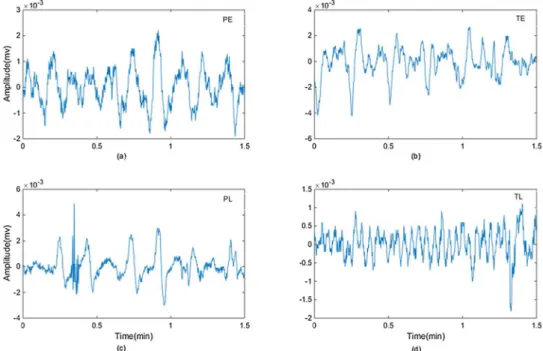
weekof gestation(denotedbyPEand TEgroup,19and 143 casesrespectively),andii)pretermandtermdeliverywithEHG recordedduringorafterthe26thweekofgestation(denotedby PLandTLgroup,19and119casesrespectively).Table1shows thenumberofEHGrecordingsinPEandTEgroupandinPLand TLgroup.Fig.3showsfourtypicalexamplesofEHGsegments fromeachgroup.
2.2. EHGsignalpreprocessing
ThemainfrequencycomponentofEHGsignalrangesbetween 0and5Hz[24].TheEHGsignalspreprocessedbythe band-pass filter of 0.08 4Hz were selected from the TPEHG database,inwhichtheinterferencesfromfetalandmaternal electrocardiogram, respiratory movement, motion artifacts and 50/60Hzpower noise had beenremoved[25]. Further-more, the first and last 5min of EHG segments were abandoned to avoid the transient effects due to filtering process[18],andtheremaining20minEHGsignalswereused forfurtheranalysis.
2.3. EHGfeaturesextraction
Thirty-one features wereextracted with time domain, fre-quencydomain,time-frequencydomainandnonlinear anal-ysisasfollows.
2.3.1. Rootmeansquare(RMS)
RMS is a conventional method for investigating signal amplitude changes. Given a time series of
–
Fig.2–Theplacementoftheelectrodesontheabdomen. Channel1=E2-E1,Channel2=E2-E3,Channel3=E4-E3
x ið Þ;i¼0;. . .;N 1,Nisthesignallength,hereN=600.RMS wascalculatedas:
rffiffiffiffi
1
RMS¼ (1)
N
2.3.2. Autocorrelationzero-crossing(tRxx)
Autocorrelationzero-crossing,tRxx;isdefinedasthefirst zero-crossingstartingatthepeakintheautocorrelationRxx(t)ofthe signal xðtÞ [26]. Considering the data distribution, tRxx was calculatedas: RxxðtRxxÞ ¼0 N Rxxt sgnð ð Þx iþtÞÞ X ðÞ ¼ x i ð (2) i¼1 1;x>0 ðÞ¼ sgnx 0;x<0
wherex ið ÞistheamplitudeofEHGsignalatsamplingpointi.
2.3.3. Peakfrequency(PF)
PFcorrespondstothelargestamplitudepeakoftheEHGsignal powerspectrumpwhichwascalculatedusingthefastdiscrete Fouriertransformofeachsignal.PFwascalculatedasfollows:
fs N 1
fmax¼argaf; Nmaxi¼0P ið Þ (3)
where fs=20Hzisthesamplingfrequency.
2.3.4. Medianfrequency(MDF)
MDFisdefinedasthefrequencyabovewherethesumsofthe partsaboveandbelowthefrequency-powerspectrumPare thesame.MDFwascalculatedfollows:
i i¼N 1 X X fs ; P ið Þ ¼ PðiÞ (4) fmed¼i N i¼0 i
whereiisthei-thlineofthepowerspectrum.
2.3.5. Meanfrequency(MNF)
MNFisthecentroidfrequencyofthepowerspectrumandis definedasfollows: I X fiPi MNF¼i¼1 (5) I X Pi i¼1
where pi isthei-th lineof the powerspectrum; fi isthe frequencyvariable;andIisthehighestharmonic(I¼N
2Þ.Nis thesignallength,hereN=600.
2.3.6. Featuresextractedfromwaveletdecomposition
Featuresfromthewaveletdecompositionmainlyincludedthe maximum, energy, singularandvariance values.Each EHG recordingwasdecomposedintodetailcoefficientswithsymlet 5 [26] as shown in Fig. 4. Theenergy SE2;SE3;SE4;SE5, the maximum SM2;SM3;SM4;SM5, the singular SS2;SS3;SS4;SS5 andthevarianceSV2;SV3;SV4;SV5ofthewaveletcoefficients werethencalculatedatthedetaillevelof:3,4,5,6(namedW2, W3,W4andW5respectively).
2.3.7. Featuresextractedfromautoregressive(AR)model
ARisatimeseriesmodelthatusesobservationsfromprevious time stepsasinput toaregression equation topredictthe valueatthenexttimestep.
p
X
xm¼ aixm iþem (6)
i¼1
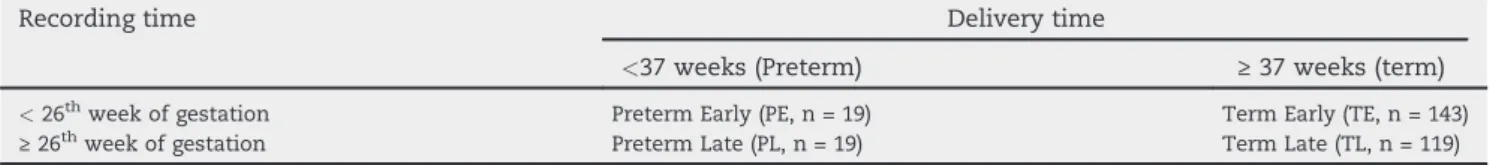
Table1 ThenumberofEHGrecordingsinPEandTE,PLandTLgroupsfromTPEHGdatabase.
Recordingtime Deliverytime
<37weeks(Preterm) ≥37weeks(term)
<26th weekofgestation ≥26th weekofgestation
PretermEarly(PE,n=19) PretermLate(PL,n=19)
TermEarly(TE,n=143) TermLate(TL,n=119)
Fig.3–ExamplesofEHGsegments(1.5min)from:(a)PE(recordedbeforethe26thweekofgestation,withpretermdelivery);(b)
TE(recordedbeforethe26thweekofgestation,withtermdelivery);(c)PL(recordedduringorafterthe26thweekofgestation,
withpretermdelivery);(d)TL(recordedduringorafterthe26thweekofgestation,withtermdelivery).
wherepistheorderofARmodel,herep=5.a1,a2,a3,a4,a5and residualewerethemodelfeatures.emisthewhitenoise. 2.3.7.1.Timereversibility(Tr). Trwasusedtodescribeifthe probabilisticpropertiesofatimeseriesarechangeablewith respect totimereversal. Astochastic processis defined as time-reversibleifitisinvariantunderthereversalofthetime scale[33].Trwascalculatedasfollows:
Fig.4–WaveletdecompositionofEHGsignal.
3 M X 1 TrðtÞ ¼ ðM tÞ ðxm xm tÞ (7) m¼tþ1
WherexisatimeserieswithMsamples,M=24,000(20Hz☓60 s/min☓20min)andtisthetimedelay,heret=1.
2.3.8. Lyapunovexponent(LE)
LE characterizes the rate of separation between adjacent tracks in the phase space. l is a measure of how fast a trajectory converges from a given point into some other trajectory:
1 di
l¼limaf; lnaf; (8)
i! 1 i d0
where d0 represents the Euclidean distance between two statesofthesystematsomearbitrarytimei.
2.3.9. Sampleentropy(SampEn)
SampEn measures theirregularity of atime seriesof finite length.Themoreunpredictablethetimeseriesis,thehigher itsSampEn.Foragivenembeddingdimensionm,tolerancer andnumberofdatapointsM,SampEn(m,r,M)isthenegative logarithmoftheprobabilitythatiftwosetsofsimultaneous datapointsoflengthmhavedistance<rthenthetwosetsof simultaneousdatapointsoflengthm+1alsohavedistance<r. WehadtheEHGtime-seriesoflengthM=fx1;x2;. . .;xMgwitha constant time interval t. The number of vector pairs in templatevectorsoflengthmandm+1werecountedhavingd [Xm(i),Xm(j)]<randdenoteditbyBandArespectively.The
A
SampEn¼ logaf; (9)
B
A=numberoftemplate vector pairshavingd[Xm+1(i),
Xm+1(j)]<roflengthm+1
B=numberoftemplatevectorpairshavingd[Xm(i),Xm(j)]< roflengthm
mvariedfrom1to2,andrfrom0.1SDto0.25SD(SDisthe standard deviation of a time series ). In this study,m=2, r=0.1SD,whichhasgotpromisingresultinotherresult[26].
2.3.10. Correlationdimension(CorrDim)
CorrDim(Dcorr)isameasureofthedimensionalityofthespace occupiedbyaset ofrandom points.Foratimeseriesof M points:{y ið Þ:1≤i≤M},theformulaareasfollows:
logaf;ðC tðÞÞ
Dcorr¼limaf; (10)
t!0 logaf;ðtÞ MC MC X X 1 C tð Þ ¼ lim af; 2 uðt jy ið Þ yðjÞjÞ (11) MC i¼1 j¼iþ1 MC! 1
where u½: is the Heaviside function, t is the limit for the distancebetweentwopointsonthe systemtrajectory,Mis thenumberofthetrajectorypoints.yistheEHGtimeseries. MC=23,999(M-1,M=24,000).
2.4. ComparisonofEHGfeaturesbetweentermand pretermdelivery
Themean SDofthederivedEHGfeatureswerecalculated acrossallthecases inthePEandTEgroup,andPL andTL
group. Non-parametric t-test (Mann–Whitney U test) was performedusingSPSS22(IBMCorporation,NewYork,United States)toassessthedifferenceofEHGfeaturesbetweenPEand TE, and between PL and TL. A p-value below 0.05 was consideredstatisticallysignificant.
2.5. Termandpretermclassification
2.5.1. Adaptivesyntheticsamplingapproach(ADASYN)
TPEHG dataset isnot balancedin term of the samplesize betweentermdelivery(majorityclass,262cases)andpreterm deliveries(minorityclass,38cases).Classifiersareoftenmore sensitive to the majority class and less sensitive to the minorityclass,leadingtobiasedclassification[27].ADASYN wasemployedinthisstudytooversampletheminorityclass (preterm) to balance the term and preterm samples [28]. Therefore,thesamplesizeofPEincreasedfrom19to135cases, andPLincreasedfrom19to111cases.Intotal,therewere278 casesinPEandTEgroup,and230casesinPLandTLgroup (Fig.5).
2.5.2. Randomforest
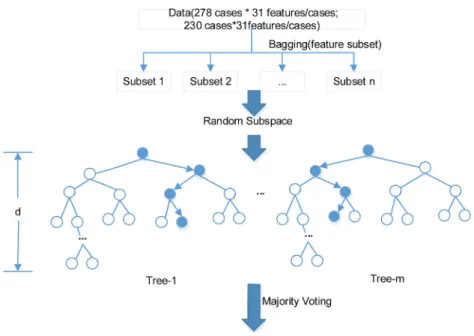
31 features/case☓278 cases from PE and TE group, and 31 features/case☓230cases fromPLandTLgroupwere respec-tivelydividedintosubset1tonandenteredtothebaselearner DT(tree-1,tree-2,. . .,tree-m)randomly.Thevalueofnwas determinedbythenumberoffeatures.Thenumberoffeatures ineachsubsetwaschosenrandomlybutnotexceedingthe presetmaximum.Thevalueofmisthenumberofbaselearner DT.Thedepthddeterminesthemaximumlayereachtreecan reach.
ADT,which isappliedtoselectfeatures,isformedby randomly selected subsetof features.The feature impor-tanceisrankedbasedonitsinfluenceontheDTprediction
Fig.5–TheschematicdiagramofRFclassifier.
Note:Themaximumnumberoffeaturesineachsubsetis29,thenumberofDTm=89andthedepthofeachtreed=20.Two RFclassifiersweredeveloped,respectively,oneofwhichusing278casesfromPEandTEgroupandtheotherusing230cases fromPLandTLgroup.
–
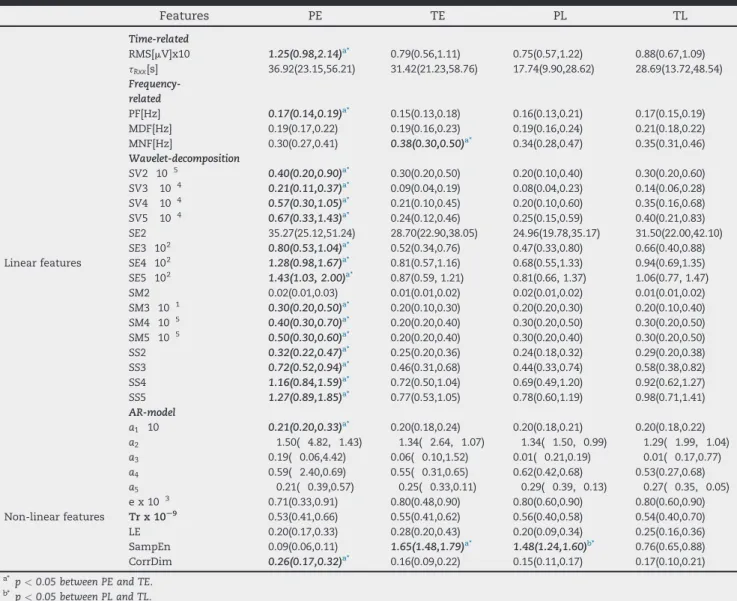
Table2 EHGfeaturesfromPEandTE,PLandTLgroups(median(25%,75%)).
Features PE TE PL TL Time-related RMS[mV]x10 1.25(0.98,2.14)a* 0.79(0.56,1.11) 0.75(0.57,1.22) 0.88(0.67,1.09) tRxx[s] 36.92(23.15,56.21) 31.42(21.23,58.76) 17.74(9.90,28.62) 28.69(13.72,48.54) Frequency-related PF[Hz] 0.17(0.14,0.19)a* 0.15(0.13,0.18) 0.16(0.13,0.21) 0.17(0.15,0.19) MDF[Hz] 0.19(0.17,0.22) 0.19(0.16,0.23) 0.19(0.16,0.24) 0.21(0.18,0.22) MNF[Hz] 0.30(0.27,0.41) 0.38(0.30,0.50)a* 0.34(0.28,0.47) 0.35(0.31,0.46) Wavelet-decomposition 5 SV2 10 0.40(0.20,0.90)a* 0.30(0.20,0.50) 0.20(0.10,0.40) 0.30(0.20,0.60) 4 SV3 10 0.21(0.11,0.37)a* 0.09(0.04,0.19) 0.08(0.04,0.23) 0.14(0.06,0.28) 4 SV4 10 0.57(0.30,1.05)a* 0.21(0.10,0.45) 0.20(0.10,0.60) 0.35(0.16,0.68) 4 SV5 10 0.67(0.33,1.43)a* 0.24(0.12,0.46) 0.25(0.15,0.59) 0.40(0.21,0.83) SE2 35.27(25.12,51.24) 28.70(22.90,38.05) 24.96(19.78,35.17) 31.50(22.00,42.10) SE3 102 0.80(0.53,1.04)a* 0.52(0.34,0.76) 0.47(0.33,0.80) 0.66(0.40,0.88)
Linearfeatures SE4 102 1.28(0.98,1.67)a* 0.81(0.57,1.16) 0.68(0.55,1.33) 0.94(0.69,1.35)
SE5 102 1.43(1.03,2.00)a* 0.87(0.59,1.21) 0.81(0.66,1.37) 1.06(0.77,1.47) SM2 0.02(0.01,0.03) 0.01(0.01,0.02) 0.02(0.01,0.02) 0.01(0.01,0.02) 1 SM3 10 0.30(0.20,0.50)a* 0.20(0.10,0.30) 0.20(0.20,0.30) 0.20(0.10,0.40) 5 SM4 10 0.40(0.30,0.70)a* 0.20(0.20,0.40) 0.30(0.20,0.50) 0.30(0.20,0.50) 5 SM5 10 0.50(0.30,0.60)a* 0.20(0.20,0.40) 0.30(0.20,0.40) 0.30(0.20,0.50) SS2 0.32(0.22,0.47)a* 0.25(0.20,0.36) 0.24(0.18,0.32) 0.29(0.20,0.38) SS3 0.72(0.52,0.94)a* 0.46(0.31,0.68) 0.44(0.33,0.74) 0.58(0.38,0.82) SS4 1.16(0.84,1.59)a* 0.72(0.50,1.04) 0.69(0.49,1.20) 0.92(0.62,1.27) SS5 1.27(0.89,1.85)a* 0.77(0.53,1.05) 0.78(0.60,1.19) 0.98(0.71,1.41) AR-model a1 10 0.21(0.20,0.33)a* 0.20(0.18,0.24) 0.20(0.18,0.21) 0.20(0.18,0.22) a2 1.50( 4.82, 1.43) 1.34( 2.64, 1.07) 1.34( 1.50, 0.99) 1.29( 1.99, 1.04) a3 0.19( 0.06,4.42) 0.06( 0.10,1.52) 0.01( 0.21,0.19) 0.01( 0.17,0.77) a4 0.59( 2.40,0.69) 0.55( 0.31,0.65) 0.62(0.42,0.68) 0.53(0.27,0.68) a5 0.21( 0.39,0.57) 0.25( 0.33,0.11) 0.29( 0.39, 0.13) 0.27( 0.35, 0.05) 3 ex10 0.71(0.33,0.91) 0.80(0.48,0.90) 0.80(0.60,0.90) 0.80(0.60,0.90) Non-linearfeatures Trx10S9 0.53(0.41,0.66) 0.55(0.41,0.62) 0.56(0.40,0.58) 0.54(0.40,0.70) LE 0.20(0.17,0.33) 0.28(0.20,0.43) 0.20(0.09,0.34) 0.25(0.16,0.36) SampEn 0.09(0.06,0.11) 1.65(1.48,1.79)a* 1.48(1.24,1.60)b* 0.76(0.65,0.88) CorrDim 0.26(0.17,0.32)a* 0.16(0.09,0.22) 0.15(0.11,0.17) 0.17(0.10,0.21)
a* p<0.05betweenPEandTE. b* p
<0.05betweenPLandTL.
resultsindicatedbyout-of-bag(OOB)index.Withtheranked features,allDTsintheforestwouldvoteforthemostpopular class[22].
2.5.3. Classificationevaluation
Six-foldcrossvalidation methodwasappliedtoevaluate the RF performance for classifying preterm and term delivery, independently for thePE and TEgroup andfor thePLandTLgroup.ThePEandTEgroup,andthePLandTL groupwererandomlypartitionedintosixsubsets respec-tively,fiveofwhichwereemployedtotraintheRF,theother wasusedtotesttheRF.Thecross-validationprocesswas repeatedsixtimes,witheachofthesixsubsetsusedonceas testdata.
Theaccuracy(ACC),sensitivity,specificity[29]fromthe six-foldcross validationwereaveraged toevaluatethe perfor-manceof RFclassificationresults,independentlyfor thePE andTEgroup,andforthePLandTLgroup.Theareaunderthe curve(AUC)fromthereceiveroperatingcharacteristic(ROC) curvewasalsocalculatedandcomparedbetweenthePEand TEgroup,andthePLandTLgroup.
3.
Results
3.1. ComparisonofEHGfeaturesbetweengroupsofterm andpretermdelivery
The31EHGfeaturesfromPEandTEgroup,PLandTLgroupare summarizedinTable2.PF,SV2;SV3;SV4;SV5;SE3;SE4;SE5;SM3;
SM4;SM5;SS2;SS3;SS4;SS5ofwaveletdecomposition,a1ofAR modelandCorrDimfromPEweresignificantlylargerthanthose ofTE(allp<0.05),whileRMS,MNFandSampEnfromPEwere significantlysmallerthanTE(allp<0.05).SampEnofPLwas significantly larger than TL (p<0.05). No other significant difference wasfound.Thefeatureswithsignificantdifference areshowninFig.6.
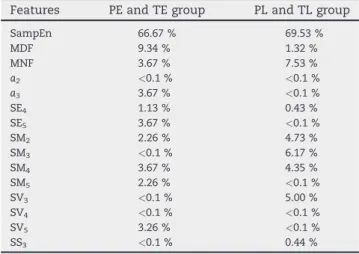
3.2. Featureimportance
Table3showsthe15keyfeatureswhichwereidentifiedasthe bestfeaturesforrecognizingpretermdeliverybothinPEand TE group, and PL and TL group. The feature importance accountedforlessthan0.1%werea2,SM3,SV3,SV4,SS3inPE
–
Fig.6–EHGfeaturesfromPEandTE,PLandTLgroupswithsignificantdifferenceinmedian(p<0.05).
andTEgroup,anda2,a3,SE5,SM5,SV4,SV5inPLandTLgroup.It
wasnoticedthatSampEn,MDF,MNF,SE4,SM2andSM4played important roles on the classification of preterm and term deliveryinbothPEand TE,PLandTLgroups.Inparticular, SampEn accounted for nearly 70 % of the importance for recognizingpretermdelivery.
3.3. EvaluationofRFclassifier
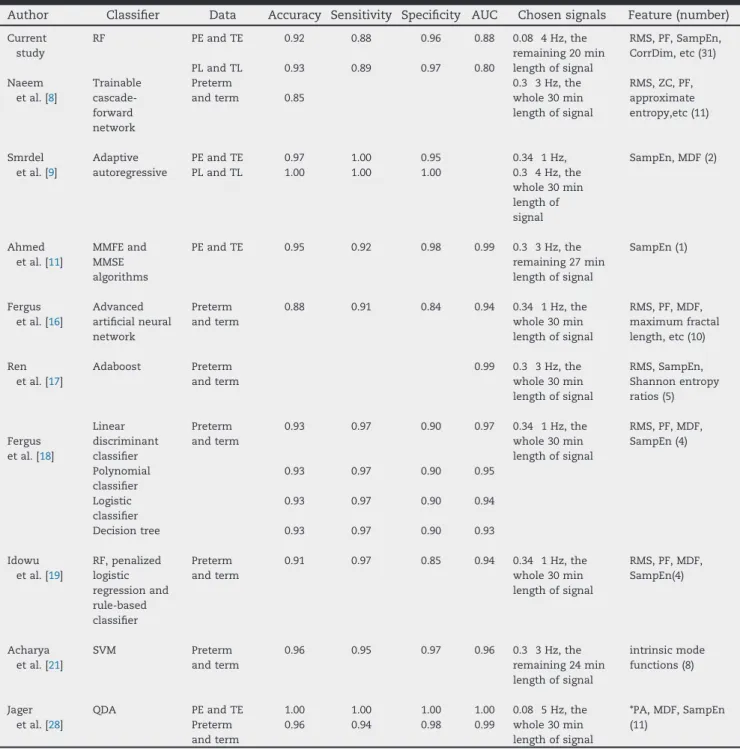
ROCcurvesforclassifyingpretermdeliveryinPEandTEgroup, and PL and TL group are shown in Fig. 7. There was no significantdifference betweenthetwo AUCsfrom the ROC curves(p=0.70).AsshowninTable4,RFachievedtheACCof 0.92,sensitivityof0.88,specificityof0.96andAUCof0.88forPE andTEgroup,andACCof0.93,sensitivityof0.89,specificityof 0.97,andAUCof0.80forPLandTLgroup.
Table4summarizestheperformanceofRFmodelinthis study interms of ACC, sensitivity, specificity and AUC, in comparison with the previously published papers using TPEHGdatabase[8,9,11,16–19,21,28].Allthestudiesachieved over80%ACCandsensitivity.
Table3 Featureimportanceforrecognizingpreterm
delivery,separatelyforPEandTE,andPLandTLgroups.
Features PEandTEgroup PLandTLgroup
SampEn 66.67% 69.53% MDF 9.34% 1.32% MNF 3.67% 7.53% a2 <0.1% <0.1% a3 3.67% <0.1% SE4 1.13% 0.43% SE5 3.67% <0.1% SM2 2.26% 4.73% SM3 <0.1% 6.17% SM4 3.67% 4.35% SM5 2.26% <0.1% SV3 <0.1% 5.00% SV4 <0.1% <0.1% SV5 3.26% <0.1% SS3 <0.1% 0.44%
4.
Discussion
Inthisstudy,RFclassifiersweredevelopedusingEHGsignals recorded before and after the 26th gestational week to recognize the preterm delivery. Among the extracted EHG features,SampEn,MDF,MNF,SE4,SM2andSM4weremore important for classification of preterm and term delivery whether early or later recorded. With RF classifier, the classificationresultsinPEand TEgroup(ACCof 0.92,SEof 0.88,SPof0.96,AUCof0.88)weresimilartotheresultsinPL andTLgroup(ACCof0.93,SEof0.89,SPof0.97,AUCof0.80). Compared withotherstudiesusingTPEHG database,the currentstudyextractedEHGfeaturesincluding27linearand4 nonlinearfeaturesmorecomprehensively.RFclassifierwhich did not require computational complexity, performed a promising result without additional step of pre-selected featuresinawiderbandpassfilterof0.08 4Hz.Thefeature importancewasrankedbyRFbasedonclassificationaccuracy. AftertheimportanceofdifferentfeatureswasrankedbyDT, SampEn was found to be the most important feature for recognizingpretermdelivery.Thepreviousstudiesconcluded that nonlinear methods such as sample entropy [9,20], approximate entropy [8,20] and Shannon entropy [17] can
–
Table4 EvaluationofRFclassifierandsummaryofresearchworkonpredictionofpretermdeliveryusingthesameTPEHG
database.
Author Classifier Data Accuracy Sensitivity Specificity AUC Chosensignals Feature(number) Current study Naeem etal.[8] RF Trainable cascade-forward network PEandTE PLandTL Preterm andterm 0.92 0.93 0.85 0.88 0.89 0.96 0.97 0.88 0.80 0.08 4Hz,the remaining20min lengthofsignal 0.3 3Hz,the whole30min lengthofsignal RMS,PF,SampEn, CorrDim,etc(31) RMS,ZC,PF, approximate entropy,etc(11) Smrdel etal.[9] Adaptive autoregressive PEandTE PLandTL 0.97 1.00 1.00 1.00 0.95 1.00 0.34 1Hz, 0.3 4Hz,the whole30min lengthof signal SampEn,MDF(2) Ahmed etal.[11] MMFEand MMSE algorithms PEandTE 0.95 0.92 0.98 0.99 0.3 3Hz,the remaining27min lengthofsignal SampEn(1) Fergus etal.[16] Advanced artificialneural network Preterm andterm 0.88 0.91 0.84 0.94 0.34 1Hz,the whole30min lengthofsignal RMS,PF,MDF, maximumfractal length,etc(10) Ren etal.[17] Adaboost Preterm andterm 0.99 0.3 3Hz,the whole30min lengthofsignal RMS,SampEn, Shannonentropy ratios(5) Fergus etal.[18] Linear discriminant classifier Polynomial classifier Logistic classifier Decisiontree Preterm andterm 0.93 0.93 0.93 0.93 0.97 0.97 0.97 0.97 0.90 0.90 0.90 0.90 0.97 0.95 0.94 0.93 0.34 1Hz,the whole30min lengthofsignal RMS,PF,MDF, SampEn(4) Idowu etal.[19] RF,penalized logistic regressionand rule-based classifier Preterm andterm 0.91 0.97 0.85 0.94 0.34 1Hz,the whole30min lengthofsignal RMS,PF,MDF, SampEn(4) Acharya etal.[21] SVM Preterm andterm 0.96 0.95 0.97 0.96 0.3 3Hz,the remaining24min lengthofsignal intrinsicmode functions(8) Jager etal.[28] QDA PEandTE Preterm andterm 1.00 0.96 1.00 0.94 1.00 0.98 1.00 0.99 0.08 5Hz,the whole30min lengthofsignal *PA,MDF,SampEn (11)
*PA,peakamplitudeofthenormalizedpowerspectrum.11features(PA,MDF,SampEn)selectedfrom5bands,respectively.
providebetter discriminationbetweenpregnancyand labor contractionscomparedtolinearmethods [34].Itisprobably becauseentropyreflectsthecomplexandnonlineardynamic interactionsbetweenmyometriumcells[8,23].SampEnwas considered to be particularly suitable for revealing EHG changesinrelationtopregnancyprogressionandlabor[33]. RFclassifiercouldobtainthepromisingresultsastheprevious studiesillustrated[17,19].
The performance of recognizing preterm delivery was influencedbythecut-offfrequencyoffilterandtheextracted features.Jageretal.[28]gotthehighestclassificationACCof
100 %withfeaturesfrom the frequencyband of 0.08 5Hz when using theentire records of TPEHG database. Most of studiesusedthespecificfeatures[9,11,30]orselectedfeatures [8,16–18,21]forpredictionofpretermdelivery,whileRFutilized the extracted features without additional feature selection algorithm.SimilartotheotherstudiesinTable4,thecurrent studyextractedfeaturesfromtheentirerecordsbecausethere werenoannotatedcontractionintervalsorevenno contrac-tion during earlyrecordings.Recently, variousfeaturesand classifiershavebeenproposedtorecognizeuterine contrac-tion (UC)withIcelandic16-electrodedatabase[20,31–33].As
UCdetectionisnecessaryformonitoringlaborprogress,some studies extracted features from EHG bursts [20,32,33] and achievedreliableresultsofUCdetectionbymachinelearning anddeeplearningalgorithms[35–37].Amulti-channelsystem forrecognizinguterineactivitywithEHGsignalhasalsobeen developed in clinical research [38]. They also provided importantwaysforrecognitionofpretermdeliverywithUC.
ADASYNtechniquewasapplied tosolve theproblemof unbalanced data in our study, though synthetic minority oversampling technique (SMOTE) algorithm has been employedinthepreviousstudies[16–18,23].Comparedwith ADASYN technique, the synthetic samples generated by SMOTEalgorithmmayincreasethelikelihoodofdata over-lapping which will not provide more useful information [12,27].ADASYNachieved betterresultsfor classificationof pretermdeliveryincurrentstudy.
The present work has the following limitations. The syntheticdatageneratedbyADASYNislessconvincingthan theclinicallycollectedEHGdata.MoreclinicalEHGsignalsare essential,inparticularfrompretermdelivery.A comprehen-sive study has been conducted on various EHG features, however,sixteenofwhichwerefromwaveletdecomposition coefficients. Therefore, AAR model [9], EMDtechnique [17], multivariatemultiscaleentropyfeatures[8]andcombination ofmulti-channelEHGsignals[5,11,39]couldbeinvestigatedto improvethepredictionofpretermdelivery[39].Nevertheless, asapilotstudy,thepositiveresultsfromusingchannel3was thefirststepforevaluatingtheeffectivenessofaRFmodel. Furthermore,comparisonofdifferentclassifiersfor recogniz-ingpretermdeliverycouldbeconsideredinfuturestudy.
5.
Conclusion
Incurrentstudy,sampleentropyplayedthemostimportant roleonrecognizingpretermdeliveryamongthe31extracted features. RF classifier was a promising method without additional stepsof selectingfeatures.EHGsignalsrecorded beforethe26thweekofgestationachievedthesimilarresults tothoseafterthe26thweek.Thisstudyisofgreathelpfulinthe early prediction of preterm delivery and early clinical intervention.
Authors'
contributions
JinPeng,HongqingJiangdesignedtheanalysismethodand classifiers;Lin Yangand Mengqing Duassisted withsignal preprocessing; Xiaoxiao Song and Yunhan Zhang assisted withdatacuration;JinPenganalyzedtheresultsandwrotethe originaldraft;DongmeiHaoandDingchangZhengreviewed thedraft
Ethics
approval
and
consent
to
participate
TheanalysisofthisdatabasewasapprovedbytheResearch EthicsCommitteeoftheFacultyResearchEthicsPanel(FREP) of Beijing University of Technology and Anglia Ruskin University.
Availability
of
data
and
materials
Thedatabaseusedinthisstudyisavailabletoaccessviathe link: http://lbcsi.fri.uni-lj.si/tpehgdb/ or https://www. physionet.org/physiobank/database/tpehgdb/.
r e f e r e n c e s
[1] WangML,DorerDJ,FlemingMP,CatlinEA.Clinical outcomesofnear-terminfants.Pediatrics2004;114(2):372–6.
[2] deLauH,RabottiC,OosterbaanHP,etal.Studyprotocol: PoPE-predictionofpretermdeliveryby
electrohysterography.BMCPregnancyChildbirth2014;14 (1):192.
[3] VinkenMPGC,RabottiC,MischiM,OeiG.Accuracyof frequency-relatedparametersoftheelectrohysterogramfor predictingpretermdeliveryareviewoftheliterature. ObstetGynecolSurv2009;64(8):529–41.
[4] SammaliF,KuijstersNPM,SchootBC,etal.Feasibilityof transabdominalElectrohysterographyforanalysisofuterine activityinnonpregnantwomen.ReprodSci2018;1–10.
[5] AlamedineD,DiabA,MuszynskiC,KarlssonB,KhalilM, MarqueC.Selectionalgorithmforparametersto
characterizeuterineEHGsignalsforthedetectionofpreterm labor.SignalImageVideoProcess2014;8(6):1169–78.
[6] AroraS,GargG.AnovelschemetoclassifyEHGsignalfor termandpre-termpregnancyanalysis.IntJComputAppl 2012;51(18):37–41.
[7] DiabMO,MarqueC,KhalilMA.Classificationforuterine EMGsignals:comparisonbetweenARmodelandstatistical classificationmethod.IntJComputCognit2008;5(1):255–72.
[8] NaeemSM,SeddikAF,EldosokyMA.Newtechniquebased onuterineelectromyographynonlinearityforpreterm deliverydetection.JEngTechnolRes2014;7(6):107–14.
[9] SmrdelA,JagerF.Separatingsetsoftermandpre-term uterineEMGrecords.PhysiolMeas2015;36(2):341–55.
[10] HorobaK,JezewskiJ,MatoniaA.Earlypredictingariskof pretermlabourbyanalysisofantepartum
electrohysterograhicsignals.BiocybernBiomedEng2016;36 (4):574–83.
[11] AhmedMU,ChanwimalueangT,ThayyilS,MandicPD.A multivariatemultiscalefuzzyentropyalgorithmwith applicationtouterineEMGcomplexityanalysis.Entropy 2016;19(1).
http://dx.doi.org/10.3390/e19010002
[12] AlamedineD,KhalilM,MarqueC.Parametersextraction andmonitoringinuterineEMGsignals.Detectionof pretermdeliveries.InnovationandResearchinBiomedical engineering2013;34(4-5):322–5.
[13] HassanM,TerrienJ,AlexanderssonA.NonlinearityofEHG signalsusedtodistinguishactivelaborfromnormal pregnancycontractions.Annualinternationalconference oftheIEEEengineeringinmedicineandbiology.
2010;2387–90.
[14] LiliC,YaruH.FeatureextractionandclassificationofEHG betweenpregnancyandlabourgroupusingHilbert-Huang transformandextremelearningmachine.ComputMath MethodsMed2017;2017:1–9.
[15] AlamedineD,KhalilM,MarqueC.Comparisonofdifferent EHGfeatureselectionmethodsforthedetectionofpreterm labor.ComputMathMethodsMed2013;2013(4):585–93.
[16] FergusP,IdowuI,HussainA.Advancedartificialneural networkclassificationfordetectingpretermbirthsusing EHGrecords.Neurocomputing2016;188(5):42–9.
[17] RenP,YaoS,LiJ.Improvedpredictionofpretermdelivery usingempiricalmodedecompositionanalysisofuterine electromyographysignals.PLoSOne2015;10(7):1–16.
[18] FergusP,CheungP,HussainA.Predictionofpreterm deliveriesfromEHGsignalsusingmachinelearning.PLoS One2013;8(10):e77154.
[19] IdowuI,FergusP,HussainA,etal.Artificialintelligencefor detectingpretermuterineactivityingynacologyand obstertriccare.IEEEinternationalconferenceoncomputerand informationtechnology;ubiquitouscomputingand
communications;dependable,autonomicandsecurecomputing; pervasiveintelligenceandcomputing.2015;215–20.
[20] ChenL,HaoY,HuX,etal.Detectionofpretermbirthin electrohysterogramsignalsbasedonwavelettransform andstackedsparseautoencoder.PLoSOne2019;14(4).
[21] AcharyaUR,SudarshanVK,RongSQ.Automateddetection ofprematuredeliveryusingempiricalmodeandwavelet packetdecompositiontechniqueswithuterine
electromyogramsignals.ComputBiolMed2017;85:33–42.
[22] BreimanL.Randomforest.MachLearn2001;45(1):5–32.
[23] Fele-ŽoržG,KavšekG,Novak-AntolicŽ.Acomparisonof variouslinearandnonlinearsignalprocessingtechniques toseparateuterineEMGrecordsoftermandpre-term deliverygroups.MedBiolEngComput2008;46(9):911–22.
[24] DevedeuxD,MarqueC,MansourS,GermainG,DucheneJ. Uterineelectromyography:acriticalreview.AmJObstet Gynecol1993;169(6):1636–53.
[25] VerdenikI,PajntarM,LeskosekB.Uterineelectricalactivity aspredictorofpretermbirthinwomenwithpreterm contractions.EurJObstetGynecolReprodBiol2001;95 (2):149–53.
[26] MoslemB,KarlssonB,DiabMO.Classificationperformance ofthefrequency-relatedparametersderivedfromuterine EMGsignals.MedicineandBiologySociety2011;3371–4.
[27] HeH,BaiY,GarciaEA,LiS.ADASYN:adaptivesynthetic samplingapproachforimbalancedlearning.Proceedings 2008internationaljointconferenceonneuralnetworks (IJCNN);2008;1322–8.
[28] JagerF,LibensekS,GersakK,etal.Characterizationand automaticclassificationofpretermandtermuterine records.PLoSOne2018;13(8):e0202125.
[29] HuX,WangZ,RenX.ClassificationofsurfaceEMGsignal usingrelativewaveletpacketenergy.ComputMethods ProgramsBiomed2005;79(3):189–95.
[30] RyuJ,ParkC.Time-frequencyanalysisof
electrohysterogramforclassificationoftermandpreterm birth.IeieTransSmartProcessComput2015;4(2):103–9.
[31] AlexanderssonA,SteingrimsdottirT,TerrienJ,etal.The Icelandic16-electrodeelectrohysterogramdatabase.Sci Data2015;2150017.
[32] LiliC,YaruH.FeatureextractionandclassificationofEHG betweenpregnancyandlabourgroupusingHilbert-Huang transformandextremelearningmachine.ComputMath MethodsMed2017;2017:1–9.
[33] MischiM,ChenC,IgnatenkoT,etal.Dedicatedentropy measuresforearlyassessmentofpregnancyprogression fromsingle-channelelectrohysterography.IEEETrans BiomedEng2018;65(4):875–84.
[34] CarolaH,SherifAS,RodrigoR.Potentialuseof electrohysterographyinobstetrics:areviewarticle. JMaternNeonatalMed2019.
http://dx.doi.org/10.1080/14767058.2019.1639663
[35] DongmeiH,JinP,YingW,etal.Evaluationofconvolutional neuralnetworkforrecognizinguterinecontractionswith electrohysterogram.ComputBiolMed2019;2019 (113):103394.
[36] JinP,DongmeiH,HaipengL,etal.Preliminarystudyonthe efficientelectrohysterogramsegmentsforrecognizing uterinecontractionswithconvolutionalneuralnetworks. BiomedResInt2019.
http://dx.doi.org/10.1155/2019/3168541
[37] DongmeiH,QianQ,XiyaZ,etal.Applicationofdecision treeindeterminingtheimportanceofsurface
electrohysterographysignalcharacteristicsforrecognizing uterinecontractions.BiocybernBiomedEng2019;39(3).
[38] DongmeiH,YangA,XiangyunQ,etal.Developmentof electrohysterogramrecordingsystemformonitoring uterinecontraction.JHealthcEng2019;2019(1):1–9.
[39] LucovnikM,ManerWL,ChamblissLR,etal.Noninvasive uterineelectromyographyforpredictionofpreterm delivery.AmJObstetGynecol2011;204(3):228–38.
iron](data:image/gif;base64,R0lGODlhAQABAIAAAP///wAAACH5BAEAAAAALAAAAAABAAEAAAICRAEAOw==)