I
S THE
D
RAGON
L
EARNING TO
F
LY
?
A
N
A
NALYSIS OF THE
C
HINESE
P
ATENT
E
XPLOSION
∗
Markus E
BERHARDTaChristian H
ELMERSa,bZhihong Y
UcaCSAE, University of Oxford bUniversidad Carlos III de Madrid
cUniversity of Nottingham
August 2011
ABSTRACT
This paper analyses characteristics and determinants of the recent explosion of patent filings by Chinese firms both in China and the United States. We construct a firm-level dataset by matching USPTO and SIPO patents to Chinese manufacturing census data for the period 1999-2006. Using this integrated firm-level dataset, we show that the patent explosion is accounted for by a tiny, highly select group of Chinese companies in the information & communication technology (ICT) equipment industry. This handful of ICT companies accounts for nearly all Chinese USPTO patent filings as well as the vast majority of domestic SIPO patents despite there being a larger number of Chinese companies distributed across a wider range of industries that seeks patent protection domestically. Our empirical analysis further suggests that firms patenting in both US and China are considerably younger, larger and substantially more export-oriented than firms patenting exclusively in China. Our study contributes to the debate on China’s innovative prowess and its potential to transition from an imitator to an innovator economy.
Keywords China, firm, patents.
JEL Classification L25, O12
∗The paper was presented at the ‘UC Berkeley – Peking University Workshop on the Evolution of Chinese Patenting
and its Implications for Research and Innovation’ in Beijing, and a workshop at the University of Oxford — we thank seminar/session participants for their useful comments and suggestions. The authors thank Lei Hou and Jiarui Zhang for excellent assistance in the classification of SIPO patents. Eberhardt gratefully acknowledges financial support from the UK Economic and Social Research Council[grant number PTA-026-27-2048].
This paper is dedicated to the memory of Mark Rogers and his important contribution to economic research on innovation and intellectual property.
Corresponding author: [email protected].
1 Introduction
China’s economic success over the past three decades has been widely regarded as the result of its ability to produce manufactured goods at low cost, building on the availability of cheap labour and scale economies, while relying on existing (albeit in part advanced) technologies of production. China’s ability to upgrade its technology-base and its moving up the value-chain has been widely regarded as hampered by weak (intellectual) property rights enforcement (Zhao, 2006). More re-cently, however, there has been increasing evidence to support the argument that China is catching up fast in terms of scientific and technological innovation.1 The number of domestic invention patents filings with the Chinese patent office has increased at an average annual rate of 35% from around 15,600 to over 122,000 during the period 1999-2006.2 This catching-up process is paired with strengthened statutory intellectual property rights protection (Park, 2008) and an increased interest by policymakers in the role of intellectual property in fuelling domestic innovation by in-creasing foreign technology transfer and providing domestic firms with incentives to invest in R&D. Accordingly, the recently formulated National Patent Development Strategy (2011-2020) envisions an increase in the number of annual patent applications, including invention and utility patents as well as designs, from about 1.2 million in 2010 to 2 million in 2015. The plan also foresees a doubling of the number of patent applications filed by Chinese applicants overseas in the same time-frame. These ambitious targets reflect a boisterous mood and overall positive outlook for Chinese innovation in parts of the academic literature (e.g. Fischer and von Zedtwitz, 2004).
At the same time, there is evidence to suggest that most of the innovation in China is of merely incremental nature and hence the corresponding patents protect ‘small inventive steps’ rather than substantive new technologies (Puga and Trefler, 2010). While such incremental innovation may still be valuable and in fact account in large part for China’s growth success (Breznitz and Murphree, 2011),3 the concern is that the recent strong increase in domestic patent applications is produced overwhelmingly by low quality inventions which are driven by the incentives put in place by the Chinese government to encourage patenting directly rather than indirectly through the promotion of innovation (The Economist, 14th October 2010).4
Our analysis focuses on the recent ‘explosion’ in the number of patent applications by manufac-turing firms registered in China with the domestic State Intellectual Property Office of China (SIPO) as well as the US Patent and Trademark Office (USPTO), and investigates the drivers of this de-velopment. Instead of relying on standard measures of patent quality, such as citations, we infer information on underlying inventions by assessing where companies seek patent protection: only domestically with SIPO or also with the USPTO. Not only are the direct and indirect costs associated with obtaining patent protection higher in the US, but inventions are required to overcome a higher novelty hurdle in the patent examination with the USPTO compared to SIPO during our sample period (see Section 3). These differences suggest that a comparison of patents taken out with the USPTO and SIPO reveals information on the underlying invention and the corresponding patentees.
1According to OECD data, the number of full time equivalent R&D workers has nearly tripled between 1998 and 2008
reaching almost 2 million. Zhou and Leydesdorff (2006) point to China’s rapid increase in terms of scientific publications. See also Section 2.1.
2WIPO Statistics Database, January 2011.
3Breznitz and Murphree (2011) argue that the successfulprocess and logistics innovation(andnot“the fabled creature
of true [novel product]‘innovation”’) of the last decades has equipped China with “ultra mass-flexibility production” capabilities and thus put it into a uniquely strong position within the global network that represents manufacturing production today.
4The Economistreports of tax rebates, research awards, and a link to the allocation of government contracts. See also
To conduct our analysis, we construct a novel firm-level dataset that combines patent data and company financials. We match both SIPO and USPTO patents filed between 1985 and 2006 to a subset of about 20,000 firms contained in China’s Annual Survey of Industrial Enterprises (ASIE) compiled by the National Bureau of Statistics of China (NBS) for the period 1999-2006. The pe-riod covered by our sample represents perhaps the most interesting pepe-riod in state innovation and intellectual property policy as well as enterprise innovation activity in China, combining aggressive opening up to FDI, policy commitments related to WTO-entry in 2001, strong increase in exporting, an amendment of the patent law, support for indigenous entrepreneurs, a swelling tide of Chinese returnees equipped with US PhDs and an accelerated pace of privatisation of or quasi-private spin-offs from government research institutions (Fischer and von Zedtwitz, 2004; Naughton, 2007; Hu and Mathews, 2008).
Our results show that a tiny number of private Chinese companies, concentrated in the elec-tronics industry, accounts for the largest share of the dramatic increase in USPTO patents held by Chinese residents. This selection also concerns the underlying technologies which are mostly related to electronics and semiconductors. The highly select group of Chinese firms seeking patent protec-tion in the US also accounts for the overwhelming share of domestic SIPO patents despite there being a relatively larger number of companies across a wider range of industries obtaining patent protection with SIPO.
Our objective is thus to analyse whether this small group of firms responsible for the dramatic increase in Chinese patenting represents the spearhead of a larger group of Chinese companies, poised to lead the Chinese economy to a wider technological take-off; or whether it merely reflects an exceptional, highly select group of firms, potentially supported by public policy, that is unlikely to represent a broader underlying technological leap among Chinese companies. Our analysis, there-fore, informs on the broader debate over China’s innovative prowess and potential development path, which may be based either on a ‘Red Queen’ run, which regards Chinese firms’ ability to stay close to the world technology frontier and to improve upon and adapt existing innovation as key to its continued growth (Breznitz and Murphree, 2011), or the need for the domestic development of genuinely novel product innovation that pushes the global technology frontier to avoid getting caught in a ‘middle income trap’ (The Economist, 25th June 2011).
Analysing the patenting decision and patent productivity for a sub-sample of years we find that there is a significant difference in the firm characteristics associated with patenting an innovation with both SIPO and USPTO in comparison with merely patenting with SIPO. We find that firms which fall into the former category tend to be younger, considerably more export-oriented and larger than their peers which only patent in China. This result is evident in both the analysis of the decision to patent in any one year as well as in that of the patent count. We interpret our findings as evidence for the patent explosion being largely the result of increased patenting by very few companies in the information technology equipment industry. These relatively young companies managed to grow extremely fast in size within few years and succeeded placing themselves into leading positions in global production chains. Our analysis of their patented inventions indicates that these companies are undertaking a myriad of different innovative activities, including product innovation albeit of a relatively low-tech character. These companies also account for the lion’s share in domestic patenting with SIPO, despite there being a much broader range of companies in a number of different industries patenting domestically. Our analysis, therefore, suggests that the patent explosion does not reflect a general technological take-off, but the success of an extremely small group of firms within a single industry.
The remainder of this paper is organized as follows. Section 2 briefly reviews the existing liter-ature on government innovation policy and patenting in China and charts recent innovation effort. Section 3 discusses institutional differences of the patent systems in China and the US which have a bearing on firms’ decisions to patent in these jurisdictions. Section 4 discusses the construction of our dataset. Section 5 explains our empirical strategy. Sections 6 and 7 discuss some descriptive evidence and our analytical results respectively. Section 8 offers some brief concluding thoughts.
2 Literature & Background
In this section, we cover innovation policy in China, provide some descriptives on broad measures of innovation effort over the past decade and discuss the existing empirical literature on patenting ac-tivity by Chinese firms, distinguishing aggregate economy, provincial-level and firm-level data. The latter has thus far been hampered by difficulties arising from matching Chinese firm-level data with official patent data, effectively limiting analysis to self-reported patent applications — a problem we overcome in the present study.
2.1 Innovation Policy
The analysis here is undertaken against the background of a pro-active innovation policy on behalf of the government of a developmental state. As is well-documented (Fischer and von Zedtwitz, 2004; Naughton, 2007; Hu and Jefferson, 2008), China’s state-driven innovation policy began with a relatively high ‘technology effort’ (relatively high R&D to GDP ratio) during the socialist period, albeit one which supported ‘episodic’ prestige innovations with limited economic relevance (e.g. the development of nuclear weapons or the successful launch of a man-made satellite). Following the pro-market reforms of the late 1970s, it was not until the mid-1980s that a more sophisticated government innovation system, which allocated research funding based on competitive tender, was introduced (the so-called ‘86-3 program’). Among the stated aims of this policy was the intention “to achieve ‘leap-frog’ development in key high-tech fields” (MOST, 2011a). Around the same time research institutes were actively encouraged to collaborate with business enterprises and spin-off successful ventures into quasi-private entities — a process which created some of the foremost tech-nology firms in China today (e.g. Founder, Tongfang, Legend). Subsequent techtech-nology and innova-tion policy expanded the focus to cover ‘basic research’ and reflects the recogniinnova-tion that successful innovation is necessarily built on a substantial talent base (so-called ‘97-3 program’; MOST, 2011b). The 97-3 program is at least in part responsible for the improvements in the human capital base, which saw the number of university graduates in engineering roughly double between 1999 and 2005, although these courses are not all comparable to undergraduate degrees in the US or Europe. In general terms the innovationpolicydescribed thus far focused primarily on state-owned entities, and in particular research institutes and universities — business enterprises (state-owned, foreign or private domestic) did not feature prominently (Naughton, 2007; Hu and Mathews, 2008).
As a striking reminder of the distance China’s economic development has covered over a rela-tively short period of time, it was not until the late 1990s that any state support related to technology and innovation was extended to private firms and startups (Naughton, 2007: 361). Thus this period represents the first instance in China’s recent economic history when state-owned and private enter-prises enjoyed a level playing field in terms of state support for technology and innovation (e.g. tax breaks, subsidised credit). Crucially, the equal treatment of enterprises in innovation policy was
ef-fectively extended to foreign-invested enterprises operating in the Middle Kingdom around the same time (Naughton, 2007: 366). Private property rights for homeowners and businesses were not fully guaranteed by the law until October 2007, on the one hand forcing entrepreneurs into complex private-public or foreign joint ventures in order to conduct business legally while on the other fos-tering a concentration on short-run profits, to the detriment of time-consuming innovation efforts (Breznitz and Murphree, 2011). Even in the present day the laws surrounding investment are said to be murky and theThe Economistmagazine concludes that “[o]wnership is rarely straightforward in China” (9th July, 2011).
An explicit desire among the central government officials to transform the country from an imi-tator to an innovator economy was stated in the 2006-2010 5-year plan, which targeted 2015 as the year in which to achieve this goal (Hu and Jefferson, 2008: 288). As a result local governments, which jostle with each other for increased domestic and foreign investment, are argued to act un-der the impression that “virtually any action they take in support of high-technology industry and technological development will be acceptable” (Naughton, 2007: 368).
2.2 Innovation Effort
Simple aggregates for R&D expenditure by sector indicate how the late 1990s became a game-changer for Chinese innovation effort: in 1997, 42.7% of the national R&D expenditure was spent by business enterprises, in subsequent years this share rose to 44.7% (1998), 49.7% (1999) and 60.2% (2000), reaching 69.1% by 2006 (MOST,various).
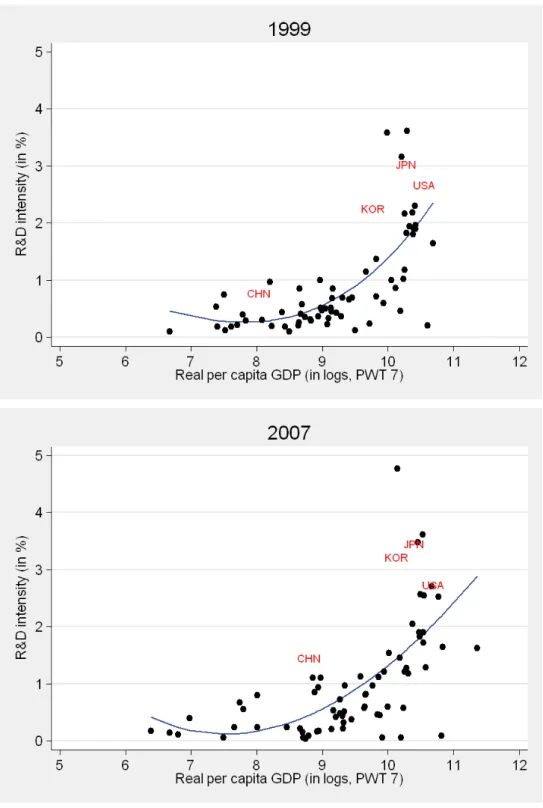
In Figure 1 we provide some macro evidence for the rapid changes apparent in China’s inno-vation effort over our sample period. Apart from China, we highlight the US, Japan, Korea as representative OECD countries which China aims to emulate in terms of innovation activity. The top graph for 1999 indicates that among 71 developing and developed countries China’s R&D intensity (around 0.8%) was relatively unremarkable, somewhat above countries at a similar level of devel-opment but certainly not an outlier.5 The graph for 2007 (for 74 countries) indicates that a mere 8 years later the picture has changed quite substantially, with R&D intensity at 1.5% equivalent to that in countries twice her average per capita income.
A second shift in China’s innovation activity can be seen in Table 1, where we report the above-mentioned share of national R&D expenditures accounted for by business enterprises, again for the years 1999 and 2007. As a means of comparison we provide data for a number of OECD countries as well as emerging economies, but (this is particularly important with regard to the ‘ranking’) the choice of countries covered is not meant to be representative of all OECD and/or emerging economies. In 1999, around half the R&D expenditure in China was accounted for by business enterprises, putting them toward the bottom of this group of 11 countries, alongside with Turkey, Argentina and Mexico. By 2007 the business share had risen to over 70%, thus placing China firmly in line with top OECD innovators such as Japan, Korea, the US or Germany. Note that with the exception of Mexico the figures for other emerging economies remained relatively stable over this time period.
In conclusion, whether or not this effort has resulted in a boost to domestic innovation (of the novel product type) the above numbers plot an impressive sea-change in China’s innovation activity between the late 1990s and the present day.
5We stress again that China’s development was unusual in that the R&D to GDP ratio was substantially higher during
the socialist period ending in the late 1970s. Although a relatively high level of innovative effort was maintained during the early 1980s the R&D to GDP ratio eventually came down to ‘standard’ developing country levels around the mid-1990s.
2.3 Patenting
The existing literature on patenting in China is surprisingly sparse. While there are some studies at the aggregate (Hu and Mathews, 2008), industry (Hu, 2010) and province level (Sun, 2000; Cheung and Lin, 2004; Yueh, 2009), there is little work at the firm-level (Hu and Jefferson, 2009). Moreover, the existing work at the firm-level relies on firms’ self-reported patents due to a lack of actual patent information (Hu and Jefferson, 2009). The existing literature, so far, has focused mostly on the effect of technology transfer on the performance of Chinese firms (Hu et al., 2005) as well as the patenting activity of foreign relative to domestic firms in China (Hu, 2010; Liang and Xue, 2010). The scarcity of empirical evidence on Chinese firms’ patenting activities at the firm-level stands in stark contrast to a vast literature on trade and FDI at the firm-level in China (e.g. Hu and Jefferson, 2002; Chuang, Y.-C. and Hsu, 2004; Girma et al., 2009; Hale and Long, 2011).
At theaggregate economy-levelHu and Mathews (2008) split the total number of USPTO patents by Chinese residents into different groups of patentees to show that the most dramatic surge in patenting with the USPTO occurred among private domestic companies since 2001 when China joined the WTO. Hu and Mathews (2008) also point to the significant contribution of public research institutes in increasing the number of USPTO patents held by Chinese assignees. The authors provide some evidence that USPTO patents held by private firms receive more forward citations and have more backward cites than those held by other groups, such as state-owned companies. The larger number of forward citations is interpreted as an indicator of a higher value whereas the higher number of backward cites is interpreted to indicate private companies’ superior ability to build on existing knowledge.
Hu (2010) analyzes patent data at theindustry-levelto investigate the strong increase in patent-ing by foreign firms in China, which amounted to over 30% per year between 1995-2004. Since Hu does not have patents matched to firm-level data, he relies on a concordance table produced by the OECD to allocate patents across industries. Using this concordance table, he finds ISIC 29 (machinery), 24 (chemicals), and 32 (telecommunications equipment) to have by far the largest number of patents in China. Patenting by foreign residents in China is found to be driven by import competition, that is, foreign patenting is positively correlated with the amount imported by China from technologically similar industries of other foreign countries. This finding is corroborated by the fact that over 90% of patent applications by foreign firms claim a foreign priority.
An early study on the spatial concentration of patenting by Sun (2000) investigated province-leveldata for 1985-1995 — the period before FDI or private enterprise made substantial impact on Chinese development in general and with regards to innovation activities in particular. It is thus not surprising that the output from collective and state-owned enterprises was found to be an important force in innovation output and overall the relative level of provincial development seeming to drive the empirical results.6 All R&D activity measured for this study was limited to universities and ‘government R&D institutes’, again a reflection of the scarcity of business enterprise R&D at the time. Employing provincial data from 1995 to 2000, Cheung and Lin (2004) find that by the late 1990s the presence of FDI can be found to have a robust positive impact on patenting by ‘domestic innovators’, with R&D inputs also positive and significant but export volumes insignificant.7 Yueh (2009) explores the determinants of aggregate patent counts across 29 Chinese provinces for the period 1991-2003 uncovering substantial differences in patenting activity across provinces, which is
6This is reinforced by the finding that export volumes seem to be a good predictor of patenting activity.
7At least parts of these stark differences between Sun (2000) and Cheung and Lin (2004) are down to the different
not surprising given the heterogeneity in economic progress between the Eastern Seaboard and the central provinces.
Finally, Hu and Jefferson (2009) conduct their analysis at thefirm-levelexploiting a large dataset assembled by the NBS and focusing on domestic patenting with SIPO during 1995-2001. The main limitation of the analysis is that only firms’ self-reported patent counts are available (see Section 4 for more details). Moreover, firms only report an aggregate patent count, not distinguishing between innovation, utility and design patents. Since only innovation patents require an examination by SIPO, utility and design patents are likely to protect innovations characterized by a lower inventive step and thus embody little technological progress. Hu and Jefferson (2009) explain the recent increase in firms’ patenting activity in China by the presence of FDI, the change in the patent law and the anticipation of China’s WTO accession in 2001. The authors also find the patents-R&D elasticity to be higher for domestic than for foreign-owned companies, which they explain by suggesting that foreign firms conduct R&D in China primarily to adapt existing products and patent existing inventions. In addition, Hu and Jefferson (2009) find the amendment of the patent law in 2000, which became effective only in 2001, to have had a major impact on patenting; yet, given that their sample extends only up to 2001, it remains unclear to which degree the year-dummy variable used to capture the reform reflects firms’ (lagged) response to the policy change.8
3 USPTO vs SIPO
This section examines differences between the patent systems in the US and China which may have implications for the ability and motivation of Chinese firms to seek patent protection in each country. Since our analysis focuses on invention (SIPO) and utility (USPTO) patents, our discussion here is limited to this type of patents.9 Sorell (2002), Yang (2008), and Lin and Connor (2008) offer detailed comparisons of the two systems where Yang (2008) particularly focuses on potential differences in the way domestic and foreign applicants are treated in both countries.
China’s first patent law came into force in 1985 and was since amended three times (in 1992, 2001, and 2009). Given that only the second amendment falls into the time period covered by our regression analysis, we omit a discussion of the other two. The second comprehensive amendment of the patent law, adopted on 25 August 2000 and effective from 1 July 2001, was necessary to bring China’s patent law in line with the WTO Agreement on Trade-Related Aspects of Intellectual Property Rights (TRIPS), which China adopted with WTO entry in November 2001 (Yu, 2001). For our purposes, an important change brought about by the amendment regards the deletion of the requirement to obtain official (government) permission before a Chinese resident is allowed to file for patent protection abroad.Another important change was equal treatment of state- and privately-owned companies as well as the introduction of preliminary injunctions in case of infringement.
Regarding the application process, a fundamental difference is the first-to-file rule applied by SIPO compared to the first-to-invent rule at the USPTO.10 In addition, the USPTO has a one-year grace period to determine prior art, i.e., an invention may still be patentable despite having been
8More generally, their analysis of innovation activity in private enterprises is somewhat hampered by the time period
under analysis, 1995-2001: it is argued elsewhere that many of the incentives for technology development and innovation were not extended to private enterprises and start-ups until 1999 (Naughton, 2007: 361), such that their analysis only captures one or two years of the ‘level playing field’ between state-owned and private enterprises.
9USPTO ‘utility’ patents correspond to SIPO invention patents and must not be confused with SIPO utility patents. A
SIPO utility patent is not subject to substantive examination.
10In the US, whoever demonstrates to have invented the invention first is entitled to the patent whereas in China, the
published for example in a trade journal during the 12 months preceding the patent application, while there is no such provision in China. Moreover, until recently, SIPO granted patents for in-ventions that were not necessarily ‘new-to-the-world’: before the third amendment to the Chinese Patent Law in 2009, Article 22.2 defined prior art excluding inventions known to the public or in public use outside of China. For example, while a patent publication in the US did represent prior art preventing the granting of a patent in China, if in contrast the invention had been known or used by someone other than the inventor (without obligation of secrecy) in the US, it would still have been patentable in China.
Yang (2008) points out that in the examination process, different emphasis is put on the ‘indus-trial applicability’ criterion. That is, whereas the USPTO has a broad interpretation of the potential practical purpose an invention might serve, SIPO requires some form of demonstrable industrial applicability. This is related to a broader issue regarding patentable subject matter. The US patent system has been criticized for allowing a broad range of inventions to be patented that may contain only limited technological advance, including software, business models and even DNA segments (Gallini, 2002; van Pottelsberghe, 2010). SIPO in contrast, applies a narrower definition of what constitutes patentable subject matter, more in line with the stance of the European Patent Office (EPO). There are also some differences in the legal provisions in case an application is rejected and the applicant wishes to request re-examination, but these appear to be of less relevance to our analysis and are therefore not discussed here. Similarly, there are considerable differences in patent enforcement and validity disputes between the US and China, which are not discussed here (for more details see Sorell, 2002). Of more direct relevance is the fact that the US does not require for-eign applicants to have a patent agent in the US, whereas SIPO requires forfor-eign applicants without residence in China to rely on a domestic patent agent designated by SIPO to handle the applica-tion process. Foreign applicants for patents in the US may nevertheless be compelled to rely on the services of a US patent attorney because there usually is a considerable amount of exchange of information between an applicant (or his patent attorney) and the USPTO during the examination process.
From an empirical point of view, Yang (2008) finds no difference in pendency between domestic and foreign applicants in the US and grant times to be shorter in China than the US (on average two as opposed to three years). In addition, she finds the ratio of grants to applications to be higher in the US than China, while the grant rate is considerably higher for domestic applicants in both China and the US.
The fee structure also differs between the USPTO and SIPO. In China, an application costs CNY 900 (The exchange rate between 2002 and 2005 is around US$ 1=8.27 CNY, so this amounts to around US$ 110), there is an additional examination fee of CNY 2,500 (US$ 300) and maintenance fees of CNY 300 (US$ 35) every five years. At the USPTO the basic application fee is US$ 330 and examination fees amount to US$ 220.11 At the USPTO, renewal fees are not payable annually: at 3.5 years, the maintenance fees due amount to US$ 980, at 7.5 years to US$ 2,480 and at 11.5 years to US$ 4,110.12 Additional costs for Chinese firms arise from the need to translate the patent application into English. If a Chinese applicant relies on the services of a US patent attorney, although not formally required by the USPTO, substantial additional costs arise. Hence, the numbers suggest that obtaining and maintaining patent protection in the US is considerablymore expensive in the US than China. However, the largest difference in the cost of obtaining patent protection in
11Fees for small firms are half the normal fee. See http://tinyurl.com/66xb774 (USPTO website). 12Small entities pay half the standard fee.
the US for Chinese firms stems from the need to translate the patent application and to potentially hire a US patent attorney who administers the patent application.
4 Data
A number of firm-level datasets have been used in the existing literature on innovation, R&D, and patents in China. Lin et al. (2010) use a cross-section of firms contained in the 2003 World Bank business environment and enterprise performance survey. A more comprehensive dataset for patent-ing analysis has been assembled by Jefferson et al. (2003) on large and medium sized enterprises for the period 1995-1999 from an annual survey conducted by the NBS and used in Hu et al. (2005) and Hu and Jefferson (2009). Hu et al. (2005) use a subset of about 10,000 companies from this dataset and Hu and Jefferson (2009) extend its coverage to the period 1995-2001, which yields about 22,000 firms.
With regard to patents, to the best of our knowledge, we are not aware of any existing large-scale dataset that contains actual patent holdings at the firm-level. Other studies on patenting in China have, for example, relied on industry-level patenting by employing a correspondence table that maps patents’ sectoral classification (IPC) into firms’ standard industrial classification (Hu, 2010).13 Hu and Jefferson (2009) use firm-level data, but patents are self-reported by firms and no distinction can be made between invention, utility and design patents. It is difficult to gauge how reliable firms’ self-reported patent counts are, but experience with similar data suggests very substantial, potentially non-random mis-reporting.14
The data used for our analysis consists of three components. The first component contains our firm-level information, the second component consists of USPTO and SIPO patent data and the third component is a ‘bridge’ that links the firm-level data with the patent information. These three components are discussed in turn below.
4.1 Firm-level Data
Our firm-level data come from China’s Annual Survey of Industrial Enterprises (ASIE) compiled by the NBS. Firms contained in ASIE include the whole population of state-owned firms as well as all non-state-owned companies with annual sales above CNY 5 million (around $600,000). On average, more than 200,000 firms are included each year and they account for around 95% of total Chinese industrial output and 98% of industrial exports, covering 39 two-digit industries, of which 30 belong to manufacturing industries, spread across all 31 provinces and municipalities.
The available data cover the period 1999-2006, including more than 2 million observations from about 590,000 firms.15 The key variables relevant to our study include a unique firm identifier, R&D expenditure (limited coverage), exports, type of ownership registration, the structure of paid-in capital distpaid-inguished by paid-investor types (government; foreign paid-investors excludpaid-ing Hong Kong,
13The International Patent Classification (IPC), established by the Strasbourg Agreement 1971, provides for a
hierarchi-cal system of language independent symbols for the classification of patents and utility models according to the different areas of technology to which they pertain (WIPO, 2011).
14For example the UK Community Innovation Survey 3 (2001) contains the following question ‘How many patents, if
any, did your enterprise apply for during the period 1998 to 2000?’ The question refers to a three-year range, which makes it difficult to allocate patents into specific years to match annual firm-level data. In any case, cross-checking firms’ responses to this question with their actual patent holdings indicates that only about 30% of firms that report to have applied for a patent actually did so.
15Other previous studies using different versions of this dataset include Brandt et al. (2011), Girma et al. (2008),
Macao, and Taiwan; investors from Hong Kong, Macao, and Taiwan; legal entities; individuals; and collective investors), output, sales, employment, fixed assets, and industry affiliation.16
4.2 Patent Data
The patent data come from the European Patent Office’s (EPO) Worldwide Patent Statistical Database (PATSTAT) version October 2010.17 We extract patents filed by Chinese residents at the US Patent and Trademark Office (USPTO) and those published directly by the State Intellectual Property Office of China (SIPO).18Our analysis focuses on the application date of a patent. However, patent data are only visibleaftera patent has been published which implies that although we use the application date, our sample of patents is limited to patents that have already been published. Given the usual 18-month delay between application and publication date at both USPTO and SIPO,19this implies that we have patent data up to March 2009 at best. This is not restricting our analysis given that our firm-level data is only available to 2006.20
4.3 Matching
Due to the absence of a unique identifier shared by the firm-level and patent data, the main problem in constructing our dataset consists in matching patents to firms. This is generally challenging for a number of reasons outlined in detail in Helmers et al. (2011). However, in the case of Chinese firms and patents, it is even more difficult because of the different ways in which Chinese firm names can be recorded: (a) using Chinese characters, (b) using pinyin transcription into the Latin alphabet, (c) a translation of the Chinese names into English, and (d) any mix of (a)-(c).
The Chinese census data contain only (a) firm names using Chinese characters whereas PATSTAT contains (b), (c) and (d). In principle, this means that in order to match patents to firms, we would have to either transcribe firms’ names contained in the ASIE census or the assignee names contained in PATSTAT. We have opted for an alternative solution: the Oriana database provided by Bureau Van Dijk Electronic Publishing (BvDEP) offers a firm-level dataset reporting balance sheet and profit & loss information for individual companies in countries in the Asia-Pacific region.21 The Oriana version available to us contains firm-level data for about 23,000 Chinese firms for the period 2000-2005. The advantage of using Oriana is that it reports firm names using the Latin alphabet as well as firms’ unique identification number. This allows us, on the one hand, to link Oriana to the census through the unique identifier and on the other, to use Oriana firm names to match with assignee names contained in the patent documents. Note that we only use Oriana to bridge the census and patent datasets. Oriana’s coverage of firm-level variables is far less comprehensive than the ASIE
16All variables are available for all years except R&D expenditure, which is only reported for the years 2001, 2002,
2005, and 2006.
17PATSTAT combines patent information from several sources: DocDB (the EPO master bibliographic database
contain-ing abstracts and citations), PRS (the patent register for legal data), EPASYS (the database for EP patent grant procedure data), and the EPO patent register as well as the USPTO patent database for names and addresses of applicants and inventors.
18This includes patents filed with the World Intellectual Property Organization (WIPO) through the PCT route. 19The USPTO may not automatically publish an application 18 months after its priority date if requested by the applicant
providedthe invention disclosed in the application has not and will not be the subject of an application filed in another country or under a multilateral international agreement, that requires publication of applications eighteen months after filing (35 U.S.C. 122(b) and §1.211). Hence, if a Chinese applicant patents an invention with the USPTO that he also patents with SIPO, the application will be published within 18 months
20Note that we have patent data since 1985, but firm-level information is only available since 1999. The patent data
preceding 1999 is used in our descriptive analysis as well as to construct patent stocks.
data; for example, Oriana does not report firms’ R&D expenditure nor ownership structure (in terms of paid-in capital contributed by different types of investors following Guariglia et al., 2011).
While this approach allows us for the first time to match patent data to Chinese firms, it also has some limitations. First, Oriana only contains a subset of the firms contained in the census. However, given that Oriana is a subset of ASIE, we can test for differences between the distributions of our variables of interest between Oriana and the full ASIE sample (see Section 4.4). Second, names in PATSTAT as well Oriana might nevertheless differ according to whether names have simply been transcribed using pinyin or (partly) translated. The main challenge in matching the two datasets, therefore, consists in creating an automated matching algorithm that copes with this difficulty as manual matching is unfeasible due to the large number of Chinese patents. Due to the similarity of firm names,22 probability-based matching does not seem appropriate in the present context due to the relatively higher risk of obtaining a large number of ‘false positive’ matches, i.e., patents erroneously matched to firms.23 Instead we clean and standardize firm names in both datasets to a maximum possible to avoid the occurrence of ‘false negatives’. We also cross-check matched USPTO and SIPO patents using ‘equivalents’: we verify whether for example a given matched USPTO patent has a SIPO equivalent for the same innovation to ensure that the SIPO equivalent is allocated to the same company.24 In addition, in the case of USPTO patents, we checked all matched and unmatched firms manually. Due to the dramatically larger number of SIPO patents, we only checked a subsample of matched and unmatched patents.25 In case we found ‘false negatives’, we amended the corresponding standardisation code of our matching algorithm in order to ensure our match is easily reproducible.26 An Appendix explains the matching algorithm in more detail (see also Table 3).
4.4 Data Cleaning
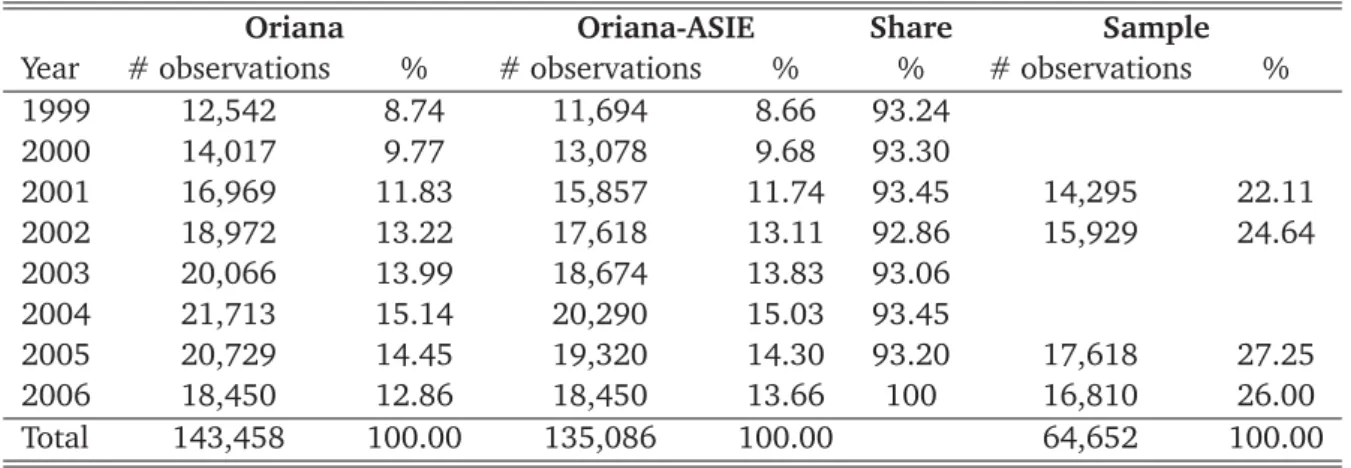
The merged ASIE-Oriana sample contains 143,458 firm-year observations from 23,915 individual firms spanning the period of 1999-2006. There are 1,467 firms that are contained in Oriana but not in ASIE with most of these firms in non-manufacturing industries. For these firms, we only have information in the period 2000-2005, hence, they enter the sample only in 2000 and drop out in 2006. Given that Oriana provides only a limited a number of variables, for example it does not contain R&D expenditure, we dropped firms not covered by ASIE from our sample. This leaves a sample of 135,086 observations from 20,448 firms. We clean the dataset further by dropping firms in non-manufacturing industries contained in ASIE (two digit GBT code >43 or<13). Given the importance of innovation effort for patenting, our regression analysis is constrained by the R&D expenditure measure which is only available in four years, namely 2001, 2002, 2005 and 2006. The sample used in the regression analysis therefore contains 64,652 firm-year observations from 19,956 firms (see Table 2). All variables employed in the regression analysis are discussed in detail in Section 5 below. Note that for our descriptive analysis of patenting in Section 6, we make use of
22Chinese firm names frequently contain the city or province in which the firm is located. Furthermore, detailed
description of the firm status (co. ltd. is often written out in detail asyouxian gongsior evenyouxian zeren gongsi) adds to the sense of similarity. Finally, the Chinese language only contains around 400 syllables which further hinders reliable matching by name.
23See Thoma et al. (2010) for a recent review of probabilistic matching.
24We verify whether the equivalent found in this way contains the same assignee name as the matched patent. 25In the case of USPTO patents, this meant searching for approximately 1,370 unmatched assignee names manually
in Oriana and in the case of SIPO patents, we searched for about 10% of the approximately 22,500 unmatched Oriana names among the approximately 145,000 unmatched SIPO assignee names.
the entire data span for which we have patent data which covers the period 1985 to 2006.
Finally, in order to verify potential sample selection issues due to the use of ASIE companies that are contained in Oriana, we ran some empirical tests to analyse the differences between the wider ASIE sample excluding firms in our sample (around 780,000 observations) and the ASIE-Oriana sample (around 65,000 observations). The results are summarised in Table TA-VI.
5 Empirical Strategy
In the present paper we investigate two main research questions employing our integrated dataset: (i) ‘What drives the recent ‘explosion’ in patent applications from firms registered in China?’ (
Q1
: patenting versus not patenting), and (ii) ‘Are there any differences in the determinants of Chinese firms’ patent productivity between the US and China?’ (Q2
: patenting productivity). We will endeav-our to provide support for the results from the descriptive analysis in Section 6 through a number of alternative empirical models.We begin with the patenting question,
Q1
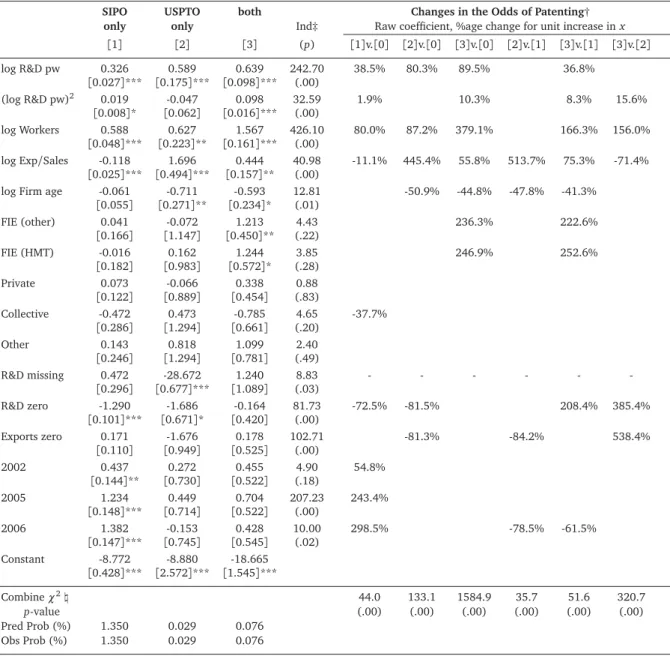
, whereby we essentially disregard the number of patents taken out by a firm and focus merely on the prevalence of patenting. We first employ a multinomial logit model, which allows us to analyse the ‘discrete choice’ over patenting alternatives (do not patent, in China/US only, in both countries — the former is the omitted alternative in the re-gression) and to investigate the firm characteristics that influence this choice across the alternatives (Agresti, 1990; Cameron and Trivedi, 2005). Following estimation we evaluate the model by com-paring predicted and empirical frequencies across alternatives, by investigating the null hypothesis that coefficients for each covariate are zero across all four alternatives and furthermore by analysing LR tests for combination of alternatives (i.e., asking for instance whether we can combine the ‘patent in China only’ with the ‘patent in both China and the US’ alternative). Finally we interpret the results using percentage changes in the odds across different alternatives.27 In this and all of the following empirical models we use a standard set of characteristics/determinants — see below for a detailed discussion of these covariates.Next we employ abivariate probit modelto analyse two dichotomous outcomes, namely patent-ing with USPTO and patentpatent-ing with SIPO. The joint outcomes can then be analysed uspatent-ing a simple correlation coefficient (ρ) between the two outcomes; the statistical significance of ρ may either reflect the jointness of the decision to patent in both countries or unobserved factors common to both decisions (Anand and Khanna, 2000), i.e., model misspecification. Furthermore we test the hypothesis that separate probit models fit the data better than the joint model and conduct param-eter homogeneity testing across the two equations, which can potentially indicate differences in the impact of covariates on the patenting decision. Perhaps the most interesting element of the bivari-ate probit analysis is the visual comparison of predicted probabilities: here we first compute the predicted probabilities for each of the four possible outcomes28and then plot them against various covariates of interest (firm size, export-sales ratio, firm age) using fractional polynomial regression to indicate the general tendency. Our focus here is on the firms which only patent in China
con-27The interpretation of these results is as follows: by how many percent will the odds of having a patent alter when
increasing thexvariable by one unit. The comparison with the omitted base outcome ‘no patent’ can just be interpreted as simple changes in the odds for a unit increase in the covariate, whereas in the comparison of the alternative outcomes the percent changes are relative. This multinomial logit analysis is conducted making extensive use of the routines and examples provided in Long and Freese (2006).
trasted with those which also patent in the US.29 We further provide a set of descriptive statistics relating to firm characteristics and sectoral characteristics of the observations making up the four different outcomes.
A final set of results then moves on to analyse patenting productivity,
Q2
, usingcount data models by estimating standard patent production functions which relate the patentcount(the ‘product’) to a vector of firm-level characteristics (the ‘inputs’). In a singlecross-sectionthe work by Bound et al. (1984) provides a comparison of multiple empirical implementations using OLS, Poisson, Negative Binomial and Nonlinear Least Squares. In empirical practice the choice between these different approaches is primarily driven by the well-known ‘overdispersion’ problem for the Poisson estimator (e.g. Cameron and Trivedi, 2006; Hilbe, 2011), which represents a violation of the assumed equality between mean and variance of the count variable.30More recent applications have further concerned themselves with the issue of ‘excess zeros’ in count data, although this phenomenon is intimately linked to overdispersion given that both may arise from unobserved heterogeneity (Cameron and Trivedi, 2006). In order to distinguish the ‘in-novating firms’ which chose not to patent in year t from firms which never innovate and therefore never patent (these are labelled ‘certain zeros’) ‘zero-inflated’ versions of the Poisson (ZIP) and Neg-ative Binomial (ZINB) estimators (Lambert, 1992; Winkelmann, 2003) first estimate a nonlinear (logit or probit) model for ‘certain zeros’ and then analyse those observations which are predicted not to be ‘certain zeros’ in a count regression model (Poisson or Negative Binomial).31 Since the estimation approach is maximum likelihood-based each of the two steps is iterated until the respec-tive ‘best fit’ is achieved. In the present data context the large number of zero patents and thus the use of the ‘zero-inflated’ versions of count data estimators is arguably more important than in the standard approaches using US or OECD data (Hu and Jefferson, 2009): for the USPTO data we have a mere 68 non-zero observations (0.11% of the sample), whereas for the SIPO data the figure is 922 (1.43%). Given the uncertainty over any differences in the determinants of the patenting decision (‘inflation’ equation) and the patenting productivity (‘count data’ equation) we follow the standard in the literature by includingthe same covariates in both equations (Lambert, 1992; Winkelmann, 2003).
In a panel context the standard count data modelling approach is to follow Hausman et al. (1984) by adopting a fixed or random effects Poisson regression, rather than the above ‘cross-section’ estimators, since the former allow for unobserved time-invariant heterogeneity. In the present case of China, however, the use of dedicated panel estimators accounting for unobserved heterogeneity at the firm-level would dramatically reduce the sample size, since only firms with at least one patent over the sample period could be considered. We therefore treat our panel as repeated cross-sections, in the spirit of previous work on China by Hu and Jefferson (2009).
We follow the suggestion in Trivedi and Munkin (2010) and employ a number of diagnostic tools to compare ‘fit’ across different empirical count models. Prime amongst these is a frequency comparison for 0 to 9 patents between the various count regression models and the observed em-pirical frequency. Furthermore we employ a number of formal ‘goodness-of-fit’ tests and statistics, including Greene’s (1994) variant of the Vuong (1989) model comparison test (Poisson vs. ZIP,
Neg-29Note that using data for firms thatonlypatent in the US reduces the sample to a handful of firms.
30Overdispersion is manifest in many count data models whereby the variance of the count variable is often substantially
larger than its mean.
31Note that the inflation model defines the logit regression in reverse (‘certain zero’=1, not ‘certain zero’=0) to a
standard logit model (no patent=0, some patents=1), such that we can expect the reverse signs in the former compared with the latter.
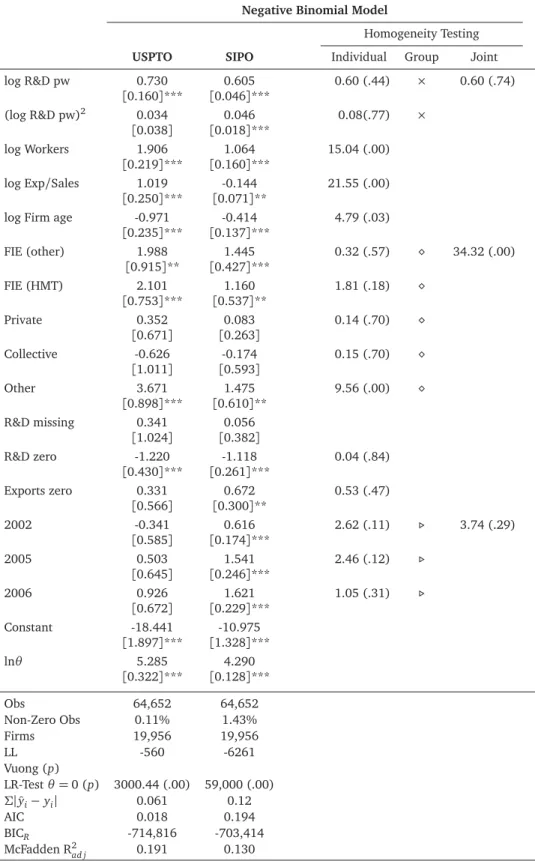
Bin vs. ZINB), as well as various information criteria discussed in Long and Freese (2006). Patent production function results for SIPO and USPTO patents are relegated to a technical appendix — in the main section we present our preferred estimates from the Negative Binomial model, where we estimate the equations for USPTO and SIPO in a seemingly unrelated regression (SUR) framework. This allows us to conduct parameter homogeneity tests across models akin to the analysis in the bivariate probit model (we refer to this as ‘correlated NegBin’).
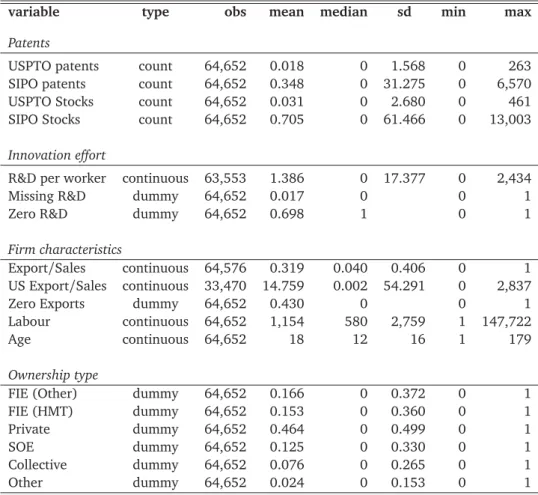
In the following we briefly discuss the choice of covariates employed in the empirical analysis. The firm-level characteristics considered in this analysis follow the suggestions in Hall and Ziedonis (2001), namely measures for R&D expenditure (innovation effort), firm size, firm age, as well as some characteristics with particular relevance for China, namely firm ownership type and export orientation (export-sales ratio). We employ R&D expenditure deflated by employment (in logs), adding a dummy variable for firms with no data on R&D expenditure (about 1.7% of observations) and a dummy for firms with zero R&D expenditure (about 70% of observations); in both cases we set logR&D per worker to zero. We chose this specification to avoid confounding the R&D effect with that of the size of the firm (Hall and Ziedonis, 2001), which is measured by employment (in logs) and meant to capture possible economies of scale in the production of patents. Log R&D expenditure per worker is entered as linear and squared terms to allow for firms at different tails of the distribution to impact patenting decisions and patent count differentially. Firm age is computed from data on the year the company was founded. In an OECD country context this variable is intended to capture the experience of older firms in the management of the patent application process (Hall and Ziedonis, 2001), however in a China emerging from a planned economy, this is an indicator for state-owned enterprises founded during the socialist period prior to 1978 and this variable therefore indicates a socialist period legacy. Ownership types include private enterprises, as well as two types of foreign-invested enterprises (FIEs) in a distinction which is commonly made between those from Hong Kong, Macao and Taiwan (HMT) and from elsewhere (other). We further distinguish Private, State-Owned (SOEs), Collective and Other firms, whereby our designation is based on the proportion of paid-in capital in excess of 50%, following Guariglia et al. (2011). Given China’s strong reliance on manufacturing for export we include export orientation constructed as annual export value over total sales in our regressions. With the exception of dummy variables all of the above are in logarithms. Finally, we add year dummies to all our models which will allow us to chart the increase in patenting both with USPTO and SIPO, accounting for any unobserved effects that impact all firms in our sample such as the 2001 amendment to the Chinese patent law.
Note further that our empirics concentrate primarily on ‘consistency’ (in the plain English sense of the word) in the sign and statistical significance of these covariates across the different empirical models tested. In all empirical models we cluster standard errors at the firm-level.32
6 Descriptive Evidence
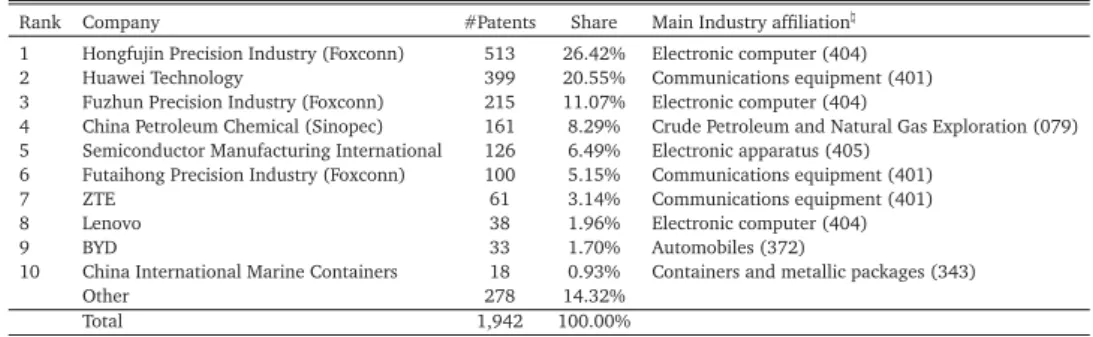
Tables 4 and 5 list the Top 10 companies patenting with the USPTO and SIPO respectively. These tables are constructed using the entire integrated dataset to provide as complete a picture as possible and are thus not restricted to firms and industries included in the regression sample.
Table 4 illustrates the strong concentration of USPTO patents in the hands of very few compa-nies: the top 10 assignees account for over 85% of all USPTO patents. Interestingly, three companies,
32Note that most of the diagnostic tests carried out, however, have to be constructed from the standard regression
Hongfujin (1), Fuzhun (3) and Futaihong (6), are subsidiaries of the same Taiwan-owned multina-tional company Foxconn Technology Group that is the world’s largest contract manufacturer in 3C (Computer, Communication, Consumer electronics) products. For example, Hongfujin was founded by Foxconn in Shenzhen in 1998, mainly producing high-tech key components and system products for companies such as Apple, HP, Dell, Cisco, IBM, and Acer. Some of the most renowned prod-ucts they make/assemble include Apple’s iconic ipod , iphone and ipad. In 2006, Hongfujin earned nearly US$ 20 billion and employed around 20,000 workers in Shenzhen. Similarly, Fuzhun and Futaihong were also established by Foxconn in Shenzhen in 1998 and 2002, respectively. Fuzhun’s main products include computer equipments such as heat sinks and coolers, supplying consumer electronics giants such as Sony, Fujitsu, Siemens, and Samsung. Futaihong specialises in wireless communication equipment for clients such as Nokia and Motorola. These three Foxconn subsidiaries account for around 40% of total USPTO patents, and with Huawei these four companies alone ac-count for over 60% of USPTO patents in our matched dataset. As shown in the last column of Table 4, with the exception of Sinopec, China International Marine and BYD, all Top 10 USPTO companies are in the 3C industry (with 2 digit GB/T industry code 40).33 Table 5, shows a similar picture for SIPO patent holdings with the top 10 companies accounting for about 75% of all patents. In the case of SIPO patents, the dominant player is Huawei, which holds more than a third of SIPO patents, whereas only one Foxconn company, Hongfujin, is among the Top 10. Similarly to the USPTO Top 10, with the exception of Sinopec, BYD and Baoshan Iron & Steel, all companies listed in Table 5 are in the electronics/communications equipment industry. Note that there is a significant overlap of companies in Tables 4 and 5; six companies appear in both lists, with four of these in 3C industries. It is also noteworthy that these top patenting companies are very large and most of them highly export oriented. Going through the profiles of the companies listed in Tables 4 and 5, we find that, apart from two companies (LG Shanghai and Inventec) in Table 5, all companies employ more than 3,000 workers, with some gigantic companies such as Sinopec, Baoshan Iron & Steel and Huawei employing more than 100,000 workers. It is also not very surprising that most of the firms turn out to be heavily engaged in exporting. According to the Ministry of Commerce, except for three companies (BYD, LG Shanghai and Fuzhun), all of the companies in Tables 4 and 5 are among the top 100 Chinese exporters in 2006.34 Indeed, two Foxconn companies, Hongfujin and Futaihong are ranked 1st and 8th largest exporter respectively in China, with export revenues around US$ 18.4 billion and US$ 4.7 billion in 2006. Huawei is ranked 17th with an export revenue of nearly US$ 3 billion, whilst Lenovo and Sinopec are ranked 12th and 15th with export revenues of US$ 3.9 and US$ 3.1 billion, respectively.
To summarise, Chinese companies’ patents in China and especially in the US are highly concen-trated in a handful of very large, highly export-oriented firms in the computer, communication and consumer electronics industry. In particular, Taiwan-owned contract manufacturer Foxconn emerges as a major player in patenting with the USPTO, whilst two indigenous firms Huawei and ZTE play a leading role in domestic patenting.
Apart from asking who patents, the question of what is patented is equally important. We classify USPTO and SIPO patents according to the type of innovation that they protect:35 product
33Apart from the three Foxconn subsidiaries, the other four companies in the 3C industries are Huawei, ZTE, SMI, and
Lenovo.
34See “China’s top 200 exporters 2006” available at http://zhs.mofcom.gov.cn/aa/aa.html.
35We read each patent’s claims to determine whether it protects a product or process innovation or both. We thank Max
or process innovation or a combination of both.36 In the case of USPTO patents, we read all 1,912 patent documents, whereas in the case of SIPO patents we rely on a subsample of 980 patents due to the fact that claims are not readily available but must be retrieved from the original patent documents which are available only in Chinese. Table 6 shows a breakdown of USPTO and SIPO patents according to the innovation type that they protect. For USPTO patents, Table 6 shows that nearly half of all patents filed by Chinese residents cover product innovations. Only about 20% of patents cover process innovations. The pattern looks different in the case of SIPO patents (excluding USPTO equivalents): nearly 37% of patents protect process innovations and slightly less than 30% cover product innovations. The share of patents protecting both product and process innovations remains approximately the same as for USPTO patents. The last two columns of Table 6 show the distribution of innovation type when we add USPTO equivalents to the SIPO patents.37 We use sample weights in computing shares to reflect the small proportion of SIPO patents with USPTO equivalents (2.5%) among all SIPO patents. The results change very little relative to the distribution when looking only at SIPO patents. In brief, Table 6 suggests that inventions that are patented in China but not simultaneously in the US are more likely to protect process innovations. With regard to USPTO patents, the results indicate that the share of patents protecting product innovations is in fact substantial. The list of such USPTO ‘product patents’ included in our sample covers a wide range of innovations. It includes low-tech products such as a ‘computer enclosure’ (i.e., a metal box) or a ‘refrigerator with a foldable table’ (i.e., an almost standard refrigerator that can be (mis)used as a table); the list also includes a relatively limited number of potentially more valuable product innovations such as a hydrocarbon conversion catalyst, fuel cells, or a foldable mobile telephone (this was in fact novel in 2004 which is the patent’s priority year). Nevertheless, in our reading, product innovations covered by USPTO patents are mostly related to mechanical innovations related to the ICT equipment industry embodying relatively modest innovative content. In contrast, USPTO patents covering processes/methods and the combination of process & product innovations appear to be of more innovative character. The overwhelming share of these patents protect ICT-related innovations, such as central process units or data processing/transmission methods. When we look at the inventive content of SIPO patents, a somewhat similar picture emerges despite the difference between USPTO and SIPO patents in their relative shares of product and process innovations. SIPO patents protecting product innovations are also mostly related to mechanical inventions in the ICT equipment industry, covering inventions such as a ‘turbofan for air conditioner’ (i.e., a fan). At the same time, SIPO ‘product patents’ appear to cover a wider range of products including steel and rubber products, pharmaceuticals (especially related to traditional Chinese medicine), and foodstuff. Similar to USPTO patents, it appears that process patents and those protecting both products and processes related to the ICT sector are of more innovative character.
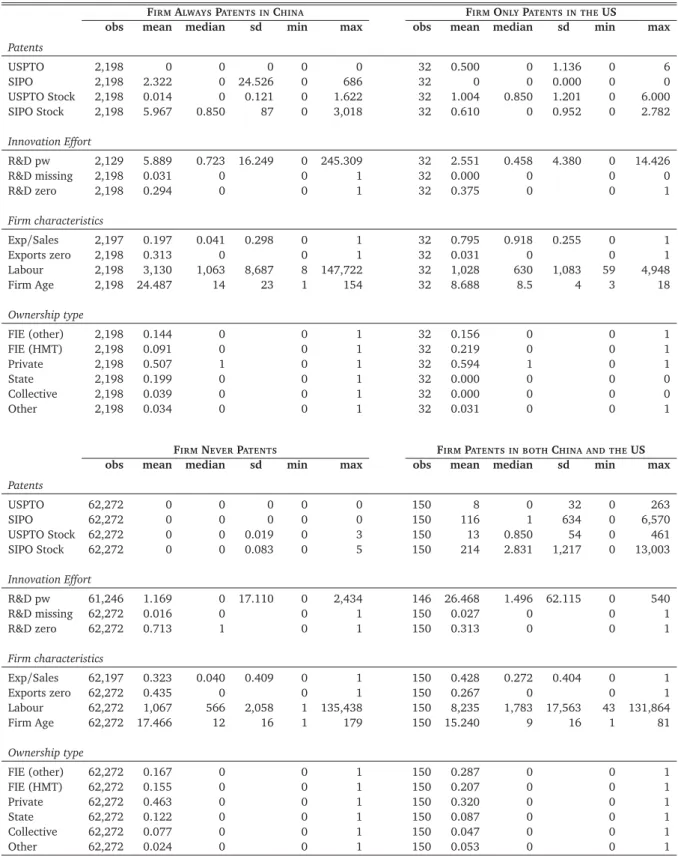
Finally, Tables 7 and 8 contain information on the sample of firms used in our regression analysis. As previously discussed, due to the limited availability of R&D data, the sample collapses to about 64,500 firm-year observations. Table 7 provides some basic descriptive statistics regarding firms’ patenting activities. The table shows the patent explosion for both USPTO and SIPO patents. The number of USPTO patents increased from 18 to 716 whereas SIPO patent filings increased from 780 to over 11,300 between 2001 and 2006. The table underscores our findings from Tables 4 and 5,
36An example for a product innovation is a chemical compound whereas a process innovation protects for instance the
method to produce the compound. This example also illustrates how a patent can protect both a product and process innovation: it covers both the compound and its production method.
37This means we add those USPTO patents that have a SIPO equivalent for which we have not examined the claims.
that is, the overwhelming share of patents is filed by companies in the ICT equipment industry where few companies account for most patents as indicated by the standard deviation and maximum. Table 8 offers descriptive statistics for the variables used in our regression analysis which is discussed next in Section 7.
7 Results
It should be noted from the onset that the present data poses fundamental challenges to the empiri-cal estimators typiempiri-cally employed in patent decision and patenting productivity analysis: in particu-lar for the analysis of USPTO patents, where we only have a minute share of firm-years which have non-zero observations (amounting to 0.11% of observations). We rely in parts on the predictive power of the models (compared with the true outcomes observed) and employ various tests and robustness checks. Specifically in order to address the low share of non-zero observations we em-ploy ‘rare events’ methods (King and Zeng, 2001a,b) in a technical appendix and find no evidence to suggest that our models investigating the patenting decision (
Q1
) are substantially distorted by this data property. In order to address the same issue in the patenting productivity analysis (Q2
) we employ a number of ‘zero-deflated’ count regression models which in terms of diagnostics however seem to be somewhat inferior in to the Negative Binomial model presented below (in the ZINB case this is inferiority is arguably marginal). All of our empirical analysis is, therefore, in the spirit of trying to paint a broad brush picture of the differences in the patenting decision and factors that seem to correlate with high patenting count arising from all the below regressions whilst not relying too heavily on any single empirical method employed.7.1 Patenting decision
We begin our discussion with the empirical results for the patenting decision,
Q1
, for which we provide analysis from a multinomial logit model in Table 9 and from a bivariate probit model in Table 10, together with plots for predicted probabilities and various descriptive statistics in Figure 2 and Tables 11 and 12.Table 9 shows estimates for patenting in China only (column [1]), in the US only ([2]) and in both countries ([3]) in comparison to the omitted reference alternative not to patent at all. The predicted probabilities for each of the three alternatives, presented at the bottom of the ta-ble, are close to the observed probabilities while the tests for combination of any of the above categories/alternatives, also presented toward the bottom of the table, rejects in all cases at the 1% level of significance — this provides some indication that we can distinguish these alternatives empirically and that the empirical model has a certain goodness of fit. The independence tests pre-sented in the column to the right of the three equation results suggest that with the exception of firm-ownership none of the covariates are zero across all three equations, thus indicating our set of covariates has explanatory power in the patent decision analysis. In the right half of the table we present the percentage changes in the odds by moving between groups — here we only present results for differences between alternatives which are statistically significant at the 10% level. As we will show below, the group of firms patenting with ‘USPTO only’ is very small whilst merely ac-counting for a handful of patents. We therefore focus primarily on the results comparing the groups of firms patenting in China only and patenting in both China and the US ([3]vs. [1]).
expenditure has a consistent positive effect on patenting, convex with regards to the ‘SIPO only’ and ‘both’ alternatives, thus suggesting that firms with very large R&D intensity populate both of these groups. The relationship seems much stronger for the group of firms that patent in both China and the US, as is also confirmed by our ‘Changes in the Odds’ analysis. Firm size seems to boost patenting propensity in all three groups. Export intensity has a particularly divisive effect, whereby firms with higher export-sales ratio have a higher propensity to patent in the US — whether they also patent in China or not. A doubling of the export-sales ratio implies a 75% increase in the odds to patent in both countries relative to in China alone. Focusing just on the firms which exclusively patent in China, a doubling of the export-sales ratio will reducethe odds to patent by 11%. With regards to firm age it can be seen that older firms are less likely to patent in the US. Finally, while the patent explosion is clearly discernable for the ‘China only’ group the difference to the bulk of the remaining firms which dopatent (most of which are contained in the ‘both’ group) is not found to be statistically significant at the 10% level except for the final year.
A first tentative conclusion from this analysis is that differences in the R&D intensity, firm age and in particular export intensity seem to drive firm’s decisions to patent abroad vis-à-vis exclusively in China. Surprisingly, firm ownership as defined here does not seem to have any discernable impact on the patenting choice.
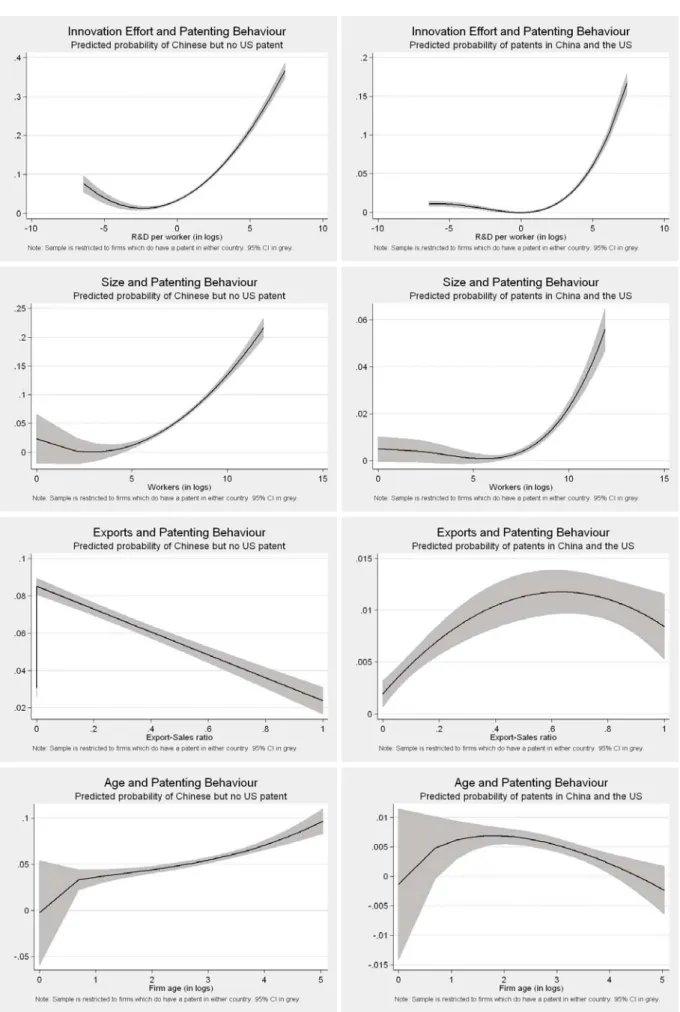
Table 10 reports results for a bivariate probit regression, analysing the patenting decisions of firms (simple dummy variable) in a joint empirical model. For the USPTO equation we have around 0.11% of observations with patents, for the SIPO equation around 1.43%. With regard to the regres-sion results, we limit ourselves to discussing the signs and statistical significance of covariates, as well as the result from cross-equation parameter homogeneity tests. The latter are carried out both for individual variables (column marked ‘Indiv.’) and groups of variables (‘Joint’, with the symbols indicating variable groupings). We furthermore compute predicted probabilities and correlate these with some of the key covariates of interest, using nonlinear (fractional polynomial) regression (95% confidence intervals are indicated): this analysis is presented in Figure 2, where the left plot always refers to the predicted probability of patenting only in China, whereas the right plot refers to the predicted probability ofalso patenting in the US. In all plots we limit the analysis to firms which do have a patent in either China or the US — results are much more precise if we used the entire sample of firms but we prefer to compare firms thatdo patent to highlight the difference in their characteristics.
Analysing the results in some more detail, a test for independence between the two probit equa-tions rejects emphatically, indicating a high level of correlation between the decision to patent in the US and in China. Parameter homogeneity tests indicate a marginally significant difference in R&D intensity (R&D expenditure per worker, in logs, and its square term) between the USPTO and SIPO patenting decisions, with both indicating a statistically significant positive and convex rela-tionship. As the first row of plots in Figure 2 indicates this is a minor difference in the shape of the innovation effort-patenting relationship between the ‘SIPO only’ and ‘both countries’ groups. For firm size (workers, in logs), we find an increased propensity to patent with size in both equations, although more so for the USPTO equation, hence the rejection in the parameter homogeneity tests — as our second set of plots in Figure 2 indicates this is again a minor difference in degrees, rather than a fundamental difference between the two patenting decisions. The results with regard to export orientation are much more pronounced: the bivariate probit coefficients are negative signif-icant for SIPO and positive significant for USPTO. The suggested importance of export orientation for the patenting decision is illustrated rather starkly when we compare the predicted probabilities