$Q\FRUUHVSRQGHQFHFRQFHUQLQJWKLVVHUYLFHVKRXOGEHVHQWWRWKHUHSRVLWRU\DGPLQLVWUDWRU WHFKRDWDR#OLVWHVGLIILQSWRXORXVHIU
2SHQ$UFKLYH7RXORXVH$UFKLYH2XYHUWH2$7$2
2$7$2 LV DQ RSHQ DFFHVV UHSRVLWRU\ WKDW FROOHFWV WKH ZRUN RI VRPH 7RXORXVH
UHVHDUFKHUVDQGPDNHVLWIUHHO\DYDLODEOHRYHUWKHZHEZKHUHSRVVLEOH
7KLVLVYHUVLRQSXEOLVKHGLQ
7RFLWHWKLVYHUVLRQ
an author's https://oatao.univ-toulouse.fr/24308
Grébert, Arnaud and Jamme, Stéphane and Bodart, Julien and Joly, Laurent LES analysis of the influence of micro vortex generators geometry and position on the control of shock wave/ boundary layer interaction. (2019) In: 11th International Symposium on Turbulence and Shear Flow Phenomena (TSFP11), 30 July 2019 - 2 August 2019 (Southampton, United Kingdom).
LES ANALYSIS OF THE INFLUENCE OF MICRO VORTEX
GENERATORS GEOMETRY AND POSITION ON THE CONTROL OF
SHOCK WAVE/BOUNDARY LAYER INTERACTION
Arnaud Gr ´ebert1, St ´ephane Jamme1∗, Julien Bodart1and Laurent Joly1
1: Department of Aerodynamics and Propulsion (DAEP) ISAE-SUPAERO, University of Toulouse
10 Avenue ´Edouard Belin, 31400 Toulouse, France
∗email: [email protected]
ABSTRACT
We investigate in this study how the heighthand dis-tance to the interactiondof microramp vortex generators (mVGs) placed upstream of a shock wave/boundary layer interaction (SBLI) may influence the efficiency of such pas-sive devices in controlling the unsteady mechanisms and shock-induced separation suffered by this kind of flow con-figuration. To this end, high-fidelity Large Eddy Simula-tions (LES) are carried out on four different micro-vortex generators geometries in order to assess the effectiveness of low-profile microramp vortex generators (h<0.4δ) and
medium size devices (0.5δ <h<0.8δ) to alleviate the detrimental unsteadiness of SBLI, see Panaras & Lu (2015). All computations are performed at the same flow conditions as in the experiment of Wanget al. (2012) with a free-stream Mach number ofM=2.7 and a Reynolds number ofReθ =3600. The medium size microramps are found to generate the shedding of large scale structures in their wake triggering a high-frequency unsteadiness in the flow, two or-ders of magnitude higher than the low-frequency unsteadi-ness related to the reflected shock foot motion and leaving it unaffected in terms of frequency content. This family of medium size micro-vortex generators is however shown to significantly reduce the area of the separated region induced by the SBLI, as well as the pressure loads intensity on the wall surface. These improved performances come with very limited drag penalty. On the contrary, low-profile devices do display any significant change in the SBLI features.
INTRODUCTION
Shock-boundary layer interaction is a common feature of high-speed aeronautical flows. With the aim of simpli-fying complex industrial configurations, the interaction of an oblique shock wave impinging on a turbulent boundary layer (TBL) developing over a flat plate has been the fo-cus of many fundamental studies in the past decades (see Clemens & Narayanaswamy (2014) for a review). This flow configuration is known to give rise to a separation bubble that exhibit low-frequency streamwise oscillations around StL=0.03 (a Strouhal number based on the separated re-gion length). Because these oscillations yield wall pressure or load fluctuations, efforts are made to reduce their ampli-tude using control devices such as passive microramp vortex generators.
In order to evaluate the potential of this kind of
ap-proach, we have performed large eddy simulations repro-ducing the experiments by Wanget al.(2012) where mVGs were inserted upstream the SBLI. This baseline case al-lowed us to validate our numerical strategy and deepen our knowledge of the underlying mechanisms driving the nat-ural and controlled SBLI configurations (see Gr´ebertet al. (2018)). The geometry of the mVGs selected in this prelim-inary work was based on the study by Andersonet al.(2006) who concluded that mVGs protruding byh=0.47δvin the upstream TBL and located at a distanced=16δv=34h from the impingement point of the incident shock (δv be-ing the TBL thickness immediately upstream the mVGs), were the most efficient settings to mitigate the effect of the incident shock wave on the TBL. However, this optimiza-tion study was based on RANS simulaoptimiza-tions that may not in-clude all the main ingredients of the interaction, especially regarding the unsteady nature of this configuration. This last consideration has been the motivation for the present contribution that aims at running complementary LES with different mVGs heights and/or distances from the impinge-ment point than in the reference case. This will allow to check, using high fidelity simulations, how the geometrical parameters of the control devices affect the efficiency of the control, regarding the size of the separated area, the pres-sure loads on the wall and the unsteady properties of the interaction.
NUMERICAL SET-UP
The present LES were performed using the CharLESX solver, see Bermejo-Morenoet al.(2014), which solves the spatially filtered compressible Navier-Stokes equations for conserved quantities using a finite volume formulation on unstructured meshes. An explicit third-order Runge-Kutta (RK3) scheme is used for time advancement. The solver re-lies on Vreman (2004) subgrid-scale model to represent ef-fect of unresolved small-scale fluid motions. It also features a solution-adaptive methodology which combines a non-dissipative centered numerical scheme and an essentially non-oscillatory second-order shock-capturing scheme.
The baseline configuration selected in the present work strictly follows Wanget al.(2012) experiments, as sketched in Figure 1. It is characterized by a freestream Mach num-ber ofM=2.7 and a Reynolds numberReθ =3600 based on the TBL momentum thickness at the position of impact of the incident shock. As in the experiments, a shock
gen-erator is included on the opposite wall yielding a flow de-flection ofφ=10.5◦. The spanwise extent of the
compu-tational domain has been carefully chosen in order to pre-vent spurious effects on the size of the separation bubble Lsep. It has been set to 6δ0, whereδ0is the TBL thickness
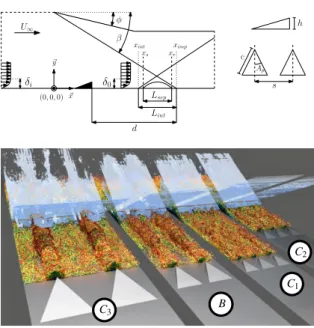
just upstream of the SBLI (i.e. 1.5Lsep upstream ofximp, see Figure 1), leading to a domain 1.2 times larger than the interaction length scaleLint. As a consequence, the span-wise extent of the domain includes two spanspan-wise periods of the MVGs rake in order to replicate the geometry of Wang et al.(2012) experiments. The baseline microramp geome-try is the same as in the experiments, Figure 1 (top), with a height ofh=0.47δv, a chord lengthc=7.2hand a wedge half-angleAp=24◦. β φ δi δ0 xint ximp Lsep Lint xs xr ~ y ~ x (0,0,0) U∞ Ap c s h d B C1 C2 C3
Figure 1. (top) Reference parameters and length scales and (bottom) microramps configurations of the present study.
The grid parameters used for the present LES are given in Table 1 where the lowest values in the range of∆x+and
∆z+correspond to the mesh refinement on the edges of the mVGs. The turbulent boundary layer is established using the digital filter inlet conditions proposed by Xie & Castro (2008) and modified by Touber & Sandham (2009). The pa-rameters of the digital filter are chosen according to Touber & Sandham (2009) prescription. The flat plate and mVGs are modelled as adiabatic no-slip walls, whereas symmetry conditions are used for the shock generator and the down-stream top part of the computational domain. Periodicity is enforced for the lateral boundaries of the domain, and the outflow boundary condition uses linear extrapolation of all flow variables.
In order to investigate the influence of the mVGs height and position on the mitigation of the SBLI, several high-fidelity LES (see Figure 1 (top)) have been carried out, vary-inghandd(see Table 2), but keeping the same grid reso-lution constraints and other physical parameters constant. It should be noted that configurationBis identical to the
Table 1. Grid parameters for the LES withδ0 the TBL
thickness just upstream of the SBLI.
∆x+ ∆y+min ∆z+ Lx/δ0 Ly/δ0 Lz/δ0
[7.5-20] 1 [3-15] 40 12 6
experiment of Wanget al.(2012) and features the optimal microramps geometry identified by Andersonet al.(2006). For comparison purpose, the authors will be referring to A as the reference clean configuration, i.e. SBLI without mVGs.
Table 2. Height (h) and distance to SBLI (d) of the 4 con-trolled configurations investigated.
Case B C1 C2 C3
h/δv 0.476 0.3 0.3 0.75
d/δv 16 16 10 16
In order to address the SBLI’s unsteadiness, wall-pressure fluctuations have been recorded in the interac-tion region and its vicinity, x∗B = [−2.8,2.6] with x∗B = (x−ximp)/LsepB, whereLsepBdenotes the separated region
length in caseB, andximpis the wall inviscid-impingement location of the incident shock wave. In addition to these measurements at the wall, velocity probes have been placed in the wake of the microramps in the center location z0
of each mVG and along the median plane between them
±zinter, see Figure 2. It should be noted that the total in-tegration time for case A equals 6458δ0/U∞, which
cor-responds to 55 low-frequency (LF) period of the reflected shock foot. The total integration time of the reference con-trolled configuration (case B) is 34 LF (4054δ0/U∞) and casesC1,2,3cover nearly 30 LF (3370δ0/U∞).
RESULTS
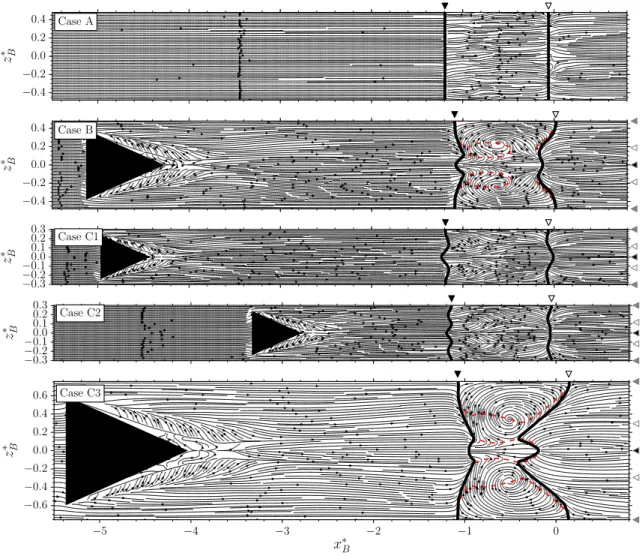
One of the main features of the mVGs is to reduce the separated region by adding near wall momentum to the in-coming TBL. Figure 2 shows the time-averaged skin fric-tion lines for the clean SBLI configurafric-tion and all controlled cases. In order to characterise the performance of the micro-ramps we computed the separated area located between the separation and reattachment lines (black thick solid lines in Figure 2). These values are summarized in Table 3.
Table 3. Separated area measurements (×10−5m2) and difference w.r.t. case A for all cases.
A B C1 C2 C3
4.65 3.99 4.64 4.5 3.65
- -14.2% -0.35% -3.2% -21.5%
We clearly observe that the most efficient mVGs con-figuration in reducing the separated area is caseC3. This
Figure 2. Time-averaged skin friction lines for all cases: x∗B= (x−ximp)/LsepB and z
∗
B=z/LsepB, with LsepB the mean
separation length of caseB. Black thick solid lines indicate the separation and reattachment lines. Red dotted lines show the iso-contour of mean streamwise shear-stress<τw,x>=0. On the right side, black triangle denotes the symmetry plane of the mVG (z0), white triangles indicate the 25% span of the mVG and grey triangles show the location of the plane in-between the
mVGs (±zinter).
configuration corresponds to the highest mVGs height, and displays a separated area reduced by 21.5% compared to the clean configurationA, while this reduction is only of 14.2% in the reference controlled caseB. We retrieve in caseC3the
same spatial organization as in caseB, with two tornado-like vortices developing inside the recirculation bubble (their wall signature, see D´elery (2001), can be seen in Figure 2) but with increased strength and size. In case B, we only observe pockets of positive streamwise shear-stress in-side the separated area, whereas caseC3 exhibits an
em-phasized phenomenon with a reverse flow region display-ing three negative shear-stress zones separated by two pos-itive streamwise shear-stress ridges. This is due to the two powerful counter-rotating vortices arising from the sides of the mVGs, as reported by Babinskyet al.(2009); Sunet al. (2014); Yeet al.(2016), tearing the reverse flow region. The tornado vortices are thus created because of these intense shear zones at the wall. For the two smaller mVGs height, i.e.casesC1 andC2, we found no evidence of such
vor-tices inside the recirculation bubble and teared reverse flow region. In addition, these low-profiles microramps appear to be the less effective controlled devices with a separated area reduced by only 0.35% to 3.2% respectively compared
to caseA.
Another detrimental effect of the SBLI is the reflected shock foot low-frequency motion. In order to characterize this unsteadiness we rely on pressure probes located at the wall, equally spaced in the streamwise direction, covering the entire span and surrounding the SBLI region. Wall-pressure probes were sampled at a very high frequency of approximately StLA=60, where StLA is the reduced
fre-quency based on the mean separation length of the uncon-trolled case A,LsepA, and the free-stream velocityU∞. This normalisation, based on the reference case A, is used in or-der to quantify the influence of the microramps on the fre-quency content of the baseline SBLI. The total integration time for these wall-pressure probes allow to capture more than 30 low-frequency periods of the reflected shock foot. Wall-pressure spectra are obtained using Welch’s algorithm with Hann window for a total number of 7 segments and a 50% overlap. Therefore, these spectra have a minimum resolvable Strouhal number ofStLA=3·10
−3. Note that
we applied a Konno-Omachi smoothing filter (Konno & Ohmachi, 1998) to all power spectral densities (PSD). Fur-thermore, due to the symmetry properties of our SBLI con-figuration with mVGs, all the reported PSD are spatially
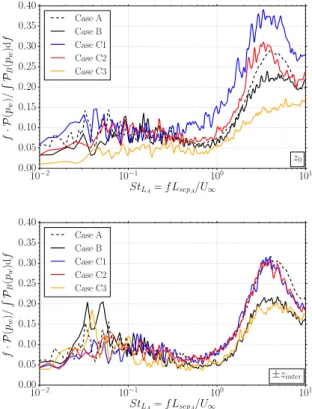
av-Figure 3. Weighted power spectral densities of wall-pressurepwfluctuations at the reflected shock foot location of all controlled cases in the symmetry plane of the micro-rampsz0(top) and in-between the mVGs±zinter(bottom). Spectra are normalised by the integrated spectrum of case B.
eraged in the spanwise direction, for convergence purposes, by taking advantage of the periodicity and symmetries of the mVGs.
Spectra at the reflected shock foot location, for all con-trolled configurations, are shown in Figure 3 for two dif-ferent spanwise stations; in the symmetry plane of the mi-crorampsz0and in-between the mVGs±zinter. Whereas in
the clean SBLI configuration,i.e. without mVGs, the low-frequency unsteadiness is homogeneous in the spanwise di-rection, the wakes of the microramps are inducing a modu-lation of this unsteadiness in this direction. In the wake of the microramps, atz0 location, we clearly observe strong
discrepancies between the mVGs configurations over the entire frequency range. In particular, the broadband activ-ity that takes place in the low-frequency range (StLA<0.1),
related to the reflected shock foot motion, is altered with a clear damping for casesBandC3compared to the
low-profile mVGs (C1 andC2). However, this damping of the
low-frequency broadband activity is limited to the zone of influence of the microramps’ wake since in-between the mVGs, atzinter location, we observe that the damping ca-pability of cases BandC3 is canceled and even reverted
with an amplification of the low-frequency. The other two microramps configurations (C1 andC2) exhibit nearly the
same spectra as in the wake of the microramps, with similar activity levels in the low-frequency range. Interestingly, the characteristic frequencies of the low-frequency motion of the reflected shock foot do not appear to be affected by the mVGs and their effect seems to be limited to the modulation of its intensity.
Efficient microramps devices for the control of SBLI
configurations should reduce the overall pressure loads in-tensity sustained by the wall. We introduce the following metric in order to characterize this quantity:
IF0 e S (x) = q hF02 e Si hF e Si with hF e S(x)i= Z t Z z pw(x,z,t)ds (1) Using this metricIF0
e S
(x), we retrieve the partial pres-sure loads on the wall surface. Prespres-sure loads are only partial due to the incomplete discretization of the pressure probes in the spanwise and streamwise directions. Figure 4 displays the streamwise evolution of the pressure loads in-tensity for the clean SBLI configuration and all controlled cases, and overall integrated values ofIF0
e S
(x)are reported in Table 4. Again, caseC3proved to be the most efficient mVG
configuration with a 23% decrease of the pressure loads in-tensity compared to the uncontrolled caseA. The baseline mVG (caseB) showed a 9% decrease and the least effective mVG configurations are casesC1(−3.2%) andC2(−1.6%).
It should be noted that caseC3 is the only one showing
a clear decrease of the pressure loads in the recirculation bubble, all other cases presenting a peak atx∗B=−0.4 with levels similar to the uncontrolled caseA.
Figure 4. Streamwise evolution of pressure loads in-tensity IF0
e S
(x) for all cases considered, with F e S(x,t) =
R
zpw(x,z,t)ds.
Table 4. Pressure loads intensity measurements (×10−4) and difference w.r.t. caseAfor all cases.
A B C1 C2 C3
6.24 5.68 6.04 6.14 4.81
- -9.0% -3.2% -1.6% -23%
Therefore, even though we observed an increase of the low-frequency activity for casesBandC3 in-between the
microramps, the overall pressure loads have been reduced. Increasing the mVGs’ height, and consequently the strength and size of their wake, appears to be the key feature to re-duce the detrimental effect of the low-frequency motion of the reflected shock foot. The microramps do not seem to
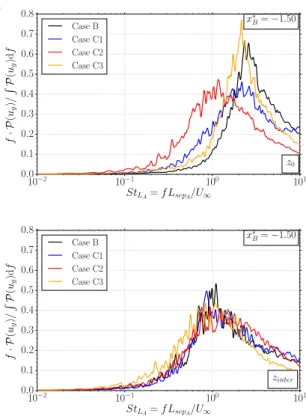
alter the frequencies involved in this motion, although it has been shown that mVGs’ wakes feature highly coherent structures, see Wanget al.(2012); Sunet al.(2014); Gr´ebert (2018) for more details. To characterise the unsteady forc-ing induced by these structures we focus on the wall-normal velocity spectra, following the same procedure as for the wall-pressure probes. Figure 5 displays the weighted PSD of wall-normal velocity at the edge of the TBL just upstream of the SBLI (x∗B=−1.5) in the wake of the microramps (z0)
and in-between the mVGs (zinter). It can clearly be seen that the spectra in the wake are altered by the presence of these highly coherent structures for all the configurations but caseC2. For this particular configuration, the limited
height of the mVGs (h=0.3δ) and their location closer to the SBLI where the TBL is thicker (leading to an lower ef-fective height of the mVGs in that case compared to case C1) did not enable the formation of these structures. We thus
retrieve the same spectrum as in-between the mVGs, simi-lar to the one obtained for an unaltered turbulent boundary layer. Regarding the medium size configurations, casesB andC3, the highly coherent structures are shed at a very
spe-cific frequency ofStLA=2.4 andStLA=2.15 respectively,
see Table 5. The low-profile configurationC1 exhibits a
slightly different spectrum, with a clear shift towards higher frequencies, compared to the TBL in-between the micro-ramps, but with unchanged energy levels. This indicates that the mVG’s height ofh=0.3δdoesn’t seem to be
suf-ficient to induce strong enough highly coherent structures that may induce a clear high-frequency forcing in the wake of the microramps.
Figure 5. Weighted power spectral densities of wall-normal velocityuyat the edge of the TBL upstream of the SBLI (x∗B=−1.5) in the wake of the microrampsz0(top)
and in-between the mVGs±zinter(bottom).
Finally, it appears that this shedding frequency is not linked to the mVG height itself, at least not directly, but rather to the alteration of the TBL thickness due to their presence. To corroborate this assumption, Figure 6 shows the same weighted PSD as aforementioned but with a dif-ferent frequency scaling based on the local TBL thickness
δe, St = fδe/U∞. It clearly appears that casesB andC3
perfectly scale with this new TBL thickness based scaling. The larger the mVG, the thicker the TBL in their wake and therefore the lower the shedding frequency. In any case, the high-frequency forcing associated to the shedding of these large scale structures in the wake of the mVGs is two or-ders of magnitude above the low-frequency unsteadiness of the reflected shock foot, and therefore does not trigger any modulation of the SBLI unsteadiness.
Figure 6. Weighted power spectral densities of wall-normal velocityuyat the edge of the TBL upstream of the SBLI (x∗B=−1.5) in the wake of the microrampsz0with
a new frequency scaling based on the TBL thicknessδeat this location,St= fδe/U∞.
Table 5. Shedding frequency in the mVGs wake.
Case B C1 C2 C3
Wake frequency (StL) 2.4 2.16 - 2.15
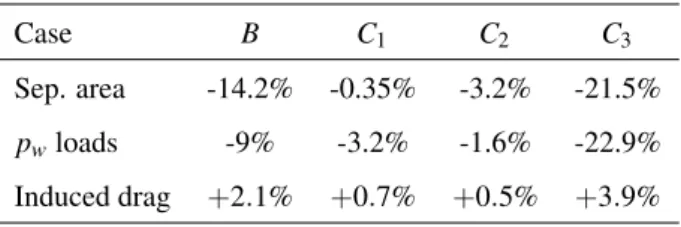
In order to quantify the impact of the tested control de-vices on the global performances of the flow configuration, we have finally estimated the drag penalty induced by the presence of the different mVGs, see Table 6. It is interest-ing to see that the increase in the thickness of the mVGs introduces only a very limited additional cost in terms of drag, that doesn’t exceed 3.9% compared to the uncon-trolled caseAin the four tested configurations. The highest mVG configuration caseCthus appears as a good candidate compared to other mVGs configurations, with respect to its improved performances in reducing the separated area and pressure loads intensity sustained by the wall surface, that comes with a very limited drag penalty.
Table 6. Summary of microramps effectiveness w.r.t. case Aand their drag penalty.
Case B C1 C2 C3
Sep. area -14.2% -0.35% -3.2% -21.5%
pwloads -9% -3.2% -1.6% -22.9%
Induced drag +2.1% +0.7% +0.5% +3.9%
CONCLUSION
To the authors’ knowledge, this work provides the first high-fidelity, very long-time integrated (covering more than 30 LF periods) LES database describing a parametric study on the control of SBLI using passive devices. Four mi-croramps configurations, with varying height and distance to SBLI, have been investigated under the same flow con-ditions corresponding to the experiment of Wang et al. (2012), with a free-stream Mach number ofM=2.7 and a Reynolds number ofReθ=3600. We established that the addition of the microramps induces a high-frequency un-steadiness related to the shedding of highly coherent large scale structures. The shedding frequency is inversely pro-portional to the altered TBL thickness: the larger the mVG, the thicker the TBL in their wake and therefore the lower the frequency. We also found that only medium size mVGs (0.5δ<h<0.8δ) can trigger such unsteadiness that is two
order of magnitude above the low-frequency unsteadiness related to the reflected shock foot motion. This detrimen-tal feature of the SBLI remains unaffected in terms of fre-quency content, regardless of the microramps height, even if its energy is damped by the wake of the mVGs. A clear re-duction of the SBLI separated region as well as a net damp-ing of the pressure loads intensity on the wall have been highlighted when medium size mVGs are placed in the up-stream TBL. Moreover, these improved performances ap-peared to come with a very limited drag penalty. We have thus shown in the present study that medium size micro-vortex generators, rather than low-profile ones, appear to be best suited to the control of SBLI. We also demon-strated that the originally optimised mVG design by An-dersonet al.(2006) may not be the most efficient to control SBLI. Our results advocate for a reconsideration of the op-timisation framework that should not be limited to RANS modelling only but should also include LES instead.
ACKNOWLEDGEMENTS
This research was supported by the French Ministry of Defense through the financial support of the DGA and the region of Occitanie - Pyr´en´ees M´editerran´ee. This work was granted access to the HPC resources of CINES/IDRIS under the allocation 2018-A0042A07178 and 2019-A0062A07178, and from CALMIP (grants 2017-p1425 and 2018-p1425). We also acknowledge PRACE for awarding us access to JUQUEEN at JSC/Forschungszentrum Juelich, Germany (GSC/JSC grant 2016153674).
REFERENCES
Anderson, B. H., Tinapple, J. & Surber, L. 2006 Opti-mal Control of Shock Wave Turbulent Boundary Layer Interactions Using Micro-Array Actuation.AIAA paper
3197(June), 1–14.
Babinsky, H., Li, Y. & Pitt Ford, C. W. 2009 Microramp Control of Supersonic Oblique Shock-Wave/Boundary-Layer Interactions.AIAA Journal47(3), 668–675. Bermejo-Moreno, I., Campo, L., Larsson, J., Bodart, J.,
Helmer, D. & Eaton, John K. 2014 Confinement ef-fects in shock wave/turbulent boundary layer interactions through wall-modelled large-eddy simulations. Journal of Fluid Mechanics758, 5–62.
Clemens, N. T. & Narayanaswamy, V. 2014 Low-Frequency Unsteadiness of Shock Wave/Turbulent Boundary Layer Interactions. Annual Review of Fluid Mechanics46(September), 469–492.
D´elery, Jean M 2001 Robert Legendre and Henri Werl´e: To-ward the Elucidation of Three-Dimensional Separation. Annual Review of Fluid Mechanics33(1), 129–154. Gr´ebert, Arnaud 2018 Simulation num´erique aux grandes
´echelles du contrˆole de l’interaction onde de choc/couche limite au moyen de micro-g´en´erateurs de vortex. PhD thesis, ISAE-SUPAERO, Universit´e de Toulouse. Gr´ebert, Arnaud, Bodart, Julien, Jamme, St´ephane &
Joly, Laurent 2018 Simulations of shock wave/turbulent boundary layer interaction with upstream micro vortex generators.International Journal of Heat and Fluid Flow
72, 73–85.
Konno, Katsuaki & Ohmachi, Tatsuo 1998 Ground-motion characteristics estimated from spectral ratio between hor-izontal and vertical components of microtremor.Bulletin of the Seismological Society of America88(1), 228–241. Panaras, A. G. & Lu, F. K. 2015 Micro-vortex generators for shock wave/boundary layer interactions.Progress in Aerospace Sciences74, 16–47.
Sun, Z., Schrijer, F. F. J., Scarano, F. & van Oudheusden, B. W. 2014 Decay of the supersonic turbulent wakes from micro-ramps.Physics of Fluids26(2), 025115. Touber, E. & Sandham, N. D. 2009 Large-eddy
simula-tion of low-frequency unsteadiness in a turbulent shock-induced separation bubble. Theoretical and Computa-tional Fluid Dynamics23(2), 79–107.
Vreman, A. W. 2004 An eddy-viscosity subgrid-scale model for turbulent shear flow: Algebraic theory and ap-plications.Physics of Fluids16(10), 3670–3681. Wang, Bo, Liu, Weidong, Zhao, Yuxin, Fan, Xiaoqiang
& Wang, Chao 2012 Experimental investigation of the micro-ramp based shock wave and turbulent bound-ary layer interaction control. Physics of Fluids24(5), 055110.
Xie, Z.-T. & Castro, I. P. 2008 Efficient Generation of In-flow Conditions for Large Eddy Simulation of Street-Scale Flows.Flow, Turbulence and Combustion81(3), 449–470.
Ye, Qingqing, Schrijer, Ferry F. J. & Scarano, Fulvio 2016 Boundary layer transition mechanisms behind a micro-ramp.Journal of Fluid Mechanics793, 132–161.