Research Article
Preliminary Study on the Efficient Electrohysterogram
Segments for Recognizing Uterine Contractions with
Convolutional Neural Networks
Jin Peng ,
1Dongmei Hao ,
1Haipeng Liu,
2Juntao Liu,
3Xiya Zhou,
3and Dingchang Zheng
21College of Life Science and Bioengineering, Beijing University of Technology, Intelligent Physiological Measurement and Clinical Translation,
Beijing International Platform for Scientific and Technological Cooperation, Beijing 100024, China
2Medical Technology Research Centre, Faculty of Health, Education, Medicine and Social Care, Anglia Ruskin University, Chelmsford CM1 1SQ, UK
3Department of Obstetrics, Peking Union Medical College Hospital, Beijing 100730, China
Correspondence should be addressed to Dongmei Hao; [email protected] and Dingchang Zheng; [email protected]
Received 7 May 2019; Revised 28 July 2019; Accepted 11 September 2019; Published 13 October 2019
Academic Editor: Heide Schatten
Copyright © 2019 Jin Peng et al. This is an open access article distributed under the Creative Commons Attribution License, which permits unrestricted use, distribution, and reproduction in any medium, provided the original work is properly cited.
Background. Uterine contraction (UC) is the tightening and shortening of the uterine muscles which can indicate the progress of pregnancy towards delivery. Electrohysterogram (EHG), which reflects uterine electrical activities, has recently been studied for UC monitoring. In this paper, we aimed to evaluate different EHG segments for recognizing UCs using the convolutional neural
network (CNN).Materials and Methods. In the open-access Icelandic 16-electrode EHG database (122 recordings from 45
pregnant women), 7136 UC and 7136 non-UC EHG segments with the duration of 60 s were manually extracted from 107 recordings of 40 pregnant women to develop a CNN model. A fivefold cross-validation was applied to evaluate the CNN based on sensitivity (SE), specificity (SP), and accuracy (ACC). Then, 1056 UC and 1056 non-UC EHG segments were extracted from the other 15 recordings of 5 pregnant women. Furthermore, the developed CNN model was applied to identify UCs using different
EHG segments with the durations of 10 s, 20 s, and 30 s.Results. The CNN achieved the average SE, SP, and ACC of 0.82, 0.93, and
0.88 for a 60 s EHG segment. The EHG segments of 10 s, 20 s, and 30 s around the TOCO peak achieved higher SE and ACC than the other segments with the same duration. The values of SE from 20 s EHG segments around the TOCO peak were higher than
those from 10 s to 30 s EHG segments on the same side of the TOCO peak.Conclusion. The proposed method could be used to
determine the efficient EHG segments for recognizing UC with the CNN.
1. Introduction
Uterine contraction (UC) is the tightening and shortening of the uterine muscles. UC can reflect the progress of preg-nancy towards delivery and is a major observation for es-timating the approach of delivery [1]. Electrohysterogram (EHG), which reflects uterine electrical activities, is a promising noninvasive technology for external UC moni-toring [2]. However, it is still ambiguous which EHG seg-ments are appropriate for recognizing UC.
Currently, four methods have been proposed to assess UCs. Manual palpation, which identifies UC by palpating the parturient abdomen over the uterine corpus, requires the constant bedside presence of a trained operator [1]. Internal uterine catheter (IUPC) is limited by its invasiveness and the need for ruptured membranes [3]. External tocodyna-mometry (TOCO) is noninvasive, but its recording quality depends on correct position of the sensor on the maternal abdomen and is influenced by maternal movements and the amount of subcutaneous fat [4]. Recently, EHG
Volume 2019, Article ID 3168541, 9 pages https://doi.org/10.1155/2019/3168541
measurement has been considered a noninvasive method and an alternative approach of TOCO to monitor UC [5]. EHG features have been investigated to distinguish between UCs and non-UCs (non-uterine contractions) [6, 7]. These features have been extracted by power spectral density, wavelet packet decomposition [8], autoregression model [9], and other signal processing methods in the time and the frequency domain [1, 7]. Nonlinear processes have also been involved in gener-ating UCs because of the complex interactions between billions of myometrium cells [10]. Therefore, nonlinear methods including time reversibility, sample entropy, Lyapunov exponents and delay vector variance [11], nonlinear interdependencies [10], and multifractal analysis [12, 13] are useful for EHG analysis. Some ad-vanced algorithms including the Hilbert transform, cross-correlation [14], correlation coefficient H2 [5], mutual correlation dimension, cross-approximate en-tropy [15], and dynamic cumulative sum [16] have also been proposed for UC detection. Besides, classifiers including the support vector machine [17], random forest, and artificial neural network [7] have been de-veloped for automatic UC detection using TOCO, car-diotocogram [18], and EHG signals. Even though some convincing results have been reported, there were dis-crepancies between them because of different data sources, feature selection algorithms, and classifiers applied [19, 20].
The convolutional neural network (CNN) has recently been applied to obstetrics and gynecology [21] for classifi-cation of the fetal heart rate [22], electromyography [23], and electrocardiogram signals [24]. The CNN is a type of machine learning which can classify images and time series without additional feature extraction and selection and produce state-of-the-art recognition results. The out-standing classification capability of the CNN provides possibilities for detecting UCs with EHG images.
The purpose of this study is to investigate the EHG segments appropriate for identifying UC. A CNN will be developed by EHG segments of 60 s and then utilized to evaluate EHG segments of 10 s, 20 s, and 30 s relative to the TOCO peak.
2. Materials and Methods
EHG signals were first manually segmented into UCs and non-UCs based on UC annotations and TOCO signals. 7136 UCs and 7136 non-UCs of 60 s duration were extracted from 107 recordings of 40 pregnant women and used to establish a CNN model. Then, 1056 UCs and 1056 non-UCs were extracted from the other 15 recordings of 5 pregnant women. In particular, the EHG segments of 10 s, 20 s, and 30 s were classified as UC and non-UC using the established CNN model. The EHG segments of different durations were evaluated based on their sensitivity (SE), specificity (SP), and accuracy (ACC). In this study, a UC was divided into several small segments, and those with higher SE and ACC were considered efficient EHG segments for recognizing UC. The details of each step are shown in Figure 1.
2.1. Icelandic 16-Electrode EHG Database. The open-access Icelandic 16-electrode EHG database contained 122 EHG recordings performed on 45 pregnant women, and some of them were measured more than once at Akureyri Primary Health Care Centre and Landspitali University Hospital between 2008 and 2010 in Iceland [25]. The database also provided simultaneously recorded toco-graphs, annotations of events, and obstetric information of participants. The participants had normal singleton pregnancies without any known preterm birth risk factors. A grid of 4×4 electrode was placed on the ab-domen with the reference and ground electrodes on each side of the body (not standardized), as shown in Figure 2(a). Recordings were performed in the third trimester (112 recordings) and during labor (10 re-cordings). The average recording durations for preg-nancy and labor were 61 and 36 min. The EHG signals were sampled at 200 Hz.
2.2. EHG Signal Preprocessing and Segmentation. EHG sig-nals were downsampled at 20 Hz and preprocessed by a 5th order Butterworth bandpass digital filter (0.1∼4 Hz) to remove the unwanted interference [20, 26].
Each EHG signal was manually divided into UC and non-UC segments based on the UC annotation and TOCO signal [5, 27]. The duration of the UC segment was sym-metric around the TOCO peak for easy identification [4, 28]. The corresponding non-UC was extracted between two UCs, as shown in Figure 2(b). In total, 7136 UCs and 7136 non-UCs of 60 s duration were extracted and confirmed by two clinicians. The extracted segments were discarded in case any clinician disagreed.
Then, the EHG segments with the duration of 10 s, 20 s, and 30 s were extracted from the left and right sides of the TOCO peak, as shown in Figure 3. Considering the time difference between the EHG recordings, annotations, and tocographs [28, 29], twelve 10-second EHG segments (10_L1∼6 and 10_R1∼6), six 20-second EHG segments (20_L1∼3 and 20_R1∼3), and four 30-second EHG segments (30_L1∼2 and 30_R1∼2) with a total 120 s duration were extracted to contain UC segments as many as possible. 1056 UCs and 1056 non-UCs with different durations were extracted.
Finally, all EHG segments were saved as images and normalized to 482×482 pixels by resizing. Sixteen EHG images were obtained from 16-channel recordings for each UC and non-UC.
2.3. Convolutional Neural Network for Classification of EHG Segments. The CNN is a specialized deep neural network for processing 1D time series and 2D images [24]. In this study, the CNN consisted of convolutional (Conv), max-pooling, fully connected (FC), local response normalization (LRN), dropout, and softmax layers and a rectified liner unit (ReLU), as shown in Figure 4. The Conv layer with the image size of lengthland widthwand the number of filters (m) denoted byl×w@m was used to extract features of the input image. The max-pooling layer downsampled the
feature map and reduced the computational complexity. The number of neurons in the FC layer was denoted by num_output.
Every Conv and every FC were followed by a ReLU [24, 30] which could be activated to speed up the training process. Behind a ReLU, the LRN layer detected high-fre-quency features and assigned them with large weights [31]. The parameters in the LRN layer were set as follows: the local_size value of 5,αvalue of 0.0001, andβvalue of 0.75 [32]. The dropout layer with half connection could reduce overfitting and improve regularization [30]. The batch gradient descent algorithm was applied to facilitate the CNN converge with the global optimum. Finally, the FC layer was
connected to the softmax function (loss, shown in Table 1) to obtain the last output [22].
Stride refers to the number of samples that the filter slides over the input image. In the first layer, the size of the input image changed from 482×482@96 to 92×92@96 when the kernel was set to 27 and stride was set to 5. Then, the image size decreased from 92×92@96 to 31×31@96 after the max-pooling layer. Subsequently, the size of the image was processed with a stride of 1, kernel of 2, and max-pooling layer to reduce its size from 30×30@256 to 15×15@ 256. After the third Conv layer, the image size was further reduced to 13×13@384. The Conv and max-pooling layers were once again performed on the output neuron of
All EHG segments 7136 UCs + 7136 non-UCs
(the duration of 60 s)
1056 UCs + 1056 non-UCs, (the duration of 10 s, 20 s, and 30 s, respectively) Training set (80%, 5709 UCs + 5709 non-UCs) Testing set (20%, 1427 UCs + 1427 non-UCs) 5-fold cross-validation
Test result for 60 s duration (SE, SP and ACC)
CNN model
Test result, respectively, for 10 s, 20 s, and 30 s
(SE, SP and ACC) Applied Validation subset (20%, 1142 UCs + 1142 non-UCs) Training subset (80%, 4567 UCs + 4567 non-UCs)
Figure 1: Flow chart of our proposed method. UC�uterine contraction; non-UC�non-uterine contraction; SE�sensitivity;
SP�specificity; ACC�accuracy.
Pregnant abdomen Navel Ref. Ground 1 5 9 13 2 6 10 14 3 7 11 15 4 8 12 16 TOCO (a) 0 10 20 30 40 50 60 TOCO EHG1 EHG2 EHG3 EHG4 EHG5 EHG6 EHG7 EHG8 EHG9 EHG10 EHG11 EHG12 EHG13 EHG14 EHG15 EHG16 Time (min) Contraction Noncontraction (b)
Figure2: (a) The ideal configuration of EHG electrodes (the reference and ground electrodes were not standardized to certain sides for the
10_L6 10_L5 10_L4 10_L3 10_L2 10_L1 10_R1 10_R2 10_R3 10_R4 10_R5 10_R6 20_L3 20_L2 20_L1 20_R1 20_R2 20_R3
30_L2 30_L1 30_R1 30_R2
Figure3: An example of the EHG segment with a different duration and position corresponding to the TOCO signal. The start, peak, and
end points of the TOCO signal are marked by cross (“×”). The corresponding EHG segment is divided into different durations of 10 s, 20 s,
and 30 s and named 10_L1∼6 and 10_R1∼6, 20_L1∼3 and 20_R1∼3, and 30_L1∼2 and 30_R1∼2, respectively.
Conv + ReLU + LRN
Conv +
ReLU Conv +ReLU
FC + ReLU + dropout FC + ReLU + dropout FC + loss Max-pooling Output (label) Conv +
ReLU pooling
Max-pooling Conv + ReLU + LRN 10s 20s Image segments 482 × 482 30s 92 × 92@96 31 × 31@96 30 × 30@256 15 × 15@256 13 × 13@384 13 × 13@384 13 × 13@256 6 × 6@256 4096 4096 2
Figure4: CNN architecture with 11 layers including the Conv, max-pooling, and FC layers.
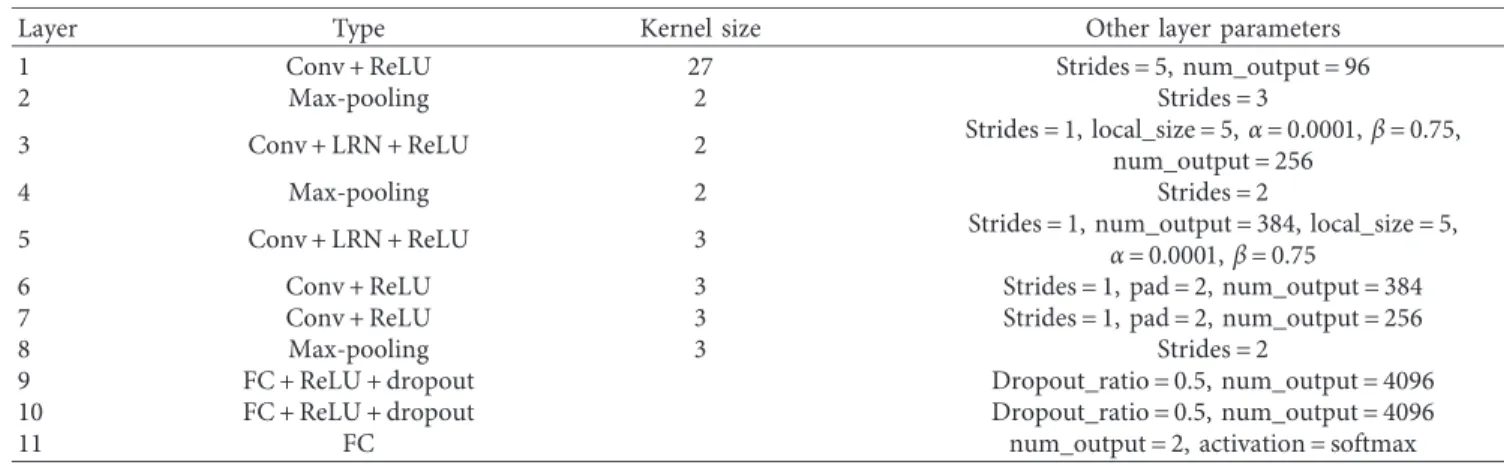
Table1: Detailed parameters used for all the layers of the CNN model.
Layer Type Kernel size Other layer parameters
1 Conv + ReLU 27 Strides�5, num_output�96
2 Max-pooling 2 Strides�3
3 Conv + LRN + ReLU 2 Strides�1, local_size�5,α�0.0001,β�0.75,
num_output�256
4 Max-pooling 2 Strides�2
5 Conv + LRN + ReLU 3 Strides�1, num_output�384, local_size�5,
α�0.0001,β�0.75
6 Conv + ReLU 3 Strides�1, pad�2, num_output�384
7 Conv + ReLU 3 Strides�1, pad�2, num_output�256
8 Max-pooling 3 Strides�2
9 FC + ReLU + dropout Dropout_ratio�0.5, num_output�4096
10 FC + ReLU + dropout Dropout_ratio�0.5, num_output�4096
11 FC num_output�2, activation�softmax
13×13@256 and 6×6@256, respectively. These were fol-lowed by FC layers with 4096 neurons. The final FC layer consisted of two neurons to classify UC and non-UC. The detailed parameters, including the kernel, stride, weight, and bias initialization of the CNN, are listed in Table 1, based on prior knowledge and manual tuning to achieve a satisfactory training result.
Different results were produced because of different hyperparameter values at each training of the CNN [22]. The repetition of each experiment process is called an “iteration” [33]. The standard deviation was set to 0.1, and some small positive values (0, 1) were added to the bias to avoid dead nodes [22]. The dropout (dropout_ratio) was set to 0.5 to gain the best results. Based on the results from the preliminary test, fine tuning was performed with the learning rate of 0.001, weight decay of 0.0005, learning rate drop factor of 0.1, learning rate drop period of 10, mo-mentum of 0.9, gamma of 0.1, and maximum iteration of 20000. The hyperparameters for training the CNN are shown in Table 2.
The CNN was run on a workstation with Linux Ubuntu 18.04 LTS Operating System and NVIDIA 1080 Ti GPU. The development environment was the CAFFE net framework, and the development language was MATLAB and Python.
2.4. Evaluation of CNN Model. A fivefold cross-validation was utilized to evaluate the performance of the established CNN [34]. 7136 UCs and 7136 non-UCs were equally di-vided into five subsets, four of which were used to train the CNN model and the other was used to test the CNN model. This process was repeated five times. Furthermore, the training set included training (80% of the training set) and validation (20% of the training set) subsets, in which the validation subset was used to tune the hyperparameters of the CNN.
SE, SP, and ACC were used to evaluate the classification performance, which were calculated as follows:
SE� TP TP+FN, SP� TN FP+TN, ACC� TP+TN FP+TN+TP+FN, (1)
where TP (true positive) and TN (true negative) are the numbers of UC and non-UC EHG segments that were correctly classified and FP (false positive) and FN (false negative) are the numbers of UC and non-UC EHG seg-ments that were falsely classified. The results of SE, SP, and ACC from the fivefold cross-validation were calculated and averaged to evaluate the CNN.
Furthermore, the established CNN was utilized to classify EHG segments of 10 s, 20 s, and 30 s to distinguish between UCs and non-UCs. The results of SE, SP, and ACC could indicate which EHG segments were efficient for recognizing UC with the CNN.
2.5. Statistical Analysis. One-way ANOVA with Tukey’s method was performed using the software SPSS 22 (SPSS Inc.) to compare SE, SP, and ACC between EHG segments with the same duration. A p value less than 0.05 was considered statistically significant.
3. Results
3.1. Evaluation of CNN Performance with EHG Segments of 60 s Duration. With the training set, the ACCs of five val-idations were 0.99, 1.00, 0.99, 0.98, and 0.99 and the loss ratios were 0.07%, 0.01%, 0.11%, 0.09%, and 0.08%. With the testing set, the averaged SE of 0.82, SP of 0.93, and ACC of 0.88 were achieved, as shown in Table 2.
3.2. Evaluation of CNN Performance Using EHG Segments of Different Durations. Table 3 shows the results from twelve 10-second EHG segments (10_L1∼6 and 10_R1∼6), six 20-second EHG segments (20_L1∼3 and 20_R1∼3), and four 30-second EHG segments (30_L1∼2 and 30_R1∼2). As in-dicated in Table 3, the values of SE and ACC from the EHG segments around the TOCO peak (10_L1 and 10_R1, 20_L1 and 20_R1, and 30_L1 and 30_R1) were higher than those from the other segments of the same duration (10_L2∼6 and 10_R2∼6, 20_L2∼3 and 20_R2∼3, and 30_L2 and 30_R2) (comparisons on both sides of the TOCO peak, respectively). In contrast, the values of SP were similar among EHG segments of different durations. Besides, the values of SE from 20 s EHG segments around the TOCO peak (20_L1 and 20_R1) were higher than those from 10 s to 30 s EHG segments on the same side of the TOCO peak (10_L1, 30_L1 and 10_R1, 30_R1).
3.3. Comparison of SE between Different EHG Segments.
Figure 5 shows SE from EHG segments of different dura-tions. The range of the time difference between TOCO and EHG segments of UC at the start and end points is high-lighted by shades of grey, and the mean of the time difference is denoted by a cross. In terms of 10 s duration, the SE values from 10_L1∼4 and 10_R1∼4 were significantly larger than those from 10_L6 (p<0.05). In terms of 20 s duration, the SE values from 20_L1∼2 and 20_R1∼2 were significantly larger than those from 20_L3 (p<0.05). In terms of 30 s duration, the SE values from 30_L1 and 30_R1 were significantly larger than those from 30_L2 (p<0.05). No significant difference was found between the start and end points (p>0.05).
Table2: Test results with EHG segments of 60 s duration.
Duration of the EHG
segment
Resulting values Calculatingparameters
FP FN TP TN SE SP ACC 60 s Fold1 97 241 1194 1338 0.83 0.93 0.88 Fold2 92 253 1174 1335 0.82 0.94 0.88 Fold3 107 252 1175 1320 0.82 0.93 0.87 Fold4 92 254 1159 1321 0.82 0.93 0.88 Fold5 116 251 1183 1318 0.82 0.92 0.88 Average 504 1251 5885 6632 0.82 0.93 0.88
4. Discussion
In this paper, a CNN model was built with UC and non-UC EHG segments of 60 s duration and then applied to rec-ognize UCs using different EHG segments (different du-rations and different positions relative to a TOCO peak). The results indicate the efficient EHG segments that could be used to recognize UCs and monitor pregnancy progress in the future. To the best of our knowledge, this is the first study on the duration and position of EHG segments in dis-tinguishing between UCs and non-UCs.
The EHG segment corresponding to UC was investigated with the TOCO peak as a reference, which was easier to identify than the start and end points. In this study, the EHG segments from different channels and different gestational weeks were mixed together because of the small dataset. The duration of the EHG segment was selected based on the following consideration: (i) the duration of 10 s performed the best in identifying and tracking uterine activity across subjects [14] and (ii) most of the UC durations were no more than 60 s based on the Icelandic EHG database and clinical experience.
Several EHG analysis methods including the nonlinear correlation coefficient H2 [5], cross-correlation [14], and root-mean-square envelope [28] have been proposed to improve the accuracy of UC detection. However, none of them concerned about the effects of the duration and po-sition of the EHG segment on UC detection. Table 3 and Figure 5 show that EHG segments around the TOCO peak (10_L1 and 10_R1, 20_L1 and 20_R1, and 30_L1 and 30_R1) achieved higher SE and ACC than the others, indicating that they are more efficient for recognizing UCs. Furthermore, the SE of 20 s EHG segments (20_L1 and 20_R1) was better than that of other duration segments. The duration of 10 s
and 30 s was supposed to contain a part of UC or additional non-UC which may influence its identification ability. We also observed different results on both sides of the TOCO peak, which might be due to the UC variation during pregnancy [35] and the imprecise synchronization between TOCO and EHG.
In this study, we focus on comparing EHG segments on each side of the TOCO peak separately because the rising and descending phases of the EHG segment reflect the tension and relaxation of the myometrium and may have different effects on recognizing UCs. Furthermore, recog-nition of UCs using EHG segments covering both sides of the TOCO peak (similar to 10_L1 + 10_L2 + 10_R1 + 10_R2) is also indispensable, which has been investigated in our previous study [36].
At the current stage, the EHG segments corresponding to UCs and non-UCs were first manually extracted to train a CNN model. The established CNN could then be applied to EHG segments determined by our study to automatically recognize UC; thereafter, the manual segmentation is no longer required. The ability to differentiate UCs from non-UCs could be improved with the efficient EHG segments. The clinicians agreed that our proposed method is very promising and could be applied to long-term UC moni-toring in practice.
The results were obtained from the combination of 16-channel EHG signals because of the small dataset at present. We will work at reducing the number of EHG-recording electrodes for clinical application. The current CNN model was built by limited images from different gestational ages, and the ability of recognizing UC may vary depending on gestational age. More data on different gestational ages could be collected to build models in scale-up studies to eliminate the influence of different gestational ages and improve the
Table3: Test results with EHG segments of different durations.
Different durations Resulting values Parameters
FP FN TP TN SE SP ACC 10_L6 107 793 263 949 0.25 0.90 0.57 10_L5 115 777 279 941 0.26 0.89 0.58 10_L4 162 534 522 894 0.49 0.85 0.67 10_L3 287 368 688 769 0.65 0.73 0.69 10_L2 190 308 748 866 0.71 0.82 0.76 10_L1 115 183 873 941 0.83 0.89 0.86 10_R1 124 206 850 932 0.80 0.88 0.84 10_R2 135 259 797 921 0.75 0.87 0.81 10_R3 261 349 707 795 0.67 0.75 0.71 10_R4 151 517 539 905 0.51 0.86 0.68 10_R5 268 887 169 788 0.25 0.84 0.55 10_R6 182 844 212 874 0.20 0.83 0.51 20_L3 241 726 330 815 0.31 0.77 0.54 20_L2 160 344 712 896 0.67 0.85 0.76 20_L1 130 108 948 926 0.90 0.88 0.89 20_R1 176 205 851 880 0.81 0.83 0.82 20_R2 169 371 685 887 0.65 0.84 0.74 20_R3 198 784 272 858 0.26 0.81 0.54 30_L2 210 687 369 846 0.35 0.80 0.58 30_L1 135 216 840 921 0.80 0.87 0.83 30_R1 154 238 818 902 0.77 0.85 0.81 30_R2 198 750 306 858 0.29 0.81 0.55
Durations in 10 s
Sensitivity value
Start (TOCO)
Peak (TOCO) End (TOCO)
∗ ∗ ∗ ∗ ∗ ∗ ∗ ∗ 10_L6 10_L5 10_L4 10_L3 10_L2 10_L1 10_R1 10_R2 10_R3 10_R4 10_R5 10_R6 1 0.9 0.8 0.7 0.6 0.5 0.4 0.3 0.2 0.1 0 (a) Start (TOCO)
Peak (TOCO) End (TOCO)
Durations in 20s 20_L3 20_L2 20_L1 20_R1 20_R2 20_R3 Sensitivity value 1 0.9 0.8 0.7 0.6 0.5 0.4 0.3 0.2 0.1 0 ∗ ∗ ∗ ∗ (b) Figure5: Continued.
usability of the CNN technique. The signal-to-noise ratio (SNR) of the EHG also affected UC recognition. Therefore, the effects of the EHG channel, gestational week, and SNR will be investigated to further improve UC detection.
5. Conclusion
The proposed method could be used to determine the ef-ficient EHG segments for recognizing UC with the CNN. The results showed the EHG segments around the TOCO peak achieved higher SE and ACC than the others with the same duration, which indicated that they are efficient for UC detection.
Data Availability
The database used in this study is available for access via the following link: https://physionet.org/pn6/ehgdb/.
Ethical Approval
The analysis of this database was approved by the Research Ethics Committee of the Faculty Research Ethics Panel (FREP) of Peking Union Medical College Hospital and Anglia Ruskin University.
Conflicts of Interest
The authors declare that they have no conflicts of interest.
Acknowledgments
This research was supported by Bill & Melinda Gates Foundation (OPP1148910), Beijing Natural Science
Foundation (7172015), Beijing Science and Technology Project (Z161100000116005), and International Program for Graduate Students of Beijing University of Technology.
References
[1] W. R. Cohen, “Clinical assessment of uterine contractions,”
International Journal of Gynaecology and Obstetrics, vol. 139, no. 2, 2017.
[2] M. W. C. Vlemminx, C. Rabotti, M. B. van der Hout– van der Jagt, and S. G. Oei, “Clinical use of
electro-hysterography during term labor,”Obstetrical &
Gynecolog-ical Survey, vol. 73, no. 5, pp. 303–324, 2018.
[3] A. P. Shaniba, K. Subramaniam, and N. V. Iqbal, “A review of significant researches on prediction of preterm birth using
uterine electromyogram signal,”Future Generation Computer
Systems, vol. 98, pp. 135–143, 2019.
[4] J. Sangeeta, F. A. Saad, and S. B. Sanmaan, “Comparing uterine electromyography & tocodynamometer to
in-trauterine pressure catheter for monitoring labor,”Journal of
Woman’s Reproductive Health, vol. 1, no. 3, pp. 22–30, 2016. [5] C. Muszynski, T. Happillon, K. Azudin, J.-B. Tylcz, D. Istrate, and C. Marque, “Automated electrohysterographic detection of uterine contractions for monitoring of pregnancy:
feasi-bility and prospects,”BMC Pregnancy and Childbirth, vol. 18,
no. 1, p. 136, 2018.
[6] C. Lili and H. Yaru, “Feature extraction and classification of EHG between pregnancy and labour group using
hilbert-huang transform and extreme learning machine,”
Compu-tational and Mathematical Methods in Medicine, vol. 2017, Article ID 7949507, 9 pages, 2017.
[7] P. Fergus, I. Idowu, A. Hussain, and C. Dobbins, “Advanced artificial neural network classification for detecting preterm
births using EHG records,” Neurocomputing, vol. 188,
pp. 42–49, 2016.
Start (TOCO)
Peak (TOCO) End (TOCO)
Durations in 30s Sensitivity value 1 0.9 0.8 0.7 0.6 0.5 0.4 0.3 0.2 0.1 0 30_L2 30_L1 30_R1 30_R2 ∗ ∗ (c)
Figure5: SE of EHG segments with different durations. (a) SE from 10 s EHG segments. (b) SE from 20 s EHG segments. (c) SE from 30 s
EHG segments.∗p<0.05: significant difference compared with 10_L6, 20_L3, and 30_L2, respectively, in (a), (b), and (c). The range of the
[8] D. Alamedine, M. Khalil, and C. Marque, “Parameters ex-traction and monitoring in uterine EMG signals. Detection of
preterm deliveries,” Innovation and Research in Biomedical
Engineering, vol. 34, no. 4-5, pp. 322–325, 2013.
[9] M. O. Diab, C. Marque, and M. A. Khalil, “Classifcation for uterine EMG signals: comparison between AR model and
statistical classifcation method,” International Journal of
Computational Cognition, vol. 5, no. 1, pp. 8–14, 2007. [10] M. Borowska, E. Brzozowska, and E. Oczeretko, “The Hilbert
transform in analysis of uterine contraction activity,”Studies
in Logic, Grammar and Rhetoric, vol. 43, no. 1, pp. 61–72, 2015. [11] A. Diab, M. Hassan, C. Marque, and B. Karlsson, “Quanti-tative perfermance analysis of four methods of evaluating signal nonlinearity: application to uterine EMG signals,” in
Proceedings of the Annual International Conference of the IEEE Engineering in Medicine & Biology Society, pp. 1045– 1048, San Diego, CA, USA, 2012.
[12] M. Kiran and S. Ramakrishnan, “Analyzing the influence of curl speed in fatiguing biceps brachii muscles using sEMG signals and multifractal detrended moving average
algo-rithm,” in Proceedings of the 38th Annual International
Conference of the IEEE Engineering in Medicine and Biology Society (EMBC), vol. 38, pp. 3658–4366, Orlando, FL, USA, August 2016.
[13] P. Namadurai, V. Padmanabhan, and R. Swaminathan, “Multifractal analysis of uterine electromyography signals for the assessment of progression of pregnancy in term
condi-tions,” IEEE Journal of Biomedical and Health Informatics,
vol. 23, no. 5, pp. 1972–1979, 2018.
[14] S. C. Mcdonald, G. Brooker, H. Phipps, and J. Hyett, “The identification and tracking of uterine contractions using
template based cross-correlation,”Annals of Biomedical
En-gineering, vol. 45, no. 9, pp. 2196–2210, 2017.
[15] B. Moslem, M. Khalil, C. Marque et al., “Complexity analysis
of the uterine electromyography,” inProceedings of the 2010
Annual International Conference of the IEEE Engineering in Medicine and Biology Society, vol. 32, pp. 2802–2805, Buenos Aires, Argentina, August–September 2010.
[16] M. Khalil and J. Duchene, “Uterine EMG analysis: a dynamic
approach for change detection and classification,” IEEE
Transactions on Biomedical Engineering, vol. 47, no. 6, pp. 748–756, 2000.
[17] H. Ocak, “A medical decision support System based on support vector machines and the genetic algorithm for the
evaluation of fetal well-being,”Journal of Medical Systems,
vol. 37, no. 2, pp. 1–9, 2013.
[18] H. Sahin and A. Subasi, “Classification of the cardiotocogram data for anticipation of fetal risks using machine learning
techniques,”Applied Soft Computing, vol. 33, pp. 231–238, 2015.
[19] A. Lemancewicz, M. Borowska, P. Ku´c et al., “Early diagnosis of threatened premature labor by electrohysterographic
recordings—the use of digital signal processing,”
Bio-cybernetics and Biomedical Engineering, vol. 36, no. 1, pp. 302–307, 2016.
[20] J. Mas-Cabo, Y. Ye-Lin, J. Garcia-Casado, J. Alberola-Rubio, A. Perales, and G. Prats-Boluda, “Uterine contractile effi-ciency indexes for labor prediction: a bivariate approach from
multichannel electrohysterographic records,” Biomedical
Signal Processing and Control, vol. 46, pp. 238–248, 2018. [21] G. S. Desai, “Artificial intelligence: the future of obstetrics and
gynecology,” The Journal of Obstetrics and Gynecology of
India, vol. 68, no. 4, pp. 326-327, 2018.
[22] L. Jianqiang, H. Luxiang, S. Zhixia et al., “Automatic classi-fication of fetal heart rate based on convolutional neural
network,” IEEE Internet of Things Journal, vol. 6, no. 2,
pp. 1394–1401, 2018.
[23] N. S. Velandia, R. J. Moreno, and R. D. Hernandez, “CNN architecture for robotic arm control in a 3D virtual
envi-ronment by means of by means of EMG signals,”
Contem-porary Engineering Sciences, vol. 10, no. 28, pp. 1377–1390, 2017.
[24] J. S. Lee, M. Seo, S. W. Kim, and M. Choi, “Fetal QRS detection based on convolutional neural networks in noninvasive fetal
electrocardiogram,” inProceedings of the International
Con-ference on Frontiers of Signal Processing, Poitiers, France, September 2018.
[25] A. Alexandersson, T. Steingrimsdottir, J. Terrien et al., “The
Icelandic 16-electrode electrohysterogram database,”
Scien-tific Data, vol. 2, no. 1, Article ID 150017, 2015.
[26] H. Maul, W. L. Maner, G. Olson, G. R. Saade, and R. E. Garfield, “Non-invasive transabdominal uterine elec-tromyography correlates with the strength of intrauterine
pressure and is predictive of labor and delivery,”The Journal
of Maternal-Fetal & Neonatal Medicine, vol. 15, no. 5, pp. 297–301, 2004.
[27] L. K. Millar, L. DeBuque, and D. A. Wing, “Uterine con-traction frequency during treatment of pyelonephritis in
pregnancy and subsequent risk of preterm birth,”Journal of
Perinatal Medicine, vol. 31, no. 1, pp. 41–46, 2003.
[28] K. Horoba, J. Jezewski, T. Kupka, A. Matonia, R. Czabanski, and D. Roj, “Electrical activity of uterus as reliable in-formation on contractions during pregnancy and labour,”
Information Technologies in Medicine, Advances in Intelligent Systems and Computing, pp. 353–366, Springer, Berlin, Germany, 2016.
[29] Y. Wang, P. Gao, Q. Qiu et al., “Comparison of the onset of uterine contractions determined from tocodynamometry and
maternal perception,” inProceedings of the 39th Annual
In-ternational Conference of the IEEE Engineering in Medicine and Biology Society, pp. 1376–1379, Jeju Island, Korea, July 2017.
[30] N. Vinod, G. E. Hinton, and Rectified, “Linear units improve
restricted Boltzmann machines,” inProceedings of the 27th
International Conference on Machine Learning (ICML-10), Haifa, Israel, June 2010.
[31] A. Krizhevsky, I. Sutskever, and G. E. Hinton, “ImageNet classification with deep convolutional neural networks,”
Communications of the ACM, vol. 60, no. 6, pp. 84–90, 2017. [32] R. D. Labati, E. Muñoz, V. Piuri, R. Sassi, and F. Scotti, “Deep-ECG: convolutional neural networks for ECG biometric
recognition,”Pattern Recognition Letters, vol. 126, pp. 78–85,
2018.
[33] W. Liu, M. Zhang, Y. Zhang et al., “Real-time multilead convolutional neural network for myocardial infarction
de-tection,”IEEE Journal of Biomedical and Health Informatics,
vol. 22, no. 5, pp. 1434–1444, 2018.
[34] S. Mehdi and A. M. Chehel, “Detection of preterm labor by
partitioning and clustering the EHG signal,” Biomedical
Signal Processing and Control, vol. 45, pp. 109–116, 2018. [35] S. E. Zagami, N. Golmakani, A. R. Saadatjoo, N. Ghomian,
and B. Baghbani, “The shape of uterine contractions and labor
progress in the spontaneous active labor,”Iranian Journal of
Medical Sciences, vol. 40, no. 2, pp. 98–103, 2015.
[36] D. Hao, J. Peng, Y. Wang, J. Liu, X. Zhou, and D. Zheng, “Evaluation of convolutional neural network for recognizing
uterine contractions with electrohysterogram,”Computers in
Hindawi www.hindawi.com International Journal of Volume 2018
Zoology
Hindawi www.hindawi.com Volume 2018 Anatomy Research InternationalPeptides
Hindawi www.hindawi.com Volume 2018 Hindawi www.hindawi.com Volume 2018 Journal of Parasitology ResearchGenomics
International Journal of Hindawi www.hindawi.com Volume 2018 Hindawi Publishing Corporationhttp://www.hindawi.com Volume 2013 Hindawi www.hindawi.com
The Scientific
World Journal
Volume 2018 Hindawi www.hindawi.com Volume 2018Bioinformatics
Advances inMarine Biology
Journal ofHindawi www.hindawi.com Volume 2018 Hindawi www.hindawi.com Volume 2018