Capital Structure Composition and Financial Performance of
Food and Beverage Firms in Nigeria
Asian A Umobong Diette- Abayeh Ayebanengiyefa Department of Accounting, Faculty of Management Sciences
University of Port Harcourt, Port Harcourt - Nigeria
Abstract
The study examined capital structure composition and Financial performance of Food and Beverage firms using Secondary data obtained from Nigeria stock exchange. Leverage composition; Short term debt to total Asset, Long Term debt to total asset and debt-equity ratio were regressed against market performance proxies earnings yield, price/earnings ratio and Tobin Q. Variables were subjected to Hausmann test for selection of appropriate model. Findings indicate Significant positive relationship between short term debt over total asset ratio and Tobin Q, Long term debt to total asset relate significantly positively with Tobin Q and earnings yield Also, there is Significant positive relationship between Debt Equity ratio and Earnings yield. We also found significant negative relationships between Short term debt and Earnings yield, Long term debt and P/E ratio, and between Debt Equity ratio and Tobin Q. Additionally, we found insignificant negative relationship between Short term debt and Price earnings ratio and between Debt equity ratio and P/E ratio. Also, a shift in capital structure composition from STD/TA to LTD/TA has a positive effect on TBQ which is statistically significant and a Shift from LTD/TA to STD/TA still maintains an equally positive effect on TBQ. However, it is more rewarding for the firm to shift to more long-term debt in its capital structure as it has higher effect on TBQ. A shift from TD/TA to LTD/TA has a significant positive effect on Earnings Yield and a shift from LTD/TA to STD/TA has a positive insignificant effect on EY. It will be rewarding for the firms to increase their earnings yield by shifting from STD to LTD. Based on findings, we conclude different compositions of leverage have different effects on market valuation of firms. We recommend Firms should optimally use LTD to increase market valuation. And should also examine capital structure composition to ascertain which of the combination maximises firm value
Keywords: Capital Structure Composition, Tobin Q, Earnings Yield, Debt/Equity ratio, Price Earnings Ratio
DOI: 10.7176/EJBM/11-24-01
Publication date: August 31st 2019
1.0 Introduction
The issue of capital structure is daily discussed by academics, corporate executives, investors, analysts and researchers. The reason is not far-fetched. The way a firm is financed is believed by some authors to influence its performance and value. Although another group of proponents oppose the idea that the financing need of a firm does not impact on firm value or performance. The controversy generated by these arguments and opposing views dates back many decades and is yet to abate due to the strategic role firms play in the provision of goods and services, income generation, source of tax revenue to the government and employment. Firms generally is an engine that drives economic development and its successes and failure is of interest to many.
People invest to get the best financial return out of such investments. Therefore, managers should always have criterion by which they should evaluate their financing decisions to make sure that the above objectives are realized. Ramesh (1987) suggests that this criterion should be in the best interest of equity holders who are the residual owners of the firm. According to Gapenski (1987) one of the most perplexing issues facing financial managers or experts is the relationship between capital structure and the firm’s value. Financing and investment are two major decision areas in a firm. In the financing decision the manager is concerned with determining the best financing mix or capital structure for his firm. Capital structure could have two effects. First, firms of the same risk class could possibly have higher cost of capital with higher leverage. Second, capital structure may affect the valuation of the firm, with more leveraged firms, being riskier, being valued lower than less leveraged firms. If we consider that the manager of a firm has the shareholders' wealth maximization as his objective, then capital structure is an important decision, for it could lead to optimal financing mix which maximizes the market price per share of the firm.
Modigliani & Miller (1958), in their proposition suggested that the financing mix of equity and debt have no effect on firm value based on assumptions of no tax, no bankruptcy cost, and no transaction cost, equality of borrowing costs, perfect market information and no arbitrage. These assumptions were later relaxed to exclude no tax conditions. Under the condition of corporate income taxes, they agreed that leverage has some impact on value.
Modigliani and Miller who are perhaps the most quoted on capital structure theory and the proponent of the no optimal capital structure school showed that financing decisions do not matter in perfect capital market. They proposed that the firm cannot change the total value of its securities by first splitting its cash flow into different
streams (i.e debts and equity streams). They therefore maintained that the firm’s value is determined by its real assets, not by the securities it issues. A firm’s investment decision is irrelevant if the firm’s investment decisions are taken as given, they argued. According to Lawal (1989) Modigliani & Miller Proposition only holds if the perfect market assumption is made and there are no corporate taxes”. In practice however, there are market imperfections which include corporate taxes, bankruptcy costs, and the type of assets a firm holds. Corporate taxes for instance affect the value of the firm and the maximization of the shareholders wealth and therefore the capital structure of a firm. A geared firm must pay interests on its debt. Interest is tax deductible and therefore shareholders benefit from the reduced level of taxes paid by a geared firm. The risk of bankruptcy also makes the capital structure relevant because there is only so much a firm can borrow as lender would properly evaluate all the risks before lending to a firm. The type of assets to be acquired being used by a company is also relevant to the capital structure decision. Several studies have investigated the relationship between firm’s value, size and leverage. Warner (1977), Chua & McConnel (1982) theorize that large firms cash flows are diversified, thus making them less vulnerable to bankruptcy. Myers (1977) argues that a significant part of any firm’s market value is accounted for by the present value of future growth opportunities. All these factors identified above represent market imperfections which support the school of thought that the capital structure decision is relevant. One of the many objectives of financial managers is to maximize the wealth of shareholders. Shareholders’ wealth maximization depends on issues such as lower cost of capital, generating tax shield benefits from debt financing, reducing the agency costs of debt and equity etc. And all these issues are determined and managed by reaching optimal capital structure. As a result, financial managers strive to ensure the optimal mix of debt and equity in the firm's capital structure. Whether such an optimal capital structure exists or not is debatable and continue to attract attention of diverse interest groups. Of further concern is the different interpretations of capital structure itself and the notion that the asset structure of the firm affects its financing decision thereby exacerbating the controversy of the finance mix of equity and debt This study will attempt to determine if capital structure composition differentiated by the various definitions of capital structure indeed affects market performance of firms. Although the above questions are of paramount importance, academic theories and literatures have not been pragmatic and decisive in providing cogent solutions on such practical questions. Rather, the theories of capital structure and its composition still remain one of the most controversial issues in modern corporate finance. Not only there is no consensus in defining capital structure; there is also no universal accepted theory of capital structure and assumptions of the several conditional theories contradict each other. Furthermore, empirical results show no strong consensus despite decades of intensive researches. Such disagreement over basic empirical results in turn proves disagreement about desirable features for theories. Furthermore, the stage of economic development is noted to influence the choice of financing mix used by the firm operating economies. Thus, studies embarked on advanced countries and vice versa cannot be generalized across international boundaries. Rajan & Zingales (1995) in a study of G-7 countries and emerging economics suggest that there were peculiar attributes in the capital structures of firms in different countries. This finding limit generalization of research findings across continents and countries. The peculiarity of Nigeria and its stage of economic development, size of the firm, weak institutional framework, political factors and ease of raising finance could influence financing mix of the firm and ultimately limit the firm from reaching optimal capital structure if indeed it exists thereby impacting on firm performance. It is therefore necessary that as the economy is evolving more research is carried out in this area considering the gargantuan role firms play in economic development of the country in terms of Gross domestic product, mitigating inflation and provision of employment. The aim of the study is to determine the nature of relationship between capital structure composition and financial performance.
2.0 Literature
2.1 Theoretical Framework 2.1.1 Frictionless theory
In 1958, Modigliani and Miller demonstrated that the firm's choice of financing is irrelevant to the determination of its value. They assumed that capital markets are frictionless, individuals can borrow and lend at the risk-free rate, there are no bankruptcy costs, firms issue only risk-free debt and risky equity, all firms are in the same risk class, there is no growth, expectations are homogeneous (or, there is information symmetry), and agency costs are absent. The value version of their Proposition 1 is that the value of a firm is given by its real assets. Therefore VL = VU where VL is the value of the levered firm, and VU that of the unlevered firm. A firm cannot change the total value of its securities merely by splitting its cash flows into different streams. In this form, the MM Proposition I, the principle of value additivity in reverse, and is known as the law of conservation of value. The value of an asset is preserved regardless of the nature of the claims against it (Brealey, 1988). The MM proposition is a special case of the proposition developed by Coase (1960) that in the absence of contracting costs and wealth effects, the assignment of property rights leaves the use of real resources unaffected (Smith, 1985). The cost of capital version of this proposition, as originally stated by MM, is that "the average cost of
capital to any firm is completely independent of its capital structure and is equal to the capitalization of a pure equity stream of its class" (Modigliani, 1958). By varying only, the assumption of risk-free debt to consider risky debt, the same propositions can be shown to hold good. Stiglitz (1969) used the state-preference framework to prove this. Rubinstein (1973) also proved this in a Capital Asset pricing model (CAPM). Based on MM proposition 1, there can be no optimal capital structure for a firm. Modigliani & Miller (1958) using cross-section equations on data taken from 43 electric utilities during 1947-1948 and 42 oil companies during 1953 found that there is no gain from leverage, lending support to their theory
2.1.2 Modigliani and Miller’s Proposition 2
The original MM Proposition 2 can be slightly rephrased as: The expected rate of return on equity of a levered firm increases in proportion to the debt-equity ratio, expressed in market values (Brealey, 1988). Therefore,
ke = r + (r-kd) B/_S
where ke is the cost of equity, r is the discount rate for an all-equity firm, _B is the change in B, i.e., change in the market value of debt, _S is the change in S, i.e., change in the market value of stock, or stockholders' wealth. Hamada (1972) combined the Modigliani-Miller theory and the CAPM to test this proposition (Copeland, 1988). Ultimately, he was able to derive indirect evidence to confirm that the cost of equity does increase with higher financial leverage.
2.1.3 Agency Theory
Agency theory developed by Jensen and Meckling (1976) also suggest for an optimal debt level in capital structure by minimizing the agency costs arising from the divergent interest of managers with shareholders and debt holders. Jensen & Meckling (1976) suggest that either ownership of the managers in the firm should be increased to align the interest of mangers with that of the owners or use of debt should be motivated to control managers’ tendency for excessive perk consumptions. Jensen (1986) presents agency problem associated with free-cash flow. He suggests that free cash flow problem can be somehow controlled by increasing the stake of managers in the business or by increasing debt in the capital structure, thereby reducing the amount of “free” cash available to managers. There are several capital structure theories like signaling theory and pecking order theory those apply notion of asymmetric information with an attempt to explain the role asymmetric information plays in determining the optimal capital structure.
2.1.4 Signaling Theory
Ross (1977) laid down the foundations of signaling theory and its various extensions. He assumes that managers being the insiders have a better knowledge about the true distribution of future returns of the firm whereas investors do not. According to Ross, investors interpret larger levels of leverage as a signal of the firm’s current stable income, high future cash flows and managers’ confidence about the performance of their own firm. Accordingly, Ross (1977) concludes that investors take larger levels of debt as a signal of higher quality and that profitability (as a proxy of quality performance) and leverage are thus positively related.
2.1.5 Pecking Order Theory
On the other hand, pecking order theory, suggested by Myers & Majluf (1984), who captured the effect of asymmetric information upon the mispricing of new securities, says there is no well- defined target debt ratio. They argue that investors generally perceive that managers are better informed of the price sensitive information of the firms. Investors’ perception is such that managers issue risky securities when they are overpriced. This perception of investors leads to the underpricing of new equity issue. Sometimes this underpricing becomes so severe that it causes substantial loss to the existing shareholders. To avoid the problem arising from information asymmetry firms fulfill their financing needs by preferring retained earnings as their main source of financing, then debt and finally external equity financing as a last resort. Capital structure is thus arranged by a hierarchy of preferences for the issuance of new capital. This has been termed as “Pecking Order Theory”.
2.1.6 Trade-Off Theory
According to this model, optimal capital structure does exist. A firm sets its target debt level and then gradually moves towards it. This theory asserts that a firm’s optimal debt-equity ratio is achieved at the point when the marginal present value of the tax on additional debt is equal to the increase in the present value of financial distress costs. Under this theory, a firm’s target leverage is driven by three competing forces: (i) taxes, (ii) costs of financial distress (bankruptcy costs), and (iii) agency costs. Both tax-based and agency-cost-based models belong to the static tradeoff models as supported by Kraus & Litzenberger (1973),
2.2 Conceptual Framework 2.2.1 Capital Structure
Weston & Brigham (1979) refer to Capital structure as the persistent funding through long term debt, preferred stock and net worth. It is also a mixture of long term sources of funding which includes equity, preference capital and debt (Van Hone & Wackomic, 1995). This perspective is supported by Saad (2010) with the assertion that capital structure consists of component of equity, debt and hybrid securities. There are many forms of
combination which are perceived to constitute capital structure. These includes; full equity without debt, full debt and no equity and a mix of equity and debt (Dara & Sola 2010). This implies that a firm can be levered or unlevered. From these three alternative options one is that of unlevered firm. That is the firm that shows the advantage of leverage (of any). Option two is that of a firm that has no equity capital which realistically does not exist.
2.2.2 Firms Performance
The notion of performance is a controversial issue in finance largely because of its multi-dimensional meanings. Many experts define financial performance in different ways. According to (Metcalf & Titard, 1976) firm performance is the act of performing financial activity. In broader sense, financial performance refers to the degree to which financial objectives being or has been accomplished or it is used as a general measure of a firm's overall financial health over a given period of time, and can be used to compare similar firms across the same industry or to compare industries or sectors in aggregation .Financial performance (reflected in profit maximization, maximizing return on asset and maximizing shareholders return based on the firm’s efficiency( Chakravarthy ,1989. There is no agreed yardstick for evaluation of performance. Some authors use accounting measures (Oladeji & Olokoyo, 2014; Salawu, 2009, Muritala, 2012) whilst others use market-based measures. (Awunyo-Victor & Bandu,2012; Gropp and Heider,2009). Yet some other authors use mixed methods (accounting & market-based methods). The usual argument advanced by users of market-based method is that accounting based methods are historical while market-based method is futuristic and users apart from being interested in the future prospects of the firm should gauge the ability of the firm to exist as a going concern.
2.3 Empirical Review
The controversy surrounding capital structure and the firm is yet to abate despite researches across the globe. Most of the research outcome are conflicting with no consensus as some studies found positive relation between capital structure and performance whilst some found negative or no relation. Many studies of outside the African continent followed the same pattern.
In a study of Japanese firms Pushner (1995) found negative relation of leverage with total productivity factor (firm performance). In UK, Nickell& Nikolitas (1999) found positive relation of debt and performance. In Jordan, Zeitun (2007) used accounting and market-based methods as financial performance proxies. The result shows that a firm’s capital structure has a significant negative impact on firm’s performance. The study found that short term debt to total asset s (STDTA) as leverage measure has a significantly positive effect on market performance measure (Tobin’s Q) contrary to other measure of leverage such as total debt and long-term debt to total assets. Majumdar & Chhibber (1999) in a study of Indian firms observed negative correlation of leverage with performance. Also, Khan (2012) while studying Patiskani firms found negative and significant relationship between financial leverage measured by short-term debt to total assets (STDTA) and total debt to total assets (TDTA) and firm performance measured by return in assets (ROA), gross profit margin (GPM) and Tobin Q. Nor & Fatihah (2012) found significant negative relation between leverage and Malaysian firm’s performance. Soumadi & Hayajnch (2013) studied Jordanian firms and revealed that capital structure associated negatively and statistically with firm performance. Umar, Tanreer, Aslam & Sayid (2012) while studying firms in Pakistan observed that Current Liabilities to total asset, Long Term liabilities to total asset have significant positive relationship with Earnings per share and net profit margin whereas price earnings ratio shows negative relationship with current liabilities to Total assets and positive relationship is found with long term liabilities to total Asset. Hasan, Ahsan, Rahaman & Alam (2014) in a study of Bangladesh firms during the period of 2007-2012 found earnings per share negatively significantly related to short term debt while significantly negatively relating to long term debt, conversely there is no statistically significant relation exits between leverage and firm performance as measured by ROE and Tobin’s Q. Khalaf (2013) found short term and long-term debt negatively and insufficiently relate with ROA and profit margin
Other studies contrasted with the result of negative correlation of leverage with performance. The study in USA by Berger & Bonaccorsi di Patti (2006) and the study in New Zealand by Margaritis & Psillaki (2007) confirm higher leverage associate positively with better firm performance. A study in Amman by Taani (2013) found that bank performance measured by net profit, return on capital employed and net interest margin related significantly and positively with total debt, whereas total debt is found insignificant with return on equity in the banking industry of Jordan. Muhammad, Shan & Islam (2014 found positive correlation between debt to equity and performance variable (GPM and NPM) of Pakistani firms.Nimalthasan & Brabeta (2010) evaluate the relationship between capital structure and profitability of firms in Sri Lanka and found positive significant relation of gross profit and operating profit with leverage. Ali & Iman (2011) observed that EPS and Tobin’s Q (accounting and market-based measures) are positively related with leverage, while ROA has a negative relation. They also reported no significant relationship between ROE and leverage. These studies outside Africa showed mixed result.
Ghanaian firms for the period 1998-2002 witnessed a significantly positive relation among ROE and the short-term debt and total debt ratio while a negative relation with long short-term debt. Adeyemi and Abor (2011) found significant positive relationship between leverage and firm value. Abor (2007) studied Ghana and South African Firms and revealed a significant negative relationship between all the measures of leverage, firm size and firm performance in Ghana. Conversely the study found a significant positive relations of short term debt, firm size and return on asset in South African firms. Ebaid (2009) studied Egyptian firms using accounting measures of performance and found no relation with ROA. Gross profit margin and ROE on leverage. Samuel (2013) also studied South African firms and found positive relation of ROA and Tobin’s Q to leverage. Salawu (2007) in a study of Nigerian. firms found leverage found negatively correlated with profitability. The size of the firm was however found to be positively correlated with total debts. Olokoyo (2012) also carried out a study of Nigeria firms and observed that a firm’s leverage has a significant negative impact in firms accounting performance measure (ROA). An interesting finding is that any leverage measures have a positive and highly significant relationship with the market performance measure Tobin’s Q. The study of Onaolapo,Adekunle & Kajola(2010) collaborates the study of Olokoyo (2012) and found a significantly negative impact on the firm’s financial measures (Return on Asset (ROA) and Return on Equity (ROE). Chandrasekharan (2012) conducted a study of Nigerian firms (2007-2011) the study revealed that firm size, growth and age are positively significant with the debt ratio of the firm, whereas profitability and tangibility are not. Adeyemi & Oboh, (2011) study revealed a positively significant relationship between a firm’s choice of capital and firm value in Nigeria. Omorogie & Erah (2010) study revealed firm performance correlate positively with leverage.
Also, the empirical review of most studies on capital structure and firm performance from Sub-Saharan African countries (such as Ghana, South Africa, Egypt and Nigeria) revealed that a relationship exists between capital structure and firm performance; without consensus on the nature of the relationship across these countries. Some of the studies show positive relationship (Abor,2005; Simon-Oke & Afolabi, 2008; Ishola, 2008; Salawu, 2009; Omorogie & Erah, 2010; Adeyemi and Oboh, 2011 and Samuel, 2013); while other revealed negative relationship (Ebaid,1997; Abor,2007; Onaolapo et al.,2010).
Some researchers observed weak to no relation (Myroshnichenko ,2004; Zheka ,2010, Talavera et al. ,2011;). Grechaniuk (2009) & Ibrahim (2009) in a study of Egyptian firms between 1997-2005 found that performance has weak to no relationship with capital structure choice. Based on the outcome of conflicting results there is therefore a gap for further studies.
Gaps in Literature
Considering the empirical reviews, no works have been done on the capital structure composition and financial performance in the food and beverage firms in Nigeria. This study fills this gap.
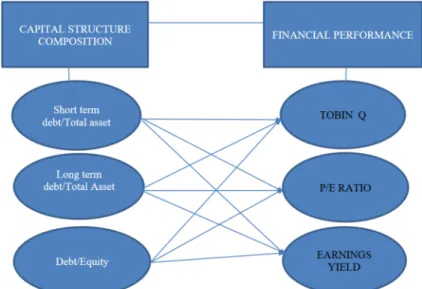
Conceptual Figure
FIG 1 : Conceptualized Framework of Capital Structure Composition and Financial Performance of Food and Beverage Firms in Nigeria
Methodology 3.1 Research Design
The study adopted the ex-post facto design because the researcher was after the fact, where observations made about the sample elements were about events that have indeed taken place already.
Data
This study is based on secondary data obtained from financial statements of food and leverage firms listed on the Nigeria Stock Exchange. Data were sourced from NSE library and from the website of individual firms. The population of the study consist of manufacturing firms listed on the Stock exchange. However, the sample size is all the firms listed under the food and Beverage subsector. The study required no sample size determination because it uses census method of sampling. Firms with incomplete data were eliminated to prevent pollution data which could lead to inconsistent result. However, the total number of firms used represent 95% of firms in the Food and Beverage subsector in terms of number, capital outlay, Market capitalization, asset size and earnings
Variables Independent
The following variables are chosen to represent different composition of capital structure a) total debt/total asset
b) long term debt/total asset c) Debt/Equity
Dependent variable
The dependent variable for this study are Tobin q
Tobin Q (TQ) = ratio expresses the relationship between market value of a firm and the cost of replacing the asset.
We adopt Chung and Pruitt’s approximating formulation of Tobin’s Q = MVE + PS +DEBT/TA Where:
MVE = Firm’s stock price multiplied by number of outstanding equity shares. PS = Value of a firm’s outstanding preferred stock on liquidation
Debt = Sum of short term liabilities minus short term assets plus the book value of long term-debt; TA = Total book value of all assets.
Price earnings ratio
Price to Earnings Ratios (P/ER)
This ratio is a yardstick for measuring times share price cover earnings per share in a particular period thus providing an indication for payment by investors for each financial unit of measurement. The method is popular in judging or evaluating financial results. The ratio gives an indication of market perception of a firm’s share and is calculated using current price and earnings.
PE ratio = Market price per share Earnings per share
Earnings Yield: This denotes an inverse of P/E ratio and measure the relationship between market price and earnings o Earnings yield are the earnings per share for the most recent 12-months period divided by the current market price per share.
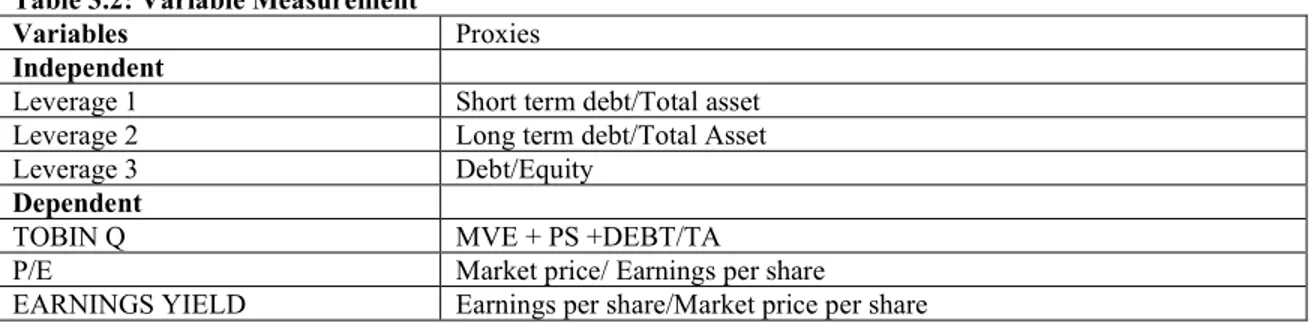
Earnings Yield = Earnings per share Market price per share Table 3.2: Variable Measurement
Variables Proxies
Independent
Leverage 1 Short term debt/Total asset
Leverage 2 Long term debt/Total Asset
Leverage 3 Debt/Equity
Dependent
TOBIN Q MVE + PS +DEBT/TA
P/E Market price/ Earnings per share
EARNINGS YIELD Earnings per share/Market price per share
Model Specification
The relationship between the dependent and independent variable, the disturbance, co-efficient and intercepts for capital structure composition and market performance for the purpose of the research is as stated below: TBQ = 0 + 1 LEVER1 +2 LEVER2+3 LEVER3+ U1,t - (i)
PER = 0 + 1 LEVER1 +2 LEVER2+3 LEVER3+ U2,t- (ii)
ERY = w0 + w1 LEVER1 + w2 LEVER2+ w3LEVER3+ U3,t - (iii)
Where TBQ is TOBIN Q, PER is price earnings ratio and ERY is earnings yield. On the other hand, total debt/total asset, long term debt/total asset Debt/Equity are LEVER1, LEVER2 and LEVER3 respectively while: Ui,t = Error term, 0, 0, wo, = intercepts , 1, 1, w1 = slope coefficients
4.1Result
4.1.1 Descriptive statistics
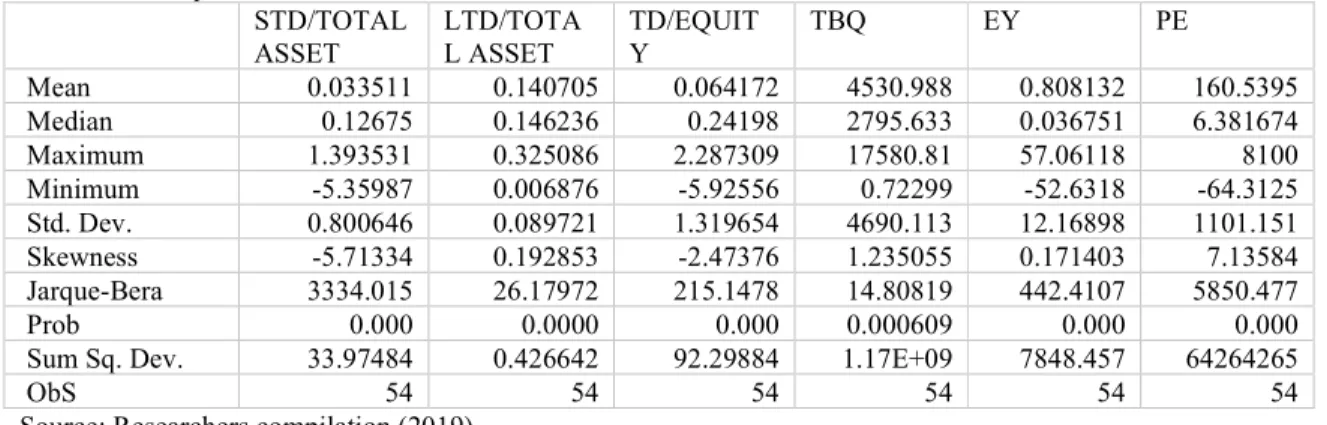
The table below depicts descriptive statistics based on data analysis of the variables of study Table 1: Descriptive Statistics
STD/TOTAL ASSET LTD/TOTA L ASSET TD/EQUIT Y TBQ EY PE Mean 0.033511 0.140705 0.064172 4530.988 0.808132 160.5395 Median 0.12675 0.146236 0.24198 2795.633 0.036751 6.381674 Maximum 1.393531 0.325086 2.287309 17580.81 57.06118 8100 Minimum -5.35987 0.006876 -5.92556 0.72299 -52.6318 -64.3125 Std. Dev. 0.800646 0.089721 1.319654 4690.113 12.16898 1101.151 Skewness -5.71334 0.192853 -2.47376 1.235055 0.171403 7.13584 Jarque-Bera 3334.015 26.17972 215.1478 14.80819 442.4107 5850.477 Prob 0.000 0.0000 0.000 0.000609 0.000 0.000
Sum Sq. Dev. 33.97484 0.426642 92.29884 1.17E+09 7848.457 64264265
ObS 54 54 54 54 54 54
Source: Researchers compilation (2019)
From the descriptive statistics of the variables as shown in table 1 above, it is observed that the mean for STD/TA is 0.033 with a minimum and maximum ratio of -5.369 and 1.3935 respectively and standard deviation stood at 0.8007. The Jacque-Bera-statistic stood at 3334.015 and the p-value of 0.00 which indicates that the data is normally distributed at 5% level of significance (p<0.05) and as such selection bias is unlikely in the sample. It is observed that the mean LTD/TA ratio stood at 0.140 which is observed to be higher than the STD/TA ratio indicating that long term debt composition in capital structure is higher than that of short term debt with a maximum and minimum value of 0.0086 and 0.325 respectively. The Jacque-Bera-statistic is 26.179 and the p-value of 0.00 and indicates that the data is normally distributed at 5% level of significance (p<0.05) and as such selection bias is unlikely in the sample. It is observed that the mean TD/EQUITY ratio is 0.0642 with a maximum and minimum value of 2.287 and -5.9256 respectively. The standard deviation is 1.3296 with a Jacque-Bera-statistic of 215.1478 and p-value of 0.00 which indicates that the data is normally distributed at 5% level of significance (p<0.05) and as such selection bias is unlikely in the sample. TBQ has mean value of 4530.988 with a maximum and minimum value of 17580.81 and 0.723 respectively. The standard deviation is 4690.113 which is very high and hence indicating the presence of high volatility in the TBQ values across the distribution. The Jacque-Bera statistic of 12.808 and p-value of 0.00 indicates that the presence of outliers is unlikely in the data. EY has mean value of 0.808 with a maximum and minimum value of 57.0612 and -52.632 respectively. The standard deviation is 12.1689 and the Jacque-Bera statistic of 442.4107 and p-value of 0.00 indicates that the presence of outliers is unlikely in the data. PE has mean value of 160.5393 with a maximum and minimum value of 8100 and -64.3125 respectively. The standard deviation is 1101 which is very high indicating the presence of high volatility in the PE values across the distribution. The Jacque-Bera statistic of 5850 and p-value of 0.00 indicates that the presence of outliers is unlikely in the data.
4.1.2 Pearson Correlation
Table 2: Pearson Correlation Results
STD/TA LTD/TA TD/EQUITY TBQ EY PE
STD/EQUITY 1.0000 LTD/EQUITY 0.3127 1.0000 TD/EQUITY 0.6322 0.5410 1.0000 TBQ 0.1691 0.1605 0.0762 1.0000 EY -0.0388 0.1255 0.2429 -0.0507 1.0000 PE 0.0617 -0.0523 0.2218 0.0993 -0.0098 1.0000
Source: Researchers compilation (2019)
Table 3 above presents the Pearson correlation coefficient result for the variables. The positive correlations suggest that increases in one variable is associated with increases in the other and vice-versa. Also, negative correlations suggest than an inverse association between the variables. Though it should be noted that correlations do not necessarily suggest functional dependence between the variables. As observed, TBQ is positively correlated with STD/TA (r=0.1691), LTD/TA (r=1605) and with TD/EQUITY (r=0.2429). EY is negatively correlated with STD/TA (r=-0.0617), LTD/TA (r=-0.0523) but positively with TD/EQUITY (r=0.2218). TBQ is positively correlated with STD/TA (r=0.1691), LTD/TA (r=1605) and with TD/EQUITY (r=0.2429).
4.1.3 Variance Inflation Factor Table 3: Variance Inflation Factor Test
Variable VIF
STD/TA 1.35
LTD/TA 1.17
TD/EQUITY 1.11
Source: Researcher’s compilation (2018)
The variance inflation factor (VIF) explains how much of the variance of a coefficient estimate of a regressor has been inflated, because of collinearity with the other regressors. Essentially, VIFs above 10 are seen as a cause of concern as observed, none of the variables have VIF’s values more than 10 and hence none gave serious indication of multicollinearity.
4.1.4 Panel Regression Resul- Tobin Q and Capital structure Table 4. Panel Regression Result: TBQ and Capital Structure
Variable Aprori Sign TBQ Shift from STD to LTD Shift from LTD to STD C 4215.56* (283.91) {0.000) 3868.19* (186.644) {0.000} 5129.35* (295.14) {0.000} TD/Equity + -1898.738* (325.4) {0.0000} -875.641 (100.182) {0.000} -2518.12* (347.93) {0.000} STD/TA + 1397.54* (370.908) {0.000} 2358.76* (472.55) {0.000} LTD/TA + 6167.54* (1220.17) {0.000} 7768.504* (696.182) {0.000} R2 0.8458 0.8433 0.8165 Adjusted R2 0.7880 0.7911 0.7554 f-statistics 14.63 16.1532 13.354 Prob 0.000 0.000 0.000 Durbin Watson 2.06 2.11 2.1 Hausman 0.043 Breusch-Pagan-LM 0.002 0.003 0.022 Peaseran Test 0.0018 0.005 0.029 Durbin-Watson 2.06 2.11 2.1
Ramsey Reset test 0.410 0.8721 0.120
Source: Researchers compilation (2019)
The regression results examine the impact of capital structure composition on firm’s performance. The capital structure compositions employed in the study are TD/EQUITY, STD/TA and LTD/TA while the measures for financial performance are TBQ, EY and PE respectively. The regression result presented in table 1 shows the effect capital structure composition TBQ. The hausman model selection test is conducted and the results supports the use of the fixed effects model for the estimation. As observed, the R2 is impressive at 84.58%
which indicates a good fit with an adjusted value of 0.7880. The f-statistics is significant at 5% which suggest that the hypothesis of a significant linear relationship between the dependent and independent variables cannot be rejected. It is also indicative of the joint statistical significance of the model. The analysis of coefficients reveals that TD/Equity which is the composite ratio is significant (p=0.000) but with a negative beta (-1898.738). STD/TA which is the short-term component is statistically significant (p=0.000) and has a positive effect (1397.5) on TBQ and LTD/TA which is the long-term component is also statistically significant (p=0.000) and has a positive effect (6167.5) on TBQ. In the estimations, we also examine a capital structure composition shift to LTD/TA given that the aggregate composite ratio TD/Equity is controlled for. This is to examine the effect on TBQ if the there is a shift towards more long-term options rather than short term. The results show that a shift from STD/TA to LTD/TA has a positive effect (7768.5) on TBQ which is statistically significant at 5% (p=0.000). In the estimations, we also examine a capital structure composition shift to STD/TA given that the aggregate composite ratio TD/Equity is controlled for. The results show that a shift from LTD/TA to STD/TA still maintains an equally positive effect (2358.76) on TBQ which is statistically significant at 5% (p=0.000). Though on the overall the effect of a shift to LTD/TA is higher than that of a shift to STD/TD and hence companies are advised to consider more long-term capital structure options in the light of adjustments to capital
structure compositions. The diagnostics results reveal that the presence of cross-sectional dependence in the residuals is unlikely as all test conducted (Breusch-Pagan-LM and Peaseran) all rejects the null hypothesis of cross-sectional dependence in the residuals with p-values less than 0.05. The Ramsey reset test for model specification confirms that correct functional form specifications of the models. The durbin Watson test value for all estimations suggest the presence of first order serial correlation is unlikely in the models.
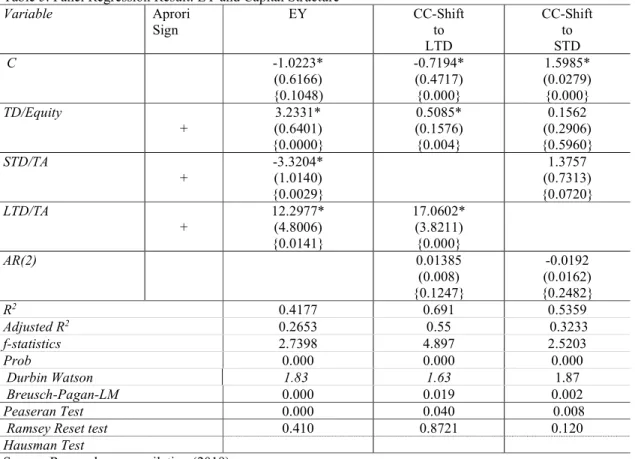
Table 5. Panel Regression Result: EY and Capital Structure
Variable Aprori Sign EY CC-Shift to LTD CC-Shift to STD C -1.0223* (0.6166) {0.1048) -0.7194* (0.4717) {0.000} 1.5985* (0.0279) {0.000} TD/Equity + 3.2331* (0.6401) {0.0000} 0.5085* (0.1576) {0.004} 0.1562 (0.2906) {0.5960} STD/TA + -3.3204* (1.0140) {0.0029} 1.3757 (0.7313) {0.0720} LTD/TA + 12.2977* (4.8006) {0.0141} 17.0602* (3.8211) {0.000} AR(2) 0.01385 (0.008) {0.1247} -0.0192 (0.0162) {0.2482} R2 0.4177 0.691 0.5359 Adjusted R2 0.2653 0.55 0.3233 f-statistics 2.7398 4.897 2.5203 Prob 0.000 0.000 0.000 Durbin Watson 1.83 1.63 1.87 Breusch-Pagan-LM 0.000 0.019 0.002 Peaseran Test 0.000 0.040 0.008
Ramsey Reset test 0.410 0.8721 0.120
Hausman Test
Source: Researchers compilation (2019)
The regression result presented on table 5 shows the effect capital structure composition on EY. The hausman model selection test is conducted and the results supports the use of the fixed effects model for the estimation. The Cochrane-Orcutt –AR procedure is employed to address possible serial correlation problems in the model. As observed, the R2 is 41.77% with an adjusted value of 0.2653. The f-statistics is significant at 5%
which suggest that the hypothesis of a significant linear relationship between the dependent and independent variables cannot be rejected. It is also indicative of the joint statistical significance of the model. The analysis of coefficients reveals that TD/Equity which is the composite ratio is has a significant (p=0.000) and positive (3.233) effect on EY. The effect of STD/TA is statistically significant (p=0.000) and negative (-3.3204) and LTD/TA which is the long-term component is also statistically significant (p=0.000) but with a positive effect (12.2977) on EY. In the estimations, we also examine a capital structure composition shift to LTD/TA given that the aggregate composite ratio TD/Equity is controlled for. This is to examine the effect on EY if the there is a shift towards more long-term options rather than short term. The results show that a shift from STD/TA to LTD/TA has a positive effect (17.0802) on EY which is statistically significant at 5% (p=0.000). However, the shift from LTD/TA to STD/TA has a positive effect (1.3757) which is not statistically significant at 5% (p=0.0720). Again, the result supports that capital structure compositions adjustments should be in the direction of longer term financing options. The diagnostics results reveal that the presence of cross-sectional dependence in the residuals is unlikely as all test conducted (Breusch-Pagan-LM and peaseran) all rejects the null hypothesis of cross-sectional dependence in the residuals with p-values less than 0.05. The Ramsey reset test for model specification confirms that correct functional form specifications of the models. The durbin Watson test value for all estimations suggest the presence of first order serial correlation is unlikely in the models.
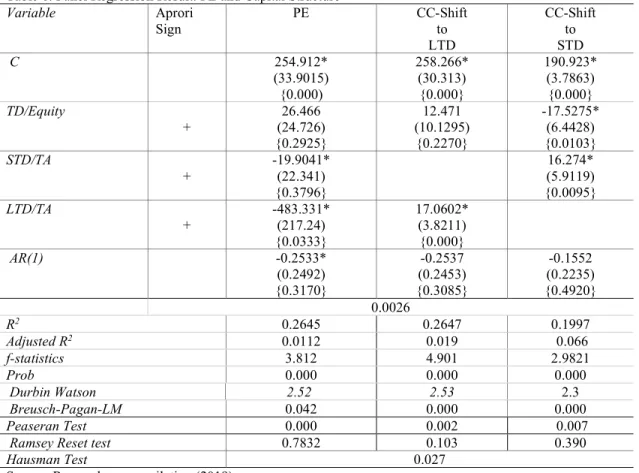
Table 6. Panel Regression Result: PE and Capital Structure Variable Aprori Sign PE CC-Shift to LTD CC-Shift to STD C 254.912* (33.9015) {0.000) 258.266* (30.313) {0.000} 190.923* (3.7863) {0.000} TD/Equity + 26.466 (24.726) {0.2925} 12.471 (10.1295) {0.2270} -17.5275* (6.4428) {0.0103} STD/TA + -19.9041* (22.341) {0.3796} 16.274* (5.9119) {0.0095} LTD/TA + -483.331* (217.24) {0.0333} 17.0602* (3.8211) {0.000} AR(1) -0.2533* (0.2492) {0.3170} -0.2537 (0.2453) {0.3085} -0.1552 (0.2235) {0.4920} 0.0026 R2 0.2645 0.2647 0.1997 Adjusted R2 0.0112 0.019 0.066 f-statistics 3.812 4.901 2.9821 Prob 0.000 0.000 0.000 Durbin Watson 2.52 2.53 2.3 Breusch-Pagan-LM 0.042 0.000 0.000 Peaseran Test 0.000 0.002 0.007
Ramsey Reset test 0.7832 0.103 0.390
Hausman Test 0.027
Source: Researchers compilation (2019)
The regression result presented on table 6 shows the effect capital structure composition on EY. The hausman model selection test is conducted and the results supports the use of the fixed effects model for the estimation. The Cochrane-Orcutt –AR procedure is employed to address possible serial correlation problems in the model. As observed, the R2 is 26.45%. The f-statistics is significant at 5% which suggest that the hypothesis
of a significant linear relationship between the dependent and independent variables cannot be rejected. It is also indicative of the joint statistical significance of the model. The analysis of coefficients reveals that TD/Equity which is the composite ratio is not significant (p=0.2925) but has a positive (26.466) effect on PE. The effect of STD/TA is not statistically significant (p=0.379) though negative (-19.9041) and LTD/TA which is the long-term component is statistically significant (p=0.0333) but with a negative effect (-483.33) on EY. In the estimations, we also examine a capital structure composition shift to LTD/Equity given that the aggregate composite ratio TD/Equity is controlled for. This is to examine the effect on PE if the there is a shift towards more long-term options rather than short term. The results show that a shift from STD/TA to LTD/TA has a positive effect (17.060) on EY which is statistically significant at 5% (p=0.000). The shift from LTD/TA to STD/TA has a positive effect (16.274) and statistically significant at 5% (p=16.274). Here the results suggest that both short term and long-term financing options can be investigated where there is need for adjustments in capital structure composition. The diagnostics results reveal that the presence of cross-sectional dependence in the residuals is unlikely as all test conducted (Breusch-Pagan-LM and peaseran) all rejects the null hypothesis of cross-sectional dependence in the residuals with p-values less than 0.05. The Ramsey reset test for model specification confirms that correct functional form specifications of the models. The durbin Watson test value for all estimations suggest the presence of first order serial correlation is unlikely in the models.
4.2 Hypotheses
HO1: There is no significant relationship between short term debt/total asset ratio and Tobin Q.
Based on Hausmann test result p-value is 0.043<0.005, We reject the null hypothesis which specify that the null hypothesis is more appropriate and accept fixed effect model as appropriate model for the test. The result on table four indicate a positive co-efficient of 1397.54 and p-value of 0.000 < 0.05 level of significance. Based on output, the hypothesis of no significant relationship between short term debt over total asset ratio (Leverage 1) and Tobin q is rejected. Therefore, there is significant relationship between the two variables. The positive
co-efficient implies that an increase in short term debt ratio leads to a corresponding increase in firm market value measured by Tobin q
HO2: There is no significant relationship between short term debt/total asset ratio and P/E ratio
Based on Hausmann test result p-value is 0.027<0.005, We reject the null hypothesis which specify that the null hypothesis is more appropriate and accept fixed effect model as appropriate model for the test. The result on table six indicate a negative co-efficient of -19.9041 and p-value of 0.3796 > 0.05 level of significance. Based on output, the hypothesis of no significant relationship between short term debt over total asset ratio (Leverage 1) and Price earnings ratio is accepted therefore, there is no significant relationship between the two variables. The negative co-efficient implies that an increase in short term debt ratio leads to a decrease in price earnings ratio
HO3: There is no significant relationship between short term debt/total asset ratio and Earnings yield?
Based on Hausmann test result p-value is 0.023<0.005, We reject the null hypothesis which specify that the null hypothesis is more appropriate and accept fixed effect model as appropriate model for the test. The result on table five indicate a negative co-efficient of -3.3204 and p-value of 0.0029 < 0.05 level of significance. Based on output, the hypothesis of no significant relationship between short term debt over total asset ratio (Leverage 1) and earnings yield is rejected therefore, there is significant relationship between the two variables. The negative co-efficient implies that an increase in short term debt ratio leads to a decrease in earnings yield
HO4: There is no significant relationship between long term debt/total asset ratio and Tobin q
Based on Hausmann test result p-value is 0.027<0.005, We reject the null hypothesis which specify that the null hypothesis is more appropriate and accept fixed effect model as appropriate model for the test. The result on table four indicate a positive co-efficient of 6167.54 and p-value of 0.0000 < 0.05 level of significance. Based on output, the hypothesis of no significant relationship between short term debt over total asset ratio (Leverage 2) and tobin Q is rejected Therefore, there is significant relationship between the two variables. The positive co-efficient implies that an increase in long term debt ratio leads to increase in tobin Q
HO5: There is no significant relationship between Long term debt/total asset ratio and P/E ratio
Based on Hausmann test result p-value is 0.027<0.005, We reject the null hypothesis which specify that the null hypothesis is more appropriate and accept fixed effect model as appropriate model for the test.
The result on table 6 above indicate a negative co-efficient of -483.331 and p-value of 0.033 < 0.05 level of significance. Based on output, the hypothesis of no significant relationship between long term debt over total asset ratio (Leverage 2) and price earnings ratio is rejected therefore, there is significant relationship between the two variables. The negative co-efficient implies that an increase in long term debt ratio leads to decrease in price earnings ratio
HO6: There is no significant relationship between Long term debt/total asset ratio and Earnings yield
Based on Hausmann test result p-value is 0.023<0.005, We reject the null hypothesis which specify that the null hypothesis is more appropriate and accept fixed effect model as appropriate model for the test. The result on table 5 above indicate a positive co-efficient of 12.2977 and p-value of 0.0141 < 0.05 level of significance. Based on output, the hypothesis of no significant relationship between long term debt over total asset ratio (Leverage 2) and earnings yield is rejected therefore, there is significant relationship between the two variables. The positive co-efficient implies that an increase in long term debt ratio leads to increase in earnings yield
H07: There is no significant relationship between debt/equity ratio and Tobin q
Based on Hausmann test result p-value is 0.027<0.005, We reject the null hypothesis which specify that the null hypothesis is more appropriate and accept fixed effect model as appropriate model for the test. The result on table four indicate a negative co-efficient of -1898.738 and p-value of 0.000 < 0.05 level of significance. Based on output, the hypothesis of no significant relationship between Leverage 3 (short term debt over total asset ratio) and Tobin q is rejected. Therefore, there is significant negative relationship between the two variables. The negative co-efficient implies that an increase this debt composition of dividing total debt with equity leads to a corresponding increase in firm market value measured by Tobin q
H08: There is no significant relationship between debt/equity ratio and P/E ratio?
Based on Hausmann test result p-value is 0.027<0.005, We reject the null hypothesis which specify that the null hypothesis is more appropriate and accept fixed effect model as appropriate model for the test. The result on table six indicate a positive co-efficient of 26.466 and p-value of 0.2925 > 0.05 level of significance. Based on output, the hypothesis of no significant relationship between Leverage 3 (short term debt over total asset ratio) and Price earnings ratio is accepted. Therefore, there is no significant relationship between the two variables. The negative co-efficient implies that an increase in leverage 3 leads to a decrease in price earnings ratio
HO9: There is no significant relationship between debt/equity ratio and Earnings yield
Based on Hausmann test result p-value is 0.023<0.005, We reject the null hypothesis which specify that the null hypothesis is more appropriate and accept fixed effect model as appropriate model for the test. The result on table 5 above indicate a positive co-efficient of 3.2331 and p-value of 0.0000 < 0.05 level of significance. Based on output, the hypothesis of no significant relationship between Leverage 3 (total debt/equity) and earnings yield is rejected. Therefore, there is significant relationship between the two variables. The positive co-efficient
implies that an increase in leverage 3 (total debt/total equity) increases earnings yield.
4.3 Discussion of Findings
The goal of the research was to ascertain the nature of relationship between different strands of leverage with financial performance indices. To ascertain the relationship between independent variables (short term debt/Total asset, Long term debt/Total asset and Total debt/Equity) and dependent variables (Tobin q, price earnings ratio and earnings yield). The summary of findings of the nature of relationship between the variables is as follows:
Based on findings, short term debt and Long-term debt to total asset has a significant positive relationship with Tobin Q implying that an increase in short term debts and long-term debt increases the market value of the firm. Tobin’s Q Ratio expresses the relationship between market valuation and intrinsic value. It estimates whether a firm is overvalued or undervalued. A low Q (between 0 and 1) imply that cost to replace a firm's assets is greater than the value of its stock. This implies that the stock is undervalued.
Conversely, a high Q (greater than 1) implies that a firm's stock is more expensive than the replacement cost of its assets, which implies that the stock is overvalued. This measure of stock valuation is the driving factor behind investment decisions in Tobin's Q ratio. Tobin’s Q Ratio asserts that a business (or a market) is worth what it costs to replace. The cost necessary to replace the business (or market) is its replacement value. The research found that Leverage 1 (STD/TA) has significant positive relationship with Tobin Q such that an increase combination of short term assets in the capital structure result in an increase in market value of the firm measured by Tobin Q. Khan (2012) studied the relationship of capital structure and performance of firms in Pakistani market listed in Karachi stock exchange during 2003-2009. He finds a negative and significant relationship between financial leverage measured by short-term debt to total assets (STD/TA) and firm performance measured by Tobin Q. Hasan, Ahsan, Rahaman & Alam (2014) carried out a study of influence of capital structure on firm performance from Bangladesh, they found no statistically significant relation between short term debt/total asset and Tobin’s Q. they conclude that capital structure has negative impact on firm’s performance. Ali & Iman (2011) observed that firm’s performance using Tobin’s Q as a measure is positively related with the capital structure. Olokoyo (2012) found that any leverage measures have a positive and highly significant relationship with the market performance measure (Tobin Q). Our study conforms with the study of Tian Zeitun (2007) which found positive relation of STDTA with Tobin Q, Ali &Iman (2011),), Olokoyo (2012) and observe that capital structure significantly correlates with Tobin Q while differing with the study of Hasan, Ahsan, Rahaman & Alam (2014) which found no relation and disagrees with the study of Khan (2012) that found negative relation of short term debt- total asset ratio with Tobin Q. The study also disagrees with Tian Zeitun (2007) that found negative relation of LTDTA with Tobin Q. Interestingly debt-equity ratio (Lever3) has negative significant relation with Tobin Q agreeing with Tian Zeitun (2007) Increase in debt-equity ratio reduces Tobin Q. This negative relation may be attributed to equity holding distribution and require further analysis as market reactions to parsley and evenly held shares is different from reactions to highly concentrated and close shares ownership structure. It could also be deduced that as the debt-equity increases the risk of default and bankruptcy increases thereby producing negative perception about the firm leading to negative action about the market price of shares.
The study found insignificant negative relation between STDTA (Lever1) with Price earnings ratio indicating a weak relation although an increase of short term debt in the capital structure will negligibly decrease (P/E ratio) price earnings ratio. Findings of study show insignificant positive relation between Debt equity ratios (Lever3) with P/E ratio indicating a weak relation with increase of Debt in capital structure negligibly reducing P/E ratio. However, there is significant negative relation of LTDA on P/E ratio implying that an increase in long term debt negatively and significantly reduces price earnings ratio. This findings of LTDA significantly relating with P/E ratio agrees with the findings of Zeitun (2007) but disagrees with Umar, Tanreer, Aslam & Sayid (2012) which found a positive significant relation between LTDA and price earnings ratio. The study finding of insignificant negative relation of STDTA(Lever1) with P/E ratio also fail to conform with the findings of Umar, Tanreer, Aslam & Sayid (2012) which found significant negative correlation amongst the variable of study.
When the result of the study is juxtaposed against the use of price earnings ratio it becomes more useful. The price/earnings ratio (PER) is used in determining whether shares are "correctly" valued in relation to one another. But the PER does not in itself indicate whether the share is a bargain. The PER depends on the market’s perception of the risk and future growth in earnings. A firm with a low PER indicates that the market perceives it as higher risk or lower growth or both as compared to a company with a higher PER. The PER of a listed firm’s share is the result of the collective perception of the market as to how risky the firm is and what its earnings growth prospects are in relation to that of other companies. Investors use the PER to compare their own perception of the risk and growth of a firm against the market’s collective perception of the risk and growth as reflected in the current PER. If investors believe that their perception is superior to that of the market, they can make the decision to buy or sell accordingly. Based on the above an insignificant negative relation of STDTA indicates that short term debt is weak and negative in determining market perception and market valuation of
shares by investors. However, a negative significant relation of LTDTA implies that long term debt has strong negative effect on investor’s perception of increased borrowing. The reason is not farfetched. Increased long term borrowing increases the risk of bankruptcy because of increased cost of serving the debt, debt covenants and the possibility of earnings massaging when firms are at risk of default in meeting debt obligations. Secondly, earning generally is affected by cost of debt servicing as this tends to mitigate earnings depending on how highly geared a firm is. Increase cost of borrowing decreases earnings which is a component of price earnings ratio thereby causing the negative effect shown by our study. The study reveals negative significant relationship between STDTA and earnings yield implying an increase in STDTA reduces earnings yield. Also, we found a positive significant relationship between LTDTA and earnings yield implying that an increase in long term debt increases earnings yield. The study also indicates a positive significant relation of Debt- equity ratio with earnings yield. The reasons for the result is not farfetched. Debt is known to have positive impact on earnings because it is tax deductible. An increase in long term and overall debt to equity ratio when used for investment purposes yield returns to the firm. This therefore means increase in debt increases earnings which automatically improves earnings yield thereby denoting a positive relationship. However, short term debt is not used for investment purposes and therefore is likely to impact earnings yield negatively as liquidity is consumed to pay off maturing short term obligations. This constrains liquidity without any additional returns to the firm. When these findings are juxtaposed with the role earnings yield play it becomes more useful. The earnings yield (which is the inverse of the P/E ratio) shows the percentage of each naira invested in the stock that was earned by the firm. This yield is used by many investment managers to determine optimal asset allocations. For investors looking to invest in stocks with stable dividend income, earnings yield can offer a direct look into the level of return such dividend stocks may generate. In this case, earnings yield is more of a return metric about how much an investment can earn back for investors, rather than a valuation metric about how much the investment is valued in the market by investors. An overvalued investment can lower earnings yield and, conversely, an undervalued investment can raise earnings yield. The significant positive relation of earnings yields therefore imply that debt structure is relevant in earnings and can clearly indicate how much of investment in shares of the firm has been recovered through earnings thereby giving direction to investors how rapid investments in shareholding could be recovered when borrowing long term.
5.1 Conclusion
The focus of this study was to empirically investigate the relationship of capital structure composition with financial performance of Food and Beverage firms in Nigeria under the panel data framework using secondary data spanning from 2013 to 2017. Our empirical outcome provides evidence that the explanatory power of STDTA, LTDTA, TDTE relate with market performance. Consistent with prior researchers, the study proxy manufacturing firm’s financial performance was measured by using measures of performance: PER, ERNY and TOBIN Q. Contrary to expectation, we found from the study that price earnings ratio is negatively insignificantly associated with STDTA and negatively significantly associated with LTDTA and positively insignificantly associated with TDTE. The result provides evidence of an inverse relationship between LTDTA and P/E implying that an increase in LTDTA reduces price earnings ratio. The weak insignificant relationship of STDTA to P/E imply a weak relation and that short-term debt does not affect P/E ratio. We conclude that the weak positive relation of TD/TE requires further investigation as the nature of shareholding structure could affect the relationship. We conclude that the reason may be attributable to investor’s perception of debt as carrying associated cost and risk of bankruptcy.
We noted a negative relation of STDTA with earnings yield implying an increase in short term debt in capital structure decreases earnings yield this could be attributed to short term borrowings not being invested to yield earnings. Conforming to expectation LTDTA and TDTE significantly relate with earnings yield. We conclude that the reason could be adduced that long term borrowings are deployed for investment which yield increase earnings hence the positive relationship.
Conforming to expectation STDTA and LTDTA have significant positive relation with Tobin Q implying that these two leverage measurements significantly increase Tobin Q or market value of the firm using this yardstick. TDTE significantly negatively relate with Tobin Q. This is a composite relation implying an increase in total debt significantly mitigate firm value. We conclude bankruptcy risk and increased cost of borrowing could mitigate earnings and affect market perception.
Further analysis reveals that a shift from STDTA or LTDTA can improve positive relation with any of the variables when TD/TE is controlled. Also. a shift from LTDTA to STDTA will also produce positive relationship with any of the performance variable. However, we observe that it pays the firm more to shift from STDTA to LTDTA as this will increase market value more. Based on our findings we conclude that different composition of capital in the capital structure have positive and negative effects on the value of firms.
5.2 Recommendations
From the findings above, the researcher recommends as follows: 1. Firms should optimally use LTD to increase firm value.
2. Firms to examine capital structure composition to ascertain which of the combination maximises firm value.
5.3 Implications for Policy, Theory and Practise in Nigeria
The outcome of the study confirms that depending on the composition of debt, debt relationship with performance could be either positive or negative and the relationship also depends on the yardstick used in measuring performance. The significant negative relationship of DER (debt-equity ratio) and Tobin Q; LTDTA and P/E ratio and STDTA with Earnings yield supports Pecking order theory which states that profitable firms prefer use of internal financing followed by debt and equity. The data set used for this study were mainly from profitable firms hence the negative significant relationship with performance variables.
Trade-off theory assumes a positive relation of capital structure with firm value as firm’s trade-off the advantage of financing with debt and bankruptcy cost while trying to determine the optimal capital structure and firm value. The positive association of STDTA and LDTA with Tobin Q, and DER (TDTE) with earnings yield is in support of trade-off theory. An increase of STDTA, LTDTA and DER increase market value (Tobin Q) and earnings yield until the maximisation of shareholders wealth. This positive association of STDTA and LTDTA to Tobin Q and DER to earnings yield also supports agency theory which specifies that agency problem is associated with free-cash flow. Therefore, free cash flow problem can be controlled by increasing the stake of managers in the business or by increasing debt in the capital structure, thereby reducing the amount of “free” cash available to managers. The signaling theory supports the positive association of leverage with firm value as investors take larger levels of debt as a signal of higher quality and that profitability (as a proxy of quality performance). Therefore, the positive association of STDTA and LTDTA to Tobin Q and DER to earnings yield supports this theory.
The various theoretical postulations and the result negates M&M Theory of the Irrelevance of capital structure and supports the theory of Substitution which recognizes that capital structure relates with firm value and specifies that management of public firms manipulate capital structure to enhance earnings and growth which influences growth, dividend policy, monetary transmission and stock volatility in the capital market. The study therefore concludes that different capital structure composition relates differently with firm value,
To Practitioners firms should deliberately adjust the structural composition of their capital to drive earnings, market perception and maximize shareholders wealth and market value.
Policy makers should increase monitoring activities by putting regulations to prevent wrong reporting of capital structure composition which may affect market perception of the firm and market price of shares.
5.4 Suggestions for Future Research
Research findings provide valuable insights to stakeholders. The study also provides veritable opportunities to further research as stated below:
The study of predictive ability of current earnings and book value of equity and debt could be applied in predicting other elements of a future cash flows and share prices. Comparative study of capital structure composition in various industries to determine if capital structure composition affect market value differently in different industries.
The present study ignored certain variables that may affect result. Such factors as firm size, liquidity should be incorporated in future studies. This study only examined the Food and Beverage sector of the Nigerian economy. However, future research could evaluate other sectors of the Nigerian economy adopting similar methodology.
5.5 Contribution to Knowledge
The study contributes to existing literature in three ways: First, the findings indicate that the relationship between performance of firms and leverage depends on the nature of composition of capital structure
The evidence further supports proponents of the theory of substitution and relevance theory of capital structure and contributes to knowledge that contrary to the propositions by Modiglani & Miller that capital structure is relevant for firm value. The theory further contributes to knowledge through the formation of the underlying econometric model between capital structure composition and performance of firms in Nigeria
References
Adeyimi, S. B. & Obor, C.S. (2011). Perceived relationship between corporate capital structure and firm value in Nigeria, International Journal of Business and Social Sciences, 2(9):131-143.