PRELIMINARY SITE SELECTION –
CHILEAN MARINE ENERGY RESOURCES
Client
Inter-American Development Bank
Contact
Juan Paredes
Document No
100513/BR/02
Issue B
Classification Published
Date
15 May 2009
Author:
J Cruz, M D Thomson, E Stavroulia
Checked by:
R I Rawlinson-Smith
Approved by:
IMPORTANT NOTICE AND DISCLAIMER
1. This report is intended for the use of the Client on whose instructions it has been
prepared, and who has entered into a written agreement directly with Garrad Hassan
& Partners Limited (“GH”). GH’s liability to the Client is set out in that agreement.
GH shall have no liability to third parties for any use whatsoever without the express
written authority of GH. The report may only be reproduced and circulated in
accordance with the Document Classification and associated conditions stipulated in
this report, and may not be disclosed in any public offering memorandum without the
express written consent of GH.
2. This report has been produced from information relating to dates and periods
referred to in this report. The report does not imply that any information is not subject
to change.
Key To Document Classification
Strictly Confidential
:
Recipients only
Private
and
Confidential
:
For disclosure to individuals directly
concerned within the recipient’s
organisation
Commercial in Confidence
:
Not to be disclosed outside the recipient’s
organisation
GHP only
:
Not to be disclosed to non GHP staff
Client’s Discretion
:
Distribution at the discretion of the client
subject to contractual agreement
Published
:
Available to the general public
© 2009 Garrad Hassan and Partners Limited www.garradhassan.com
Revision History
Issue Issue Date: Summary A B 20/02/09 15/05/09Original release for clients review Final release
CONTENTS
Page
EXECUTIVE SUMMARY
1
1
INTRODUCTION 6
2
WAVE ENERGY: ZONE SELECTION
8
2.1 Methodology 8
2.1.1 Background 8
2.1.2 Application to Chile 10
2.2 Sources of data 13
2.3 Results 14
3
TIDAL ENERGY ZONE SELECTION
27
3.1 Methodology 27
3.1.1 Resource assessment in Chile 27
3.1.2 Constraints mapping and zone selection 28
3.1.3 Annual energy calculation methodology 30
3.2 Source of data 31
3.2.1 SHOA presentation 31
3.2.2 SHOA tide tables 33
3.2.3 SHOA charts 33
3.2.4 Published literature 34
3.2.5 Numerical model data 35
3.3 Results 37
3.3.1 Resource 37
3.3.2 Review of constraints 38
3.3.3 Identification of the three most promising areas for tidal stream project developments 45
ACKNOWLEDGEMENTS 50
REFERENCES 50
APPENDIX A WAVE
53
List of Tables
Table 2-1 Sources of Data for the wave energy zone selection exercise...14
Table 2-2 Priority locations for the development of wave energy projects and ...17
Table 3-1 Identified areas of good tidal resource...38
Table 3-2 Typical depths at the identified areas...39
Table 3-3 Location Typical depths at the identified areas...40
Table 3-4 Distance to the nearest port for the identified areas ...42
Table 3-5 Fishing and navigation issues at the identified areas ...43
Table 3-6 Fishing concession details...43
Table 3-7 Ecological issues near or at the identified areas...45
Table 3-8 Location Typical depths at the identified areas...45
Table 3-9 Result of zone ranking ...46
Table 3-10 Energy estimate for the three top zones ...47
List of Figures Figure 2-1 Example of a site selection exercise using a quantitative approach (Nobre et al., 2009) ...10
Figure 2-2 Overall classification – weighted average ...19
Figure 2-3 Reclassification of distance to electricity grid ...20
Figure 2-4 Reclassification of distance to port...21
Figure 2-5 Reclassification of seabed sediment thickness (geology) ...22
Figure 2-6 Reclassification of wave power ...23
Figure 3-1 SHOA presentation – measurements in the Chilean Inland Sea...32
Figure 3-2 SHOA presentation – tidal measurements ...32
Figure 3-3 SHOA presentation – potential tidal areas...33
Figure 3-4 Potential tidal resource in Southern Chile ...33
Figure 3-5 Model area of the Chilean Inland Sea (source: [3.10])...36
Figure 3-6 Concurrent water level elevations in the Chilean Inland Sea (source: [3.19]) ...37
Figure 3-7 Potential tidal resource (peak spring currents) in the Chilean Inland Sea (source: [3.19]) ..37
Figure 3-8 Electrical grid in Region X and XI. ...39
Figure 3-9 Electrical grid in Region XII ...40
Figure 3-10 Port proximities in Region X and XI...41
Figure 3-11 Port proximities in Region XII ...41
Figure 3-12 Fishing concession in and around the Chilean Inland Sea...42
Figure 3-13 Environmental issues in and around the Chilean Inland Sea...44
Figure 3-14 Environmental issues in Region XII...44
Figure 3-15 Map of the Chacao channel, source [3.11] ...48
Figure 3-16 SHOA chart of the Chacao channel, source [3.12]...48
Figure 3-17 SHOA web chart of the Chacao channel source [3.5] including GIS database of Grid, ports and fishing concessions ...48
Figure 3-18 Google earth image of the Chacao channel ...49
Figure 3-19 Narrowest section in the Chacao channel, source [3.11]...49
Figure 3-20 ADCP transect results of M2 constituent at the narrowest section in the Chacao channel, source [3.11]...49
EXECUTIVE SUMMARY
The Inter-American Development Bank (IADB) commissioned Garrad Hassan and Partners (GH) to undertake a preliminary marine energy resource assessment study of the Chilean coast.
The GH approach comprised three stages:
a. site visit to Chile – engagement with the key Chilean entities; b. review of marine energy resource and additional data;
c. publication of guidelines and project design recommendations.
Site Visit
During the site visit entities which expressed an interest in this field and have a key role in the future development of marine energy projects in Chile were approached. The list includes, among others:
Comisión Nacional de Energía (CNE);
Corporación de Fomento de la Producción (CORFO); Ministry of Public Works;
Ministry of Defence (DIRECTEMAR and Subsecretaria Marina); Servicio Hidrográfico y Oceanográfico de la Armada del Chile (SHOA); Comisión Nacional del Medio Ambiente (CONAMA);
Academic institutions.
The assessment focused on the wave and tidal stream energy resources and identified the most promising zones for marine renewable energy projects by creating a database which overlays the most relevant attributes and constraints, namely:
Wave / tidal energy resource; Bathymetry;
Access to the National electricity Grid; Seabed geology;
Proximity to a commercial port (O&M base); Areas of economical interest (e.g. fisheries); Maritime concessions1;
Areas of scientific interest; Special areas of conservation;
Onshore (shoreline) designated areas;
Other relevant information (e.g. seismic risk, archaeological sites, etc.).
Two other constraints that are particularly restrictive when planning marine energy projects are the presence of underwater cables and military exercise areas. The former does not apply in Chile (source: CNE) and the location of the latter is not available in the public domain. The GH findings were passed on to DIRECTEMAR for analysis of the selected zones and identification of any possible constraint in this regard (including the assessment of an additional constraint: the presence of major maritime routes in the selected areas).
Wave Energy
1 The analysis of the existing maritime concessions (short and long-term) and permits was made by using SIABC (Sistema Integrado Administación del Borde Costero) GIS database to assess the zones
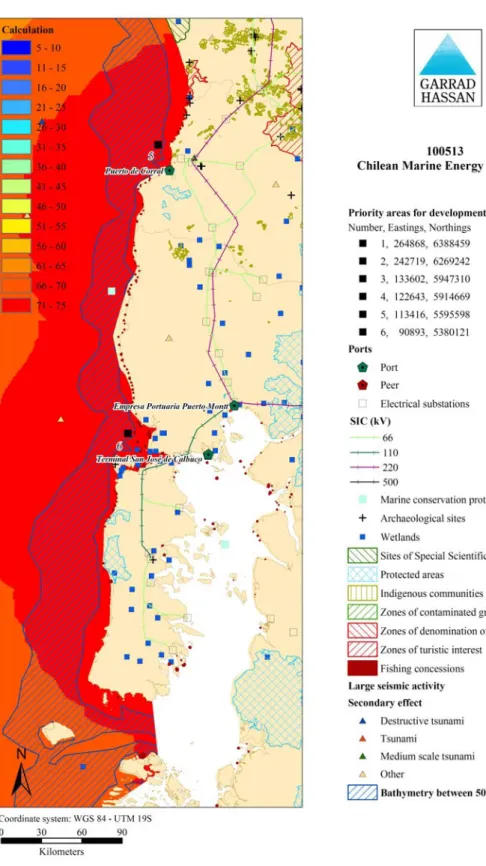
With regard to the preliminary selection of suitable zones for wave energy projects, six priority areas have been identified. All areas are suitable for offshore wave energy technologies, which provide the potential for utility-scale projects. These areas can house demonstration and pre-commercial projects, but it is recommended that from inception a large area is considered (e.g. 5 by 5 km) to allow the expansion of a given project. The installed capacity in a given area will depend on the type of technology. A guideline for wave energy farms can be established by considering Pelamis (a concept developed by Pelamis Wave Power Ltd, PWP), for which a wave farm rated at 30MW (40 Pelamis machines) would occupy a 0.6 by 2.1km area. Pelamis was chosen for representative proposes only, as it is one of the technologies which have reached full-scale that have published figures (namely the power matrix). Note that cost figures are not public for this or any of the other technologies mostly to the embryonic state of the industry. Note also the 30MW is the expected rating of the first commercial wave farm with this technology (e.g. expansion plans for the Portuguese project). A conservative estimate for the nominal energy yield associated with a single wave farm (using the published information) would amount to 80.94GWh/annum (assuming negligible interaction between devices). Wave energy technologies are not mature and thus large scale developments are not likely to occur in the near future – hence for representative purposes the estimates in the Table below considers a single Pelamis wave farm (rated at 30MW) in the 5km by 5km priority areas. The energy yield estimates presented take into account the above assumptions (80.94GWh/annum for a nominal wave climate of 55kW/m and 75% availability) and in the absence of spectral data for the local wave climates to query the device specific power matrix the preliminary assessment assumes a linear relationship between the average local wave energy resource and the nominal wave climate with regard to the influence of the resource in the energy yield.
It is important to consider a first wave farm as a means to demonstrate the potential of the country in terms of its indigenous wave energy resource. It is equally important to recognise initial projects will be associated with a sea space use of just 1km2. When planning a wave
energy strategy for Chile it is important to facilitate the development of such pilot projects without compromising their ability to expand – this can be applied to one site (pilot area or large dimensions) or to several sites, either by facilitating the licensing process or by designating a number of medium sized areas (e.g. 5km by 5km) where projects can be developed. The pilot area approach is being followed in several European countries.
Priority locations for the development of wave energy projects and estimated annual energy yield of a 30MW Pelamis wave farm (1km2)
Region O&M base
Average distance to nearest substation – cable routing (km) Closest Electrical Grid - SIC Average Local Wave Climate (kW/m) Estimate of the energy yield for a 30 MW wave farm
(GWh/annum)
V Ventanas Puerto 6 220kV 37 54.55
V Puerto San Antonio 16 110kV 66kV 37 54.55
VIII Puerto San Vicente 13 220kV 66kV 44 64.75
VIII Puerto de Coronel 10 66kV 220kV 44 64.75 X Puerto de Corral 17 66kV 220kV 51 75.05 X Puerto Montt 27 66kV 110kV 220kV 58 85.35
To conclude the summary related to wave energy, it is important to emphasise the key wave energy resource figures, which result from the exercise described in Appendix A. The average wave climate for the entire Chilean coast was estimated at 38.6kW/m, varying from 19.6kW/m (Arica) to 66kW/m (Diego Ramirez). Taking the straight line distance for the Chilean coastline (North to South) as 4270km, the raw offshore wave energy resource can be estimated at 164.9GW, showing that even if a small percentage of the resource is used the impact to the Chilean energy matrix would still be very significant.
Tidal Energy
The selection process to evaluate suitable zones for tidal stream energy projects is reliant on good tidal resource information. In this study the resource data has originated from a variety of limited sources. As a result, much of the underpinning analysis to characterise the resource could be subject to improvements if and when site data were to become available. The selection process quantified the attributes of various potential zones which were identified as suitable for both demonstration and commercial development. The table below shows a description of the three top zones evaluated by the selection process. An estimate for both the kinetic energy flux and annual energy yield for a 30MW farm, using a generic technology design, is provided. A 30MW farm has been used as a benchmark to demonstrate a site’s commercial potential and typically would occupy 1km2. There are significant issues with both
the second and third zones evaluated. The Corcovado Gulf is estimated to have fairly low flows, and as a result the commercial development (1MW units) is unlikely, but specific site measurements are required to check the real flow conditions there. The Straits of Magallance is a problematic area due to the lack of grid, ports and possible energy users, as well as likely navigation problems. However on a resource basis the zone is attractive.
Priority locations for the development of tidal stream energy projects and estimated annual energy yield of a 30MW generic tidal farm
Zone Water depth [m] O&M base Average distance to nearest substation - cable routing [km] Closest Electrical Grid (SIC) Local Tidal Resource2 [kW/m2] Estimate of the energy yield for a 30 MW tidal farm3 [GWh/annum] Chacao (Region X) 30-100 Cabo Froward or Puerto Montt 0-10 ~60 110kV 220kV 3.8 - 5.2 101-152 Corcovado Gulf (Region X) 20-100 Cabo Froward or Puerto Montt ~30 ~95 66kV 110kV 0.72 19 Straits of Magallanes (Primera Angostura) (Region XII) 50 -70 Austral none 3.6 99-126
The preliminary selection of suitable zones for tidal stream energy projects has identified one dominate area. The Chacao channel has unique geographical features that result in the formation of a large tidal elevation (head) difference between the Chilean Inland Sea (Aucud Gulf) and the Pacific Ocean. This head generates a substantial tidal current, typically flows of 4m/s are observed [3.11], and it has the potential for significant energy generation. The raw kinetic energy flux is estimated to be between 600 and 800MW, although the technically extractable resource will be a function of the spatial variation of the flow, the complex bathymetry and navigation conflicts and is likely to be 20-60% of the raw flux4. Further site
specific studies would be required to evaluate the technically extractable resource.
Pilot projects
The final section of this report addresses the overview of similar projects in key markets. An overview of existing and planned test centres is made, along with a review of the engineering companies with suitable profile for a number of relevant activities, such as surveys, offshore electrical cable installation, device installation, etc.; the created list of companies includes Chilean based companies, which could assist in the engineering works. The indicative costs of measurement equipment and other components are also presented. Finally guidelines for a pre-Front End Engineering Design (FEED) study, to be developed under a Technical Cooperation Agreement (TCA) with the IADB, are given. Such guidelines outline the several work components that need to be covered when planning specific marine energy projects, in an integrated approach which addresses all technically relevant aspects. Project recommendations are also issued, taking into account the feedback from a further visit to Chile in February 2009 where CORFO, CNE, the Ministry of Public Works and the Ministry
2 This is the depth averaged root mean cubed kinetic energy flux using a 1/7th power law.
3The range in yield values results from different assumptions regard the spatial variation in flow and the design optimisation of the technology, see Section 4 and Appendix B.
4The raw kinetic energy flux is a good indicator of the resource, but it should be noted that the driving force behind the flow is 2m tidal elevation either side of the channel.
of Energy were again consulted. The key recommendations suggest that a potential way forward would be the creation of a Chilean Marine Energy Test Centre in one of the priority zones identified, with areas in Region X offering the best potential to share some of the infrastructure between a wave and a tidal test site.
1
INTRODUCTION
The Inter-American Development Bank (IADB) commissioned Garrad Hassan and Partners Ltd (GH) to conduct a preliminary site selection study to identify suitable locations for demonstration and utility scale projects utilising marine energy converters (wave and tidal). The GH approach comprises three stages:
a. site visit to Chile – engagement with the key Chilean entities; b. review of marine energy resource and additional data;
c. publication of guidelines and project design recommendations.
The objectives of a. include the identification of all public entities which must be involved in the definition of demonstration and / or utility scale projects that utilise marine energy converters in Chile. Potential end-users (private or partially private entities) and Chilean companies with expertise to conduct the necessary preliminary activities (e.g. bathymetry surveys, mooring and electrical cable installation) were also identified. Furthermore additional companies able to support the manufacture and assembly of such devices, along with R&D centres able to assist the technology developers, are also critical parts of a Chilean strategy towards wave and tidal energy. Finally an equally relevant component of this task is the identification of the external constraints that are associated with particular sections of the Chilean coast (e.g. environmental constraints, socio-economic impacts, etc.)
The main objective of b. was to review the existing sources of data, marine atlases, field data and previous resource assessment studies that have been carried out along the Chilean coast. To enable the selection of the most suitable zones for the development of marine energy projects in Chile the energy resource was coupled with both the feedback from the key meetings held during the visit to Chile and additional data (National electricity grid layout, commercial ports, bathymetry, environmentally protected areas, etc.) that defines the technical and non-technical constraints which condition the selection of the zones. Based on this pre-selection, an initial estimate of the electricity generation potential (in GWh/annum) was derived for each location. The compiled data is critical to identify data gaps and recommend further activities in the selected zones (e.g. site surveys; digitalisation of detailed nautical charts; use of existing wave data as reference in site specific long-term resource assessments to be carried out using the MCP (Measure, Correlate, Predict) approach, etc.) Finally, in c. the findings of this study were compiled along with guidelines for a technical cooperation agreement (TCA) with the IADB which aims to overview the key actions required to create a national strategy towards the implementation of wave and tidal energy projects and define the main activities and components of the TCA, such as an initial cost and effort estimate, identification of companies with the professional profile required to conduct the key activities (e.g. bathymetry surveys, mooring and electrical cable installation, etc.), measurement equipment, logistical costs, execution timeframe for the studies, key milestones and deliverables to be expected, main risks and possible bottlenecks that could be encountered during this process and recommendations to alleviate the latter.
The motivation for this study is twofold: firstly, the development of a marine energy strategy for Chile and the subsequent demonstration (single units) and pre-commercial projects (first arrays) are directly inline with CORFO’s objectives for the 2006-2010 period:
Contribute to a large technological leap in Chile; Integrate the SME’s in the development process;
Promote the regional development by gathering investment and strengthening local clusters.
Secondly, Chile’s marine energy resources are particularly attractive and could make a significant contribution to the Chilean energy matrix. Figures from CNE (2008) show that to meet the 2020 targets (and in the more optimistic scenario), 12.870GW and 1.181GW need to be added to the SIC and SING systems, respectively. This corresponds to an increase of 132% and 50% when compared to the 2008 values in these systems. Approved projects in SEIA (2007) account for 5.206GW, with 97.35% from conventional power plants (thermal plus large hydro), with most of the developments concentrated in Regions II, III, V and VIII. A recent presentation from the Ministry of Energy (see http://www.cne.cl/f_seminario.html) shows a suggested a modification to the general law for electrical services which, if implemented, would be particularly well suited to the development of marine energy projects, as it enforces the development of renewable energy projects of the nonconventional type -ERNC (wind, marine, etc.). Such a modification to the law would force utilities to have in their energy mix a minimum of 5% of projects with these energy sources in the 2010-2014 period, with a further annual increase of 0.5% over 10 years to reach 10% in 2024 (2005 figures from CNE show that only 3.1% and 0.4% of the SIC and SING capacity is from this type of energy sources).
These actions from the Ministry of Energy aim to:
Diversify the energy mix with additional renewable energy sources;
Actively contribute to the increase in energy efficiency, sustainability and security of supply;
Stimulate industrial R&D (including cooperation with international entities).
The objectives from CORFO and the Ministry of Energy are complementary, and are both well addressed by the development of policies and project guidelines for marine energy. This study outlines the priority zones for such developments, by considering the key attributes and constraints. The status of the technology is appropriate for a staged development, hence the immediate (2010) contribution is less likely to overcome the concern on the electricity demand and be more focused on the technology development side. However, for the 2014, 2020 and 2024 targets, and in particular if the initial steps to establish demonstration and pre-commercial projects in Chile are taken, the country could not only benefit from a significant technological advantage but also a significant contribution to its energy matrix, given the inherent marine energy resources. The final section of this report outlines the technical aspects that need to be addressed to further refine the preliminary selection, and provide a guideline for the site specific feasibility studies that would be necessary.
2
WAVE ENERGY: ZONE SELECTION
In this section the zone selection exercise conducted by GH to identify suitable areas for the development of wave energy projects in Chile is described and the key results presented. Due to the specific nature of wave energy and of the natural conditions of the Chilean coast, the initial range of options based merely on the wave energy resource is vast, and an objective ranking criteria that considers not only such attributes but also the key constraints needs to be defined.
In Section 2.1 the baseline methodology applied to rank and select the most interesting areas to develop initial wave energy projects in Chile is described, and examples of previous studies with similar objectives are given. The decisive factors, the constraint and the information data sets are defined, and the rationale behind the selection criteria is discussed.
In Section 2.2 the sources of data are presented, with emphasis on the key constraints and the several information layers that were created in the GH GIS database. Particular emphasis is given to the wave energy resource data, and a short introduction to the existing sources of data, the compilation that was done for this study and its usefulness as a reference data set for long-term resource estimates and / or offshore boundary conditions in future site-specific exercises is outlined.
Finally in Section 2.3 the results of the zone selection exercise are presented. The overall results of the ranking procedure and detailed plots for the areas of interest are given. The section is concluded with the calculation of a conservative estimate for the potential energy yield (in GWh/annum) for each of an initial project in the selected areas.
2.1
Methodology
2.1.1
Background
Experience in zone and site selection exercises is mostly focused in European countries, where project developers and local governments have and are promoting the development of wave energy conversion technologies. Project developers typically address site specific exercises from the start whereas local governments tend to initiate the selection process by searching for considerable larger areas (or zones), which may be used for demonstration, pre-commercial and pre-commercial projects, promoting the development of innovation or technology clusters. The latter example is better adjusted to the objectives of this study.
One of the European countries where a significant amount of site and zone selection studies have been developed is Portugal. The Wave Energy Centre has conducted a study5 to identify the most suitable areas for development of wave energy projects at a utility-scale, using a non-quantitative approach, i.e. several information layers were compiled in a GIS database but no quantitative ranking was implemented, and thus recommendations are limited. A major limitation is linked with the absence of information regarding access to the National electricity grid, which is minimised due to the country’s specific conditions (i.e. the major cities in Portugal, and thus the backbone of the electricity grid, are located close to the shore). Such qualitative approaches are, by definition, less objective and harder to justify and implement in larger countries such as Chile.
5 Potential and Strategy for the Development of Wave Energy in Portugal, WavEC, 2004 (http://www.wavec.org/client/files/Summary_DGGE_ingl.pdf).
For this study a quantitative approach was envisaged from the start, and similar examples can be found in the literature. One of these reflects a study also applied to the Portuguese coastline6. The authors created a GIS database and defined the study area by removing from
the initial scoping area the most limiting constraints (i.e. the decisive factors) such as bathymetry (e.g. shallow sites are associated with lower energy levels), environmentally protected areas or militarily exercise areas. The result is a reduced area (the ‘mask’) where the projects can be developed and thus where the analysis can be conducted.
The technical constraints are then defined; in this particular study the constraint layers included:
Distance to coastline; Distance to ports;
Distance to National electricity grid; Seabed geology;
Wave energy resource.
All the criteria above are objective with the exception of the first one (Distance to coastline), as it is unclear which situation is more beneficial to a project. From the technical point of view the priority is to minimise the distance to shore to minimise the costs related to the access to electricity grid and the response time for any planned or unplanned O&M. However such objective categories are handled explicitly in the second and third criteria. Furthermore, from the non-technical point of view it can be more beneficial to the project to maximise the distance to shore, to minimise the impacts associated with its development (in particular the socio-economic and the environmental ones). Given this ambiguity this criterion was excluded from the GH study, as it is considered that the distance to port and distance to grid criteria cover the relevant technical aspects.
The next step is related to the reclassification of the masked area. Here the above mentioned criteria are applied to the area of interest by defining the objective function associated with each one. For example, the objective function associated with any of the above distance criteria is to search for the locations that minimise such distance, and the objective function associated with the wave energy resource is to search for the locations that maximise the resource levels. In the Nobre et al. (2009) study the seabed geology attribute was reclassified to reflect the type of seabed (sand being the best suited). The masked area was therefore reclassified from 0 to 100, with 100 being given to the grid point which maximises the objective function and 0 being the grid point that it is the farthest away from such objective. Once the constraints are defined and the masked area is reclassified according to the selected criteria, weights needs to be attributed to each of the criteria to obtain a final ranking of the area. This step corresponds to the main subjective component of the process and may lead to different conclusions, according to the sensitivity of the selection process to each constraint. As the reclassification procedure used a scale from 0 to 100, percentages can be attributed to each weight and the final percentage rating will result from the weighted sum of the individual contribution associated with each attribute. In this study the wave energy resource was the attribute the largest weight, although there are several ways to include the influence of the resource (see Section 2.1.2).
Finally, once the area of interest is ranked, it is possible to zoom in the best suited sites and make objective conclusions regarding the preliminary sites. It is important at this stage to introduce information layers in the database, to assess non-technical constraints or any zone or site specific constraints that may condition the development of projects in the candidate 6 ‘Geospatial multicriteria analysis for wave energy conversion system deployment’, Nobre et al.
areas. This level of complexity was not included in the Nobre et al. study. The final result of this study is presented in Figure 2.1.
Figure 2-1 Example of a site selection exercise using a quantitative approach (Nobre et al., 2009)
2.1.2
Application to Chile
The above described objective methodology was implemented by GH to the Chilean coastline. The initial study area is vast, making the definition of the mask particularly relevant. The approach aims to obtain a quantitative indication of the location of the most suitable zones for the development of wave energy projects in Chile.
When applying the methodology to Chile, the following fundamental decisive factors were identified:
Bathymetry
The analysis was limited to the area between the 50m and the 200m depth contours. Such range of depths is the most indicated for the vast majority of the current nearshore and offshore wave energy technologies, which are the most likely to be applied in utility scale projects in the near future. To select
suitable sites shoreline technologies require site specific studies which are outside the scope of this study.
Additionally, and after the meeting with CONAMA, GH was advised that any project to be installed at a shallower site would require a more detailed environmental licensing process (benthos protection).
Special Areas of Conversation (AMCPs)
The several environmentally protected marine areas were excluded from the final study area.
Limit study area to SIC and SING electrical grid systems
After discussion with CNE, exclude the XI and XII regions (Aysen and Magallanes electrical grid systems), that account for less than 1% of the installed / grid capacity.
Sheltered areas
Sheltered areas where excluded from the study area. This applies mostly to the inland seas in Region X (note that from the above Regions XI and XII were already excluded from the analysis).
After defining the study area using the decisive factors recommended above, four major parameters were identified for the classification of potential zones:
Distance to the National electricity grid (100 – shortest distance) Distance to Ports (100 – shortest distance)
Wave energy resource (kW/m) (100 – highest resource)
Seabed geology (sediment chart) (100 – deepest sediment layer)
Maps for each of the above categories were created, reclassifying the study area from 0 to 100 (with the latter being the grid point that maximises the objective function). Weights were then attributed to each category, following:
Distance to the National electricity grid – 25% Distance to Ports – 25%
Wave energy resource (kW/m) – 40% Seabed geology (sediment chart) – 10% Other categories could include:
Distance to shore - project specific, as it is not clear which should be the objective function e.g. shortest distance better for economical reasons, longest distance possible better for environmental aspects; thus it is less suitable for a preliminary zone selection exercise).
Evaluate the resource seasonally and the spectral parameters separately (Hs, Te) -
evaluation of the seasonal resource may be beneficial as the annual average may camouflage a large seasonal variation. The wave climates in the Southern hemisphere (and in particular in Chile) are less influenced by such variations than Northern hemispheres wave climates, according to the available studies7. The use of not only 7 See, e.g., Monárdez et al. (2008), Evaluation of the Potential of Wave Energy in Chile, Proc. of the
the resource levels (in kW/m of wave front) but also the key spectral parameters (namely the significant wave height and the wave energy period) as individual constraints could be used at a second stage to check the suitability of the wave energy resource to a particular device and to define the access limits for the O&M vessels. However the former is not applicable at this stage and the latter is a secondary effect with regard to the distance to ports and thus can be left for a site specific exercise.
Access to the spectral parameters describing the wave resource (Hs, Te) would also
allow a more detailed assessment of the output of a given wave energy converter, via the device specific power matrix. A preliminary assessment was made, by relating the local wave climate with the nominal wave climate behind the derivation of the power matrix of one of the most advanced wave energy technologies to obtain a estimate of the average yearly energy yield of a representative wave farm (see Section 2.3).
With the study area ranked, the regions with the best average scoring can be looked at in detail, by including several information layers to assess additional constraints that may condition the development of wave energy projects. The GH GIS database has the following additional layers, which were used when plotting detailed maps of the highest ranked regions to conduct an informed decision of the preliminary location of the best zones:
Fishing concessions (Areas de Manejo Bentonico); Sites of special scientific interest;
Onshore protected areas; Wetlands;
Archaeological sites;
Zones of contaminated ground;
Other areas of economical interest (e.g. tourism, denomination of origin).
Other suitable layers at all three levels (decisive factor, constraint and information) were identified, but were not included in the GH database due to the limited access to such data. In particular: information on military exercise areas and major maritime routes was formally requested (by both the IADB and GH) to DIRECTEMAR. Access to such information was denied but DIRECTEMAR agreed to review the conclusions of this study prior to publication of the final report. Thus the influence of the below mentioned constraints is limited to a final check once the zones have been selected (as additional information):
Maritime concessions Military exercise areas Major maritime routes Port entrance routes
With regard to the maritime concessions, GH used the SIABC (Sistema Integrado de Administacion del Borde Costero) database (http://bc1.directemar.cl/siabc2/) to assess if short or long term concessions (or permits) have been granted in the areas of interest. The selected zones show no significant conflicts. A similar conclusion was reached by searching for conflicting projects in the SEIA database (Sistema de Evaluación de Impacto Ambiental: www.e-seia.cl), although several plans for port expansion were found (namely in Regions VIII and X), which deserve special attention when considering the implementation of the recommendations of this study.
The results from the ranking exercise, including global plots with the classification according to each of the four constraints, are presented in Section 2.3. Detailed plots for the most promising areas are also presented, overlaying the additional information layers to select
several zones (5 by 5km) that show the best potential for the development of wave energy projects. A preliminary assessment of the electricity generation capability associated with each of the areas is also given.
Recommendations for further studies include the assessment of two key items for refinement of the selected zones:
Digitalisation of the most updated nautical charts for the areas of interest; Detailed seabed geology information (potentially via site surveys).
2.2
Sources of data
In this section the sources of data for the decisive factors, constraints and information layers specified in Section 2.1 are presented. Particular emphasis is given to the wave data set, given the importance attributed to the wave energy resource in the selection process (40% weight). Long-term wave data also allows the possibility of conducting long-term site specific resource assessments using hindcasts (numerical estimates), satellite measurements or buoy data as reference, and applying the MCP (Measure, Correlate, Predict) methodology using short-term site specific data to derive a site-reference relationship. Potential sources of reference data for such detailed studies are overviewed in this section.
Firstly, Table 2-1 presents the sources of the data implemented in the decisive factors, constraints and information layers used in the selection of the preliminary zones for wave energy projects. The vast majority of these data sets were obtained following the meetings between GH, the IADB and key Chilean official entities, to maximise the accuracy of the data used in the study. The exceptions were the bathymetry, the seabed geology information (obtained from the National Geophysical Data Centre, USA) and the wave resource.
With regard to the wave resource, Baird & Associates Ltd. (a Canadian coastal engineering consultancy) have compiled a database of offshore wave data under the Olas del Pacífico project. Such database includes Chile’s coastline. SHOA’s involvement in the project is not clear, although some references5 mention the use of over 20 data points from SHOA’s wave buoy measurements as a validation tool. In the project website (www.olasdelpacifico.com) all data points for the Chilean coast rely on outputs from the WaveWatchIII model (NOAA’s open-source wave model) or satellite estimates form the TOPEX mission (NASA), and thus it is not possible to confirm which (if any) of SHOA’s wave measurement buoys were used in the validation of the data sets. SHOA, after being queried by GH and the IADB in a meeting held in Valparaíso on the 11th September 2008, did not confirm the use of its data in this
project.
Baird & Associates Ltd have also presented results from an earlier version of the same model6. The project described used the WaveWatchII model, and results were compiled in the
Olas Chile II project. Deepwater long-term estimates of the resource were presented, along with rough offshore to nearshore transition model (based on linear wave theory), for several locations along the Chilean coast. These results were used by GH as a first estimate for the exercise described in Section 2.1.2 in version A of this report.
From inception GH intended to use SHOA’s wave data as the reference in this exercise. With the assistance of the IADB, GH approached SHOA to acquire the summary spectral statistics from wave buoy measurements for 12 locations offshore Chile (all the available) to refine and enhance the quality of the wave resource constraint layer which was used for the selection of the most suitable zones for wave energy projects. In issue B of this report (final version) GH has refined the outputs of the WaveWatchIII model in the 12 locations of the SHOA
measurement buoys in order to derive long-term (10 year) estimates. The procedure and key statistics, inc. monthly and annual variation, are described in Appendix A. Such dataset has been be used as the wave energy resource layer.
Future zone or site specific long-term wave resource estimates will require suitable data sets to act as local data sources, should short-term measurement campaigns be conducted and the MCP (Measure, Correlate, Predict) methodology applied. In such methodology the data listed in Appendix A can be used as reference, in order to allow the extrapolation of a short-term measurement campaign and obtain long-term site specific estimates. The most common sensors that are used for local wave measurements are surface following buoys or bottom-mounted acoustic profilers. Other alternatives for long-term reference data include several commercially available databases and the raw outputs of wave models such as WAM or WaveWatchIII, the GH outputs listed in Appendix A and the SHOA data. In all cases the application of a suitable transformation model such as SWAN (a offshore to nearshore wave propagation model) or equivalent to obtain the site specific conditions is desirable, although it is recognised that for depths bigger than 50m this is not a decisive factor given that the deepwater conditions apply for d > λ /2, where λ is the dominant wavelength (hence the recommendation to rely on the data listed in Appendix A and conduct a MCP exercise where appropriate).
Table 2-1 Sources of Data for the wave energy zone selection exercise
Data Set Source
Bathymetry GEBCO database8
Special area of conservation (AMCPs) CONAMA
National electricity grid layout CNE
Ports Ministry of Public Works
Wave energy resource (kW/m) measured wave data (supplied by SHOA) NOAA’s WaveWatchIII model and
Seabed geology (sediment chart) NGDC
Fishing concessions (Areas de Manejo
Bentonico) SUBPESCAS
Sites of special scientific interest Onshore protected areas
Wetlands Archaeological sites Zones of contaminated ground Other areas of economical interest (e.g.
tourism, denomination of origin)
CNE GIS database9
2.3
Results
Having compiled a database with the relevant constraints and information layers, the methodology described in Section 2.1.2 was applied to the study area defined by the several decisive factors.
8 IOC, IHO and BODC (2003), ‘Centenary Edition of the GEBCO Digital Atlas’, CD-ROM edition, published on behalf of the Intergovernmental Oceanographic Commission, International Hydrographic Organisation and British Oceanographic Data Centre.
In this section several maps present the overall classification and reclassification scoring for each of the constraints (allowing an assessment per constraint). Detailed maps zoom in the zones with the best overall scoring and show additional information layers which may influence the final decision regarding the suitability of a given zone to receive a wave energy project. Finally, preliminary (and conservative) estimates for the energy yield (in GWh/annum) of 5 by 5km areas within the selected zones are presented. Such areas are large enough for demonstration, pre-commercial and commercial projects to be developed.
Each of the following figures in this section presents a result that reflects a scale from 0 to 100. With regard to the constraints the maximum result may be outside the study area; their relative influence in the overall classification is characterised by the different weights outlined in Section 2.1.2.
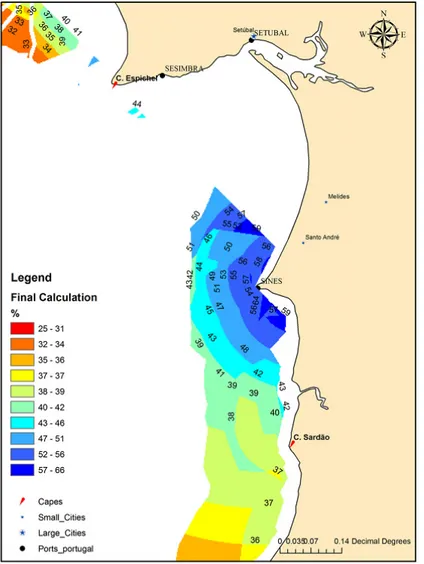
Figure 2.2 presents the overall ranking (colour scale) along with some of the key constrains (location of ports and layout of the National electricity grid). The application area defined by the decisive factors, namely the area between the 50 and the 200m depth contours, is also marked in the map. In general, and given the predominance that was allocated to the wave energy resource, Southern sites are favoured with regard to Northern sites. Furthermore, the area between the 50 and the 200m depth contours is smaller and very close to shore for Regions I to IV. Coupling these considerations with the additional constraints, detailed maps for Regions V, VIII, IX and X were created to incorporate the several information layers, in order to recommend zones within the above mentioned regions (Figures 2-7 to 2-9). Firstly, Figures 2-3 to 2-6 show the reclassification maps for the entire study area in each of the relevant constraints: distance to the electricity grid, distance to port, seabed geology and wave energy resource, allowing the non-weighted assessment of the influence associated with each individual constraint.
The first detailed map illustrates that the most interesting areas in Region V are located in the vicinity of Puerto Ventanas (northbound) and Puerto San Antonio (southbound) – see Figure 2-7. The area between Puerto Ventanas and Valparaíso is likely to be strongly conditioned by the maritime traffic in and out of both ports, and thus should not be considered a priority. Puerto Ventanas is a private port of public use whereas Puerto San Antonio is a state-owned port; thus the latter might be better suited if a wave energy project is to be supported by the Chilean government. In addition, Puerto San Antonio is considerably larger than Puerto Ventanas, and the 2005 data from the Ministry of Public Works shows a usage factor of 37% (thus potential for alternative uses). Such availability and its inherent characteristics (namely the marine area) ensure its suitability to operate as a O&M base for future wave energy projects. The area south of Puerto San Antonio within the 50 to 200m depth contour area is subject to offshore wave climates of 34 to 38kW/m; these are the lower wave energy resource level for the zones identified in this preliminary study, but are still well suited for demonstration and pre-commercial projects. A potential onshore limitation (conflict of use) for auxiliary works in areas south of Puerto de San Antonio is related to the classification of such area as a zone of denomination of origin.
In Regions VIII and IV (Figure 2-8) the area south of Puerto Coronel is less interesting due to the increasing distance to a suitable O&M base (areas close to Puerto de Corral are handled in the analysis of the detailed map for Region X). The most promising zones in the region are in between Puerto San Vicente and Terminal Escuadrón, and north of Puerto San Vicente (VIII region). The former is likely to be conditioned by maritime traffic, but presents the highest overall scoring given the coupling of the wave energy resource, distance to grid and distance to port. The wave resource estimates are higher than in the previous case for Region V (spanning between 43 and 47kW/m), but the fact that both ports are small should be considered when planning its use as a O&M base. As in the areas pointed for region V there is
no immediate conflict with, e.g. large fishing concessions, but some onshore constraints apply as the surrounding onshore areas are zones of contaminated ground.
Finally, Figure 2-9 shows a detailed map of the scoring and information layers for Region X. As mentioned previously, the wave climate in Southern Chile is more energetic and thus the potential for electricity generation is higher. A first suitable area is located offshore Puerto de Corral: the wave energy resource is high, distance to the 66kV and 220kV SIC grid lines is short and there are no significant shoreline limitations (small fishing concessions being the major concern). However one negative aspect is the size of Puerto de Corral, which could limit its ability to serve as a suitable O&M base for projects involving several wave energy converters. Although there is no explicit minimum requirement in terms of area and there are only a few precedents, a O&M base should allow the safe manoeuvring and access to the wave energy converter(s). The size of the harbour is equally conditioned but the type of technology and project (demonstration or pre-commercial). An example can be found in the facilities used by Pelamis Wave Power Ltd in Portugal: while the assembly of the machines was done in a relatively small shipyard in Peniche (350m quay; www.enp.pt), the permanent O&M base for the Agucadoura project (3 Pelamis units initially, potentially expandable to a further 27) was set up in Leixões (www.apdl.pt), which has a wetted area of 120ha. The potential expansion of Puerto de Corral (should the project require) is beyond the scope of this study.
The inland sea near the Canal de Chacao was excluded from the study area as this is a sheltered area, i.e. not exposed to the swell waves which carry the vast majority of the wave energy. However Puerto Montt is the largest port in the region and the best equipped to house a O&M base, but its use for wave energy projects is conditioned, among other factors, by the maritime traffic in the Canal de Chacao. Furthermore, this is an area of interest for tidal projects (see Section 3), and thus a logistical interest in sharing the onshore infrastructure (namely the control room and substation) for the two sites (wave and tidal) may exist. The other ports and peers in the region (namely those operated by Empresa Portuaria Cabo Froward) are less suited, given their current application and size. Such limitation makes the sites south of Puerto San José de Calbuco less attractive (for a first series of projects), although it is recognized that overall scoring is high, mostly due to the wave energy resource levels.
To conclude, Table 2-2 outlines the priority locations that have been identified for initial wave energy projects under the preliminary zone selection exercise described in this section. The exact location of such areas is subject to a final check from DIRECTEMAR (for the reasons outlined in Section 2.1.2), but no restrictions were found in the SIABC online database (absence of permits, short or long-term concessions for ocean use in the selected areas). In Figures 2-7 to 2-9 areas of 5km by 5km within the 50 to 200m depth contour zone have been marked for representative purposes, although it should be noted that larger areas would be well suited for phased developments, allowing the long-term planning of a strategy for wave energy developments in Chile. Such large pilot areas are being planned in other countries, namely the UK, Portugal and Spain, under similar development strategies. Such staged development is coherent with the current status of the technology and would allow a deeper involvement of the Chilean government (and the other entities involved in renewable energy projects, such as the IADB) in the promotion and development of wave energy conversion technologies in Chile.
The installed capacity in a given area will depend on the type of technology. A guideline can be established by considering Pelamis (a concept developed by Pelamis Wave Power Ltd, PWP), for which a wave farm rated at 30MW (40 Pelamis machines) would occupy a 0.6 by 2.1km area. Pelamis was chosen for representative proposes only, as it is one of the technologies which have reached full-scale that have published figures (namely the power
matrix). Note that cost figures are not public for this or any of the other technologies mostly to the embryonic state of the industry. Note also the 30MW is the expected rating of the first commercial wave farm with this technology (e.g. expansion plans for the Portuguese project). The nominal wave climate for a Pelamis machine (55kW/m) is stated in the PWP brochure10.
A representative capacity factor (estimated at 30.8%, corresponding to the nominal capacity factor6 times a 75% availability level), a conservative estimate for the nominal energy yield
associated with a single wave farm would amount to 80.94GWh/annum (assuming negligible interaction between devices). Wave energy technologies are not mature (note that the first worldwide wave farm, corresponding to three Pelamis machines, was installed in Portugal in September 2008) and thus large scale developments are not likely to occur in the near future – hence for representative purposes Table 2-2 considers a single Pelamis wave farm (rated at 30MW) in the 5km by 5km priority areas.
The energy yield estimates presented in Table 2-2 take into account the above assumptions (80.94GWh/annum for a nominal wave climate of 55kW/m and 75% availability) and in the absence of spectral data for the local wave climates to query the device specific power matrix the preliminary assessment assumes a linear relationship between the average local wave energy resource with regard to the nominal wave climate.
It is important to consider a first wave farm as an objective to demonstrate the potential of the country in terms of its indigenous wave energy resource. It is equally important to recognise that the estimates in Table 2-2 are associated with a sea space use of just 1km2. When
planning a wave energy strategy for Chile it is pivotal to facilitate the development of such pilot projects without compromising their ability to expand – this can be applied to one site (pilot area or large dimensions) or to several sites, either by facilitating the licensing process or by designating a number of medium sized areas (e.g. 5km by 5km) where projects can be developed.
A final note to the key wave energy resource figures, which result from the exercise described in Appendix A. The average wave climate for the entire Chilean coast was estimated at 38.6kW/m, varying from 19.6kW/m (Arica) to 66kW/m (Diego Ramirez). Taking the straight line distance for the Chilean coastline (North to South) as 4270km, the raw offshore wave energy resource can be estimated at 164.9GW, showing that even if a small percentage of the resource is used the impact to the Chilean energy matrix would still be very significant.
Table 2-2 Priority locations for the development of wave energy projects and estimated annual energy yield of a 30MW Pelamis wave farm (1km2)
Region O&M base Average distance to nearest substation – cable routing (km) Closest Electrical Grid - SIC Average Local Wave Climate (kW/m) Estimate of the energy yield for a 30 MW wave farm
(GWh/annum)
V Puerto
Ventanas 6 220kV 36 52.98
V Puerto San Antonio 16 66kV 110kV 36 52.98 VIII Puerto San Vicente 13 66kV 220kV 45 66.22
VIII Puerto de Coronel 10 220kV 66kV 45 66.22
X Puerto de Corral 17 220kV 66kV 50 73.58 X Puerto Montt 27 66kV 110kV 220kV 52 76.53
Figure 2-6 Reclassification of wave power
3
TIDAL ENERGY ZONE SELECTION
This section reports the selection of suitable areas (or zones) for the development of tidal stream energy projects in Chile. The nature of the tidal resource is quite different to that of offshore wind and wave. It is generated by a combination of global tidal forcing, regional and local geography and, as such, the resource (tidal races/stream/currents) tends to be very specific to a particular location. Hence the starting point of a zone selection exercise is the identification of these specific locations from which the most suitable areas can be selected. It should be noted that the objectives of this study are to evaluate areas of resource that are suitable for demonstration, pre-commercial and commercial projects. As a result the areas investigated are generally much larger than those analysed by project developers conducting a site selection exercise.
The method adopted to evaluate some of the most promising areas for a potential test centre/ commercial farm is outlined in Section 3.1. Outlined in this section are: The approach to identify areas of suitable tidal stream energy resource; the constraint mapping method required to differentiate the selected areas; and the method to estimate an annual energy yield are outlined.
In Section 3.2 the various information data sources are listed, with some brief discussion on the impacts key information has on the selection process. As outlined in Section 2.2 key information data sets were created in a GH GIS database.
Section 3.3 presents and discusses the results of the zone selection exercise. The section is concluded with the calculation of a conservative estimate for the potential energy yield (in GWh/annum) for each of the three selected areas.
3.1
Methodology
3.1.1
Resource assessment in Chile
Historically most areas of good tidal stream resource have been identified by mariners and recorded on national hydrographic charts for navigational safety purposes. However, the information about these tidal races can be limited (spatially and temporally). In some areas coast lines have been numerically modelled by oceanographer using regional numerical models coupled with finer resolution local bathymetry information to predict local flow accelerations (e.g. The UK Marine Energy Atlas [3.1]). The results of such models enable potential tidal races to be identified and, more critically, quantified when little recorded measurement data exists. Although, it should be noted these models are in the main validated with tidal gauge (height) measurements rather than the less available current measurements. The complex nature of the tidal resource means that in situ measurements are essential for any robust annual energy yield. However, basic information, such as max and mean current speed (or more commonly mean spring and neap peak currents) can be used as indicators of the strength of the resource.
The extensive coastline of Chile and the complex navigation routes in the southern parts has prompted the development of a fairly sophisticate competence in maritime activity. SHOA (the hydrographic office in charge of maritime charts for Chile) operates at international standard protocol and over the last couple of decades has been active in the developing the knowledge of local tidal races. As a result SHOA’s hydrographic charts do include some information about tidal stream velocities. However, a complete set of charts for the whole of Chile was not readily available for review and measured data was only available at cost. Instead a literature review coupled with the SHOA tide tables were assessed, along with some reports kindly provided by CNE. Details are provided in Section 3.2.
The UK is generally accepted as the country that is presently leading the development of tidal energy technologies and project developments. In 2004 a review of the UK tidal stream resource was conducted [3.2] and this report use the more commonly available mean spring peak current (Vmsp11) parameter as the indicator for the strength of the resource. Generally a
Vmsp greater than 2.5m/s is considered to yield a feasible commercial site. Other indicators of the strength of a tidal race are: mean flow; peak flow; tidal range; and the magnitude of the M2 constituent (lunar variation) of the tidal harmonic. But caution is needed when using these values as they can vary dramatically depending of the local driving geography. There are many websites which outline the fundamentals of tidal stream energy, a few of which are listed below: http://www.carbontrust.co.uk/technology/technologyaccelerator/ME_guide.htm http://www.darvill.clara.net/altenerg/tidal.htm http://www.berr.gov.uk/whatwedo/energy/sources/renewables/news-events/press-materials/background/tidal/page24345.html http://www.aquaret.com
3.1.2
Constraints mapping and zone selection
Having identified the areas with suitable tidal resource, the mapping of various constraints is required in order to differentiate the selected areas. Attributes that act to reduce the attractiveness of a potential development of a possible tidal stream energy site are complied in a GIS database. Through the GIS information multiple constraints can be visualised, enabling identification and assessment of limiting constraints, such as bathymetry, environmentally protected areas or militarily exercise areas (i.e. the zones where projects may not get planning consent). The technical constraints and the method by which are used in this study are described below and are further defined in Appendix B:
Tidal resource areas where the peak flow12 exceeds 3m/s are considered excellent, areas where the flow >2m/s are good and flows >1.8m/s are considered for investigation.
Bathymetry:
o Geology/seabed conditions are generally specific to a tidal site and detailed
survey work is required when conducting site selection. Presently device developers are looking at various technology options depending on the seabed conditions (e.g. gravity bases where drilling or pilling is not an option) and thus for this study it is assumed that seabed geology is not a limiting factor. However, the inclination of bed could limit device installation (apart from a monopile type concept), so to evaluate the seabed steepness (depending on the concept although 10deg is considered a max), depth contours are reviewed when available.
o At present no tidal stream technology device developers are investigating
operating in depths beyond 100m and the preference is for depths of between 30 – 80 m. However due to limited resolution of the depth data assessment
11Vmsp is the mean spring peak flow speed, Vmnp is the mean neap peak flow speed.
12 The peak flow is used here instead of the Vmsp as the majority of information only contains reference to peak and mean flows. This is explained further in Section 4.3.1.
scoring is based on the weather the majority of the site has a depth greater or less than 100m. An addition consideration (but not considered a constraint) is that CONAMA required a more detailed environmental licensing process beyond the 50m water mark (benthos protection).
Distance to national electricity grid connection – proximity to the SIC and SING is deemed of major importance by CNE. However, the zones identified in the southern regions i.e. Region XI (Aysen) and Region XII (Magallanes) are not excluded on the base that there are possible alternative options such as remote data centres (like the one proposed by Google [3.3].
Distance to shore: generally tidal races are located close enough to the shore and thus in this study the distance to shore is not included. It is however, an important factor in the micro-siting process where the increased cable costs must be balanced with a reduce quality of resource closer to shore.
Distance from ports has been banded by circles of multiples of 25km radius from the various public (or private, but with possible public access) ports. Higher scoring is given to areas closer to ports.
Concession: fishing concessions were the only concession type that was reviewed. The greater the number (or surface area covered by the concession) the lower the scoring.
Environmentally protected areas are known as Special Areas of Conversation (AMCPs). In this study the areas within an AMCP were not automatically excluded on the grounds that each case should be judged on an individual basis. Additional environmental information layers have been included in the detailed maps to allow identification of any potential constraints for the development of tidal energy projects. The GH GIS database includes; Sites of special scientific interest; Onshore protected areas; Wetlands; Archaeological sites; Zones of contaminated ground; Other areas of economical interest (e.g. tourism, denomination of origin).
Other user groups – detailed information regarding navigation routes and issues were not readily available13. It is assumed that smaller vessels can co-exist with a
submerged array of device and if necessary shipping lanes could be altered. However, a common sense review of the navigation disruption was included in the assessment.
Military exclusion zones13 – no information supplied and thus was not included in the
assessment.
Each of the above attribute used in this study, was weighted by the follow amounts: Tidal resource - 35%
Depth limit - 10% (although quite critical this weighting is kept low due to the uncertainties regarding the depth variations at sites)
Distance to national electricity grid connection - 20% Distance from ports - 20%
Fishing concession - 5% Navigation -5%
Environmentally protected areas -5%
13 As mentioned in Section 3, influence of the constraints below is limited to a final check once the zones have been selected (as additional information):
Maritime concessions Military exercise areas Major maritime routes Port entrance routes
In the absence of a standard protocol for the zone selection of a demonstration site with the potential for utility scale projects, the specific weightings are based on experience gain from the industry.
By combining the effect of all attributes each area can be ranked relative to each other.
3.1.3
Annual energy calculation methodology
There are two established ways to estimate the potential resource: the “flux” method and the “farm” method. The farm method needs detailed information of the devices to be used and more information on the temporal and spatial variation of the resource (further details are listed below), where as the “flux” method uses a single flow parameter (root mean cubed velocity), some characteristic dimensions of the flow cross sectional area, coupled with an extraction parameter. This extraction parameter (coined the Significant Impact Factor) is introduced to limit the total amount of mean annual power that can should be extracted from a tidal flow as not to cause a significant impact on the up and down stream environment. For the UK assessment the value used was 20%. However, subsequent assessment have increased the potential value to 50% and even higher than 100% for specific sites. As a starting point the value of 20% is used, however, for certain tidal races (e.g. Chacao channel) the driving force and hence energy source is very significant on the flood tide when a ~2 m head difference between the pacific and the Chilean Inland Sea exists.
To avoid the uncertainties associated with the flux method in evaluating the technically extractable resource, it more useful conduct an annual energy yield calculation using the farm method. 30MW is often used as a benchmark for the first commercially feasible farm14. To conduct a detailed annual energy yield calculation the following details are required:
Flow distribution (usually at or near the surface) or harmonic description Detailed bathymetry
Flow profile through water column (boundary layer) Assume spatial variation (side effects/ side profile) Device power curve (water to wire)
Device hub height setting
Packing density (lateral and longitudinal limits i.e. blockage and wake effects) Limit of extraction / extraction constraints
Electrical efficiency Availability
For the 30MW farm assessment the following assumptions are made:
A flow distribution can either be used directly from measured data or constructed using a simplified harmonic model (based on Vmsp and Vmnp). From the distribution the root mean cubed speed is found (Vrmc).
Spatial consistency is assumed: the same mean flow is assumed over the site. For the Chacao channel three varying assumptions have been used (see Appendix B&D) A 1/7th power law depth profile is assumed
Hub height is assumed to be mid water depth
The overall efficiency for a farm is assumed to be 31.3% and includes:
o Rotor to wire 35% o Grid losses at 95%
14 The Carbon Trust’s MEC cost estimation methodology uses 30MW as the benchmark see http://www.carbontrust.co.uk/technology/technologyaccelerator/mec_cost_estimation_methodology.ht m