Modelling the Impact of Decoupling on Structural
Change in Farming: Integrating Econometric
Estimation and Optimisation
Thia Hennessy
Tahir Rehman
Contributed paper prepared for presentation at the
International Association of Agricultural Economists Conference, Gold Coast, Australia, August 12-18, 2006
Copyright 2006 by Thia Hennessy and Tahir Rehman. All rights reserved. Readers may make verbatim copies of this document for non-commercial purposes by any means,
Modelling the Impact of Decoupling on Structural Change in Farming: integrating econometric estimation and optimisation
Thia Hennessy*
Teagasc, Rural Economy Research Centre, Ireland
Tahir Rehman
School of Agriculture, Policy and Development, The University of Reading, Reading, UK
*Corresponding Author
Thia C. Hennessy, Rural Economy Research Centre, Teagasc, Athenry, Co Galway, Ireland. Email:[email protected]
Modelling the Impact of Decoupling on Structural Change in Farming: integrating econometric estimation and optimisation
Abstract
Implementation of the Mid Term Review of the Common Agricultural Policy on farming in Europe is expected, and intended, to initiate structural changes in European agriculture. This impact of the agricultural policy reform will be triggered at the farm level with both up- and down-stream effects for agriculture in Europe. Modelling such a phenomenon is challenging. An integrated modelling approach, involving farm level optimisation models and exogenously estimated econometric models of farmer behaviour, is developed for Ireland; this framework is a general one and is applicable elsewhere. Entry and exit from farming, postulated as the mai n consequences of the policy reform, are estimated exogenously to determine their role in the allocation of farm labour. The results for Ireland show that farm numbers will decline more rapidly under decoupling relative to a baseline situation. Further, decoupling is likely to favour beef farming but, an increasing number of beef farmers will have to rely on outside income to sustain that system of farming. Dairy farmers will face a price cost squeeze and structural change in this sector will be accelerated.
Keywords: Common Agricultural Policy, Decoupling, Farm Level Modelling, Linear Programming, Succession, Labour Allocation
Modelling the Impact of Decoupling on Structural Change in Farming: integrating econometric estimation and optimisation
Introduction
The Mid Term Review reform of the Common Agricultural Policy (CAP) ‘decouples’ (or disconnects) direct support from production. Irish farmers have depended on direct payments for a considerably long period, with a majority receiving over 100 percent of their total farm income as direct payment; thus, ‘decoupling’ will have major ramifications for production and the structure of farming. This paper presents a modelling approach developed in Ireland to assess the impact of decoupling.
Background to Decoupling
If coupled subsidies are replaced with decoupled ones then production should fall to a level that would exist without any subsidies; therefore, farm output that makes a market-based loss should fall substantially, unless significant cost or efficiency gains are achieved. Research has shown that even fully decoupled payments have production inducing effects through their impact on farmers’ exposure to risk, their access to capital and their future expectations of ‘re-coupling’ of support. For example, if the payments are linked to resource use then an incentive to produce may still exist (Swinbank 2004). Furthermore, decoupling may relax a household’s budget constraint, inducing a farmer to take riskier production decisions (Hennessy 1998) or to invest on the farm (Anderson 2004). This paper explores the effect of decoupled payments on farmers’ production decisions and on the pace of structural change in farming. Decoupling is an unprecedented change and therefore past data provide little indication of its supply inducing effects, presenting agricultural policy modellers with a considerable challenge. The traditional tools of analysis, such as partial or general equilibrium models, use supply
elasticities derived from time-series are not suited to assess the impact of decoupling. For analysing ‘farm-focused’ policies, a micro level approach, as presented in this paper, is what is required.
Methodology
The FAPRI-Ireland Partnership is a set of commodity market models and a set of far m level models. The aggregate models, which are linked to the FAPRI EU GOLD model, are individually estimated econometric models that are solved simultaneously under different policy scenarios. The farm level models are structured around a generic multi-period profit maximisation Linear Programming (LP) model that is supplemented with a number of exogenously estimated econometric models of farmer behaviour. The farm level models apply price and cost projections emanating from the aggregate models to farm level data in order to simulate farmer adjustments after the policy reforms.
Optimisation is preferred as it does not rely on time-series and it does not extrapolate future from historical relationships; unprecedented policy changes can therefore be analysed. The normative assumption of optimisation models is mitigated through the use of econometric estimation of ‘entry to and exit from’ farming and of farm labour allocation. These estimations quantify the effects of non-pecuniary factors on farmers’ decisions, providing “positive” estimates of farm numbers and resource allocation following decoupling. This integrated approach is explained below.
Modelling Entry to and Exit from Farming
Many studies of entry to and exit from farming conclude that age related variables are the most significant determining factors of this phenomenon (for example see Gale (2002) and Glauben et al (2002)). An age cohort analysis of the Irish data shows that farm numbers are in net decline, as the number of retiring farmers exceeds new entrants. Models of retirement and succession in farming
are required to understand the effect of policy reform on the number of farms; however, empirical data on retirement from farming in Ireland is extremely limited and therefore it is not possible to model this decision statistically. The data on succession, however, are better and a succession model is specified in the context of the nominated farm heir’s occupational choice, using the Schmidt and Strauss (1975) theory of occupational choice. Such choices are made by comparing the discounted utilities derived from all alternative occupations available over a life-cycle. For the Irish situation, the nominated heir has three choices: enter farming, enter a non-farming occupation or enter farming part-time. The probability of each choice being made is estimated by a multinomial logit (MNL), using the Irish National Farm Survey (NFS) data on farmers’ succession plans and the heirs’ occupational choices.
The results show that educational attainment, especially participation in tertiary education, significantly influences the occupational choice. Participation in tertiary education and occupational choice are very likely to be ‘joint’ and they may not vary autonomously. A bivariate probit model that controls such endogeneity is specified and shown in Appendix I. Nominated farm heirs with third level education are significantly less likely to enter farming and the decision to participate in tertiary education is influenced negatively by farm income. Hence, if farm incomes drop due to decoupling, the probability of heirs participating in tert iary education will increase as would the chances of their exit from farming.
Modelling Farm Labour Allocation
Decoupling is expected to lead to a decline in the return t o farm labour and thus trigger a movement of labour from agriculture to other sector s of the economy. An econometric model of
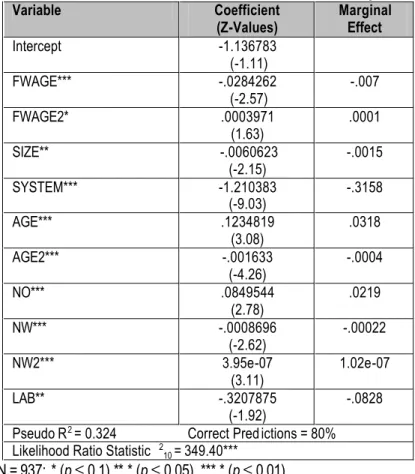
farm labour allocation quantifies the implications for (i) the number of part-time farmers and (ii) the availability of farm labour. Labour allocation decisions have their conceptual basis in the agricultural household model (Singh, Squire and Strauss 1986). In this paper however the emphasis is on the role of government subsidies in this agricultural household decision-making. Coupled subsidies by their nature increase the marginal value product of farm labour. Decoupling however will lead to a decline in the return to farm labour and, other things being equal, farmers will substitute off-farm employment for farm work, resulting in the substitution effect. As a decoupled subsidy is not attached to production, it is a source of non-labour income, implying a relaxation of the household budget constraint, which permits a farmer to enjoy greater leisure while maintaining consumption and thus enjoy the so-called wealth effect. Decoupling may cause two conflicting effects. To measure the wealth and substitution effects, a labour participation and a labour supply model are specified separately (Hennessy and Rehman 2005), using a binary probit and OLS specifications to solve the two models respect ively. The dependent variable in the OLS model, the number of hours worked off-farm, is incidentally truncated, as for some farmers the number of hours recorded is zero, raising the possibility of sample selection bias; therefore, a Heckman two-step procedure is applied to test and control the sample selection bias. The data used and the results are presented in Appendix 2.
To measure the substitution effect, returns to on-farm labour are estimated by dividing total farm income by total labour employed on the farm1 and, for wealth effect, a variable representing non-labour income is required. The identification of such a variable is difficult as the NFS does not
1
In some cases the return was negative as a negative farm income was recorded, to avoid negative farm wages the variable was constrained to a lower limit of zero.
provide any data pertaining to non-farm activities. Instead, following Mishra and Goodwin (1997), a farmer’s net worth is used as a proxy for household wealth.2 The effects of the on-farm wage and wealth variables are both negative; and, the return to labour declines and both the wealth and part-time farmers increase due to decoupling, as expected. The direction of movement of a farmer’s labour between on- and off -farm employment therefore depends on the changes on individual farms. The probability of participation in off-farm employment increases in 58 percent of cases, while the number of hours spent on off-farm employment also increases for the majority of part-time farmers. The impacts for individual farms are discussed later after the description of the integrated modelling approach.
The Integrated Modelling Approach
To assess the impact of the MTR reform of the CAP, the above econometric models are integrated with individual farm level optimisation models. The ‘entry and exit’ model estimates the number of active farms in any one year and for each farm a Linear Programming (LP) model is run. The econometric labour model estimates the number of part-time farms and the amount of labour available on each farm. Projections of prices and costs for the baseline and the decoupling scenarios are taken from the FAPRI-Ireland model (Binfield et al 2003). The resources of the exiting farms, land, labour and milk quota, are allocated using a generic multi-period LP model and production plans are generated for each year covering a period over 2005 to 2010 for three scenarios: a baseline situation, the previous Agenda 2000 reform and the new decoupling (MTR) reform of the CAP. The input-output coefficients are as recorded in the base year remain constant and all resource endowments are as recorded in the baseline scenario. In the MTR scenario direct
2
Some researchers argue that this is not appropriate as many farmers tend to be asset rich but income poor. In the absence of a better alternative, however, net worth is used here.
payments are removed from the objective function and the Single Farm Payment (SFP) is the new source of revenue, due to decoupling, which is attached to land use. The choice set for this scenario includes the option of entitlement farming, which is the activity of using land to claim the SFP but not to produce any tangible products (Breen et al 2005).
Results
Figure 1 shows the proportion of beef farmers participating in the off-farm labour market. Given inter-generational changes and a positive macroeconomic outlook, the number of farmers participating in off-farm employment will increase. The pace of structural change, however, is faster under the MTR scenario as the substitution effect dominates the wealth effect for the majority of farmers and therefore the numbers participating in off-farm employment increases.
Figure 1: Projections of the Proportion of Beef Farmers with Off-farm Employment in Ireland
55 60 65 70 75 80 2005 2006 2007 2008 2009 2010
Percentage of Beef Farmers
Baseline MTR
A mass de-stocking of animals and a proliferation of entitlement farming is predicted due to decoupling. A closer analysis will however suggest that such a change is not likely to occur. A large number of Irish beef farmers have been farming at a market loss and it was thought that they could maximise profits by de-stocking. However, if overhead costs are still incurred, then for most
of these farmers it would be rational to continue with some level of farm activity. A vast majority can obtain a gross profit from at least one enterprise and post-coupling such farmers would specialise in their most profitable enterprise. Figure 2 presents the projected number of entitlement farmers.
Figure 2: Projections of Entitlement Beef Farmers in Ireland
0 5 10 15 20 2004 2006 2008 2010 2012 Percentage of Farms
The impact of the MTR is likely to be inequitable as some farmers will benefit while others lose, by adapting stratagems such as off-farm employment, enterprise substitution and/or specialisation, for example. It is important, therefore, t o consider the full impact of decoupling on both the viability of the farm business and the sustainability of the household. Such effects of decoupling are assessed using a framework developed by Hennessy (2004), where an economically viable farm business is classified as one having (a) the capacity to remunerate family labour at the average agricultural wage, and (b) the capacity to provide an additional 5 per cent return on non-land assets (Frawley and Commins 1996). Farms that are not economically viable but where the farmer participates in off-farm employment are classified as nonviable but sustainable, as off-farm income contributes to the long-term sustainability of the household. Economically nonviable farms with another source of income are vulnerable.
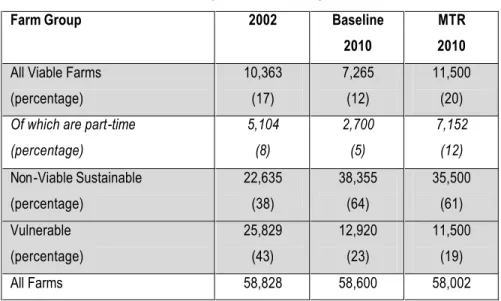
Table 1 shows the current beef farming population and the projected changes in the baseline and MTR scenarios. In 2002 just 17 percent of beef farms were economically viable. They are projected
to grow under decoupling, as farmers benefit from higher beef prices and less market distortion; however, the number of viable farmers relying on outside income is projected to increase. The number of nonviable but sustainable farms will almost double after decoupling, due to the declining importance of farm income to many farm households. Finally, the number of vulnerable farms would decline faster under decoupling than the baseline scenario because of the improved economic outlook for beef and the increased attraction of off-farm employment.
Table 1: Viability of Beef Farming in Ireland
Farm Group 2002 Baseline 2010
MTR 2010
All Viable Farms (percentage) 10,363 (17) 7,265 (12) 11,500 (20) Of which are part-time
(percentage) 5,104 (8) 2,700 (5) 7,152 (12) Non-Viable Sustainable (percentage) 22,635 (38) 38,355 (64) 35,500 (61) Vulnerable (percentage) 25,829 (43) 12,920 (23) 11,500 (19) All Farms 58,828 58,600 58,002
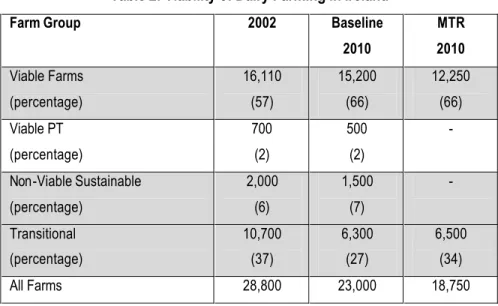
Table 2 presents similar results for the dairy farming, where the effect of the MTR is less positive. The reduction in the intervention prices for dairy products means a considerable price cost squeeze, accelerating the rate of exit from this sector after the MTR relative to the baseline situation. The average level of production on dairy farms in 2002 was 230,000 litres which will increase to 34,000 litres by 2010 under the MTR scenario. Despite these increases in output, the number of economically viable dairy farmers will decline.
Table 2: Viability of Dairy Farming in Ireland
Farm Group 2002 Baseline 2010 MTR 2010 Viable Farms (percentage) 16,110 (57) 15,200 (66) 12,250 (66) Viable PT (percentage) 700 (2) 500 (2) - Non-Viable Sustainable (percentage) 2,000 (6) 1,500 (7) - Transitional (percentage) 10,700 (37) 6,300 (27) 6,500 (34) All Farms 28,800 23,000 18,750 Conclusions
This paper has developed a farm-level modelling approach to assess the effects of the MTR reform of the CAP on Irish farming. It is shown that the farm numbers will decline more rapidly under decoupling relative to the baseline situation. Decoupling is likely to result in a more positive economic outlook for beef farming but the number of beef farmers relying on outside income will increase. Dairy farmers will face a price cost squeeze and the pace of structural change in that sector will be accelerated after decoupling. The proposed approach integrating econometric models with farm level optimisation provides a versatile tool for analysing the impact of changes in agricultural policies.
References
Andersson, F. (2004). Decoupling: The concept and past experiences. SLI Working Paper 2004:1, Sweedish Institute for Food and Agricultural Economics.
Binfield, J., Donnellan, T., Hanrahan, K., and Westhoff, P . (2003). The Luxembourg CAP Reform Agreement: Implications for EU and Irish Agriculture. Teagasc, Dublin.
Breen, J., Hennessy, T. and Thorne, F. (2005) The effect of Decoupling on the Decision to Produce: An Irish Case Study. Food Policy. 30: 2
Gale, F.H. (2002). Age specific patterns of exit and entry in US Farming 1978-1997. Review of Agricultural Economics (25) 1 168-186.
Glauben, T., Tietje, H. and Weiss, C., 2002. Inter-generational succession on family farms: evidence from survey data. Paper Presented at the Xth Congress of the European Association of Agricultural Economists, Zaragoza, Spain
Hennessy, D. A., (1998). The Production Effects of Agricultural Income Support Policies Under Uncertainty. American Journal of Agricultural Economics. 80: 346-57.
Hennessy, T. and Rehman, T. (2005). Modelling the Effect of Decoupling on Farmers’ Labour Allocation Decisions. Paper Presented at the 96th Seminar of the European Association of Agricultural Economists. February 2005, Parma, Italy.
Mishra, A. and Goodwin, B. (1997). Farm Income Variability and the Supply of Off-farm Income.
American Journal of Agricultural Economics. 79:880-887
Schmidt, P. and Strauss, R., (1975). The prediction of occupation using multiple logit models.
International Economic Review. 16: 471-486.
Singh, I., Squire, L. and Strauss, J. (1986). Editors, Agricultural Household Models: Extensions, Applications, and Policy. Baltimore: Johns Hopkins University Press.
Swinbank, A. (2004) An examination of various theoretical concepts behind decoupling and review of hypothetical and actual de-coupled support schemes in some OECD countries. Unpublished Report Prepared for Sixth Framework Project - GENEDEC
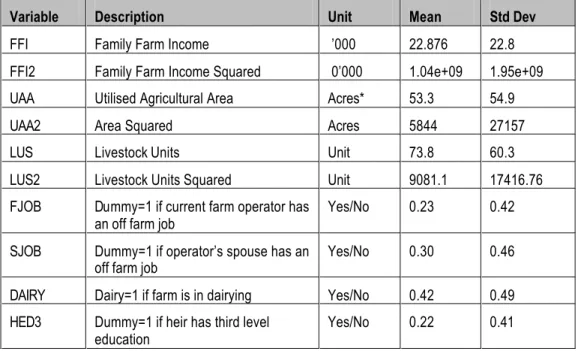
Appendix 1
Table A1.1: Independent variables for the occupational choice model
Variable Description Unit Mean Std Dev
FFI Family Farm Income ’000 22.876 22.8
FFI2 Family Farm Income Squared 0’000 1.04e+09 1.95e+09
UAA Utilised Agricultural Area Acres* 53.3 54.9
UAA2 Area Squared Acres 5844 27157
LUS Livestock Units Unit 73.8 60.3
LUS2 Livestock Units Squared Unit 9081.1 17416.76
FJOB Dummy=1 if current farm operator has
an off farm job
Yes/No 0.23 0.42
SJOB Dummy=1 if operator’s spouse has an
off farm job Yes/No 0.30 0.46
DAIRY Dairy=1 if farm is in dairying Yes/No 0.42 0.49
HED3 Dummy=1 if heir has third level
education
Yes/No 0.22 0.41
N=514, * An acre equals 0.404 of a hectare.
Table A1.2: Results of the Multinomial Logit Model of Occupational Choice
Independent
Variables CHOICE=2 Part-time Non Farming CHOICE = 3 Don’t Know CHOICE = 4
Param. z ratios Param. z ratios Param. z ratios
Intercept 2.23** 7.29 -.668 -1.15 .7790* 2.49 UAA -.0056 -1.57 -.0027 -0.32 -0.006* -1.79 LUS -.0178** - -4.64 -.0215** -2.66 -0.0015 -0.53 FJOB 1.399** 2.88 .5718 0.77 .9002 1.70 SJOB .9046** .9046 1.616** 3.30 0.389 1.24 DAIRY -.9913** -3.17 .3430 0.63 -0.4616 1.51 HED3 1.163** 2.91 1.561** 2.81 0.7733* 1.90 * (P≤ 0.1)*** (P≤ 0.05) N= 514 Pseudo R2 =0.178
Log Likelihood =-499.19 Unrestricted Log Likelihood = -607.7
Correct predicti ons: CHOICE=1 (65% ) CHOICE=2 (89% ) CHOICE=3 (0) CHOICE=4 (31% ) Total Correct Predictions (65% )
Table A1.3: Results of bivariate probit model
Independent Variables
FULLTIME HED3
Parameter (z ratios) Parameter (z ratios)
Intercept -.6212 -5.38 -.5876 -5.04 LAND .0023 1.57 -.00028 -0.17 LUS .00186 1.05 -.0019 -0.93 FJOB - - .1342 1.412 SJOB - - .1983** 2.30 DAIRY -.1928 1.42 .1019 0.64 FFI .0011 0.31 -.0088** -2.22 HED3 -1.847* -13.8 - - Rho ( ) 0 .98** * (p≤ 0.05) ** (p≤ 0.01)
Appendix 2
Table A2.1: Data for Labour Allocation Models
Variable Definition Sample
Mean (N=937) Standard Deviation (N=937) Dependent Variables
WORK Dummy variable=1 if operator engages in off-farm employment 0.26 0.44
HOURS* Number of hours supplied off-farm 1481 678
Independent Variables
SYSTEM Dummy variable=1 if farm is in dairy production 0.52 0.49
SIZE Total agricultural area in hectares 46 39
SIZE2 Agricultural Area Squared in hectares 3571 17938
FFI Family Farm Income 000 22.8 22.05
FWAGE Family farm income per hour of total labour 11.38 10
FWAGE 2 Family farm income per hour of total labour squared 231 438
LUS Number of livestock units 70 55
LUS2 Number of livestock units squared 7928 14302
AGE Farmer’s age in years 55 12
AGE2 Farmer’s age squared 3148 1243
SPJ Dummy variable=1 if spouse engages in off -farm employment 0.30 .45
NO Number living in farm household 3.9 1.8
LAB Number of unpaid labour units on the farm 1.09 0.43
UNEMP Local unemployment rate in percentage 4.6 0.86
OWAGE* Estimated Off-farm work wage per hour 14.34 11.89
NW Net Worth 000 434.25 348
NW2 Net Worth Squared 000 309564 872610
Table A2.2: Results of the Probit Model of Labour Participation Variable Coefficient (Z-Values) Marginal Effect Intercept -1.136783 (-1.11) FWAGE*** -.0284262 (-2.57) -.007 FWAGE2* .0003971 (1.63) .0001 SIZE** -.0060623 (-2.15) -.0015 SYSTEM*** -1.210383 (-9.03) -.3158 AGE*** .1234819 (3.08) .0318 AGE2*** -.001633 (-4.26) -.0004 NO*** .0849544 (2.78) .0219 NW*** -.0008696 (-2.62) -.00022 NW2*** 3.95e-07 (3.11) 1.02e-07 LAB** -.3207875 (-1.92) -.0828 Pseudo R2 = 0.324 Correct Pred ictions = 80%
Likelihood Ratio Statistic 2
10= 349.40***
N = 937; * (p ≤ 0.1) ** * (p ≤ 0.05) *** * (p ≤ 0.01)
Table 12.3: Results of the Ordinary Least Squares Model of Labour Su pply
Variable Coefficient (T-Values) Intercept*** 2169.69 (19.86) FWAGE** -12.3749 (-2.02) NW*** -.6025994 (-2.53) LAB*** 434.0715 (-3.68) R2= 0.199 F= 15.61*** N = 247; *(p < 0.1);** (p < 0.05);*** (p < 0.01)