University of Nebraska - Lincoln
DigitalCommons@University of Nebraska - Lincoln
Cornhusker Economics
Agricultural Economics Department
11-1-2017
Risk Implications from the Selection of Rainfall
Index Insurance Intervals
Ashlee Carlson
University of Nebraska-LincolnCory Walters
University of Nebraska-LincolnKathleen Brooks
University of Nebraska-LincolnMonte Vandeveer
Kansas State University
Jerry D. Volesky
University of Nebraska-Lincoln See next page for additional authors
Follow this and additional works at:
http://digitalcommons.unl.edu/agecon_cornhusker
Part of the
Agricultural Economics Commons
This Article is brought to you for free and open access by the Agricultural Economics Department at DigitalCommons@University of Nebraska Lincoln. It has been accepted for inclusion in Cornhusker Economics by an authorized administrator of DigitalCommons@University of Nebraska -Lincoln.
Carlson, Ashlee; Walters, Cory; Brooks, Kathleen; Vandeveer, Monte; Volesky, Jerry D.; and Schacht, Walt, "Risk Implications from the Selection of Rainfall Index Insurance Intervals" (2017).Cornhusker Economics. 934.
Authors
Ashlee Carlson, Cory Walters, Kathleen Brooks, Monte Vandeveer, Jerry D. Volesky, and Walt Schacht
This article is available at DigitalCommons@University of Nebraska - Lincoln:http://digitalcommons.unl.edu/agecon_cornhusker/ 934
agecon.unl.edu/cornhuskereconomics
Cornhusker Economics
It is the policy of the University of Nebraska–Lincoln not to discrimi-nate based upon age, race, ethnicity, color, national origin,
gender-identity, sex, pregnancy, disability, sexual orientation, genetic information, veteran’s status,
November 1, 2017
Risk Implications from the Selection
of Rainfall Index Insurance Intervals
Since the passage of the 1994 Crop Insurance Reform Act, the federal crop insurance program has grown in both size and scope. The program progressed from generating under $1 billion in premiums in 1994 to generating nearly $9.3 billion in 2016 (USDA-RMA 1994, 2016b). In 2007, the federal crop insurance pro-gram introduced the Rainfall Index (RI) and Vegeta-tion Index (VI) Insurance Pilot Program for Pasture, Rangeland, and Forage (PRF) in selected states. In 2016, RI-PRF replaced VI-PRF and was made availa-ble in all 48 contiguous states enrolling 28,538 policies and providing over a billion dollars in coverage on more than 52.3 million acres (USDA-RMA 2016b). However, insured acreage represents only about 8% of the total 649.5 million acres of pasture and hay land. This small percent of coverage contrasts greatly to corn, where 87% of acres were insured in 2016 (USDA -RMA 2016c).
RI-PRF is constructed as an index; therefore, it con-tains “index based” benefits to the insurer (i.e., mini-mizing information asymmetry held by the insured). The insurer must minimize basis risk (the risk uncov-ered by the index), while attempting to maintain con-tract transparency, containing delivery, marketing, and reinsurance costs (Miranda and Farrin 2012). A key feature making RI-PRF unique from other index based insurance products is that the insured selects the protected time frame (i.e., insurance intervals). Insurance intervals across different months open the door for different levels of basis risk between forage production and precipitation as well as the insured to select contracts with impacts the Federal Crop Insur-ance Corporation never intended. As a result, RI-PRF insurance intervals may perhaps contain different lev-els of basis risk, possibly at values higher than antici-
Market Report Year Ago
4 Wks Ago
10/27/ 17
Livestock and Products,
Weekly Average
Nebraska Slaughter Steers,
35-65% Choice, Live Weight. . . . 104.04 108.50 116.33 Nebraska Feeder Steers,
Med. & Large Frame, 550-600 lb. . . . . 133.80 184.62 177.55 Nebraska Feeder Steers,
Med. & Large Frame 750-800 lb. . .. . 138.71 165.54 166.40 Choice Boxed Beef,
600-750 lb. Carcass. . . . 182.00 195.81 201.05 Western Corn Belt Base Hog Price
Carcass, Negotiated . . . .. 44.87 49.70 NA Pork Carcass Cutout, 185 lb. Carcass
51-52% Lean. . . . 72.64 72.33 76.50 Slaughter Lambs, wooled and shorn,
135-165 lb. National. . . . 146.03 167.17 140.48 National Carcass Lamb Cutout
FOB. . . . 351.19 409.72 392.24
Crops,
Daily Spot Prices
Wheat, No. 1, H.W.
Imperial, bu. . . . 2.74 3.17 3.12 Corn, No. 2, Yellow
Columbus, bu. . . . NA 3.07 3.10 Soybeans, No. 1, Yellow
Columbus, bu. . . .. . . NA 8.67 8.82 Grain Sorghum, No.2, Yellow
Dorchester, cwt. . . . 4.82 5.38 5.60 Oats, No. 2, Heavy
Minneapolis, Mn, bu. . . . 2.78 2.97 2.93
Feed
Alfalfa, Large Square Bales, Good to Premium, RFV 160-185
Northeast Nebraska, ton. . . . 160.00 * * Alfalfa, Large Rounds, Good
Platte Valley, ton. . . . 67.50 85.00 85.00 Grass Hay, Large Rounds, Good
Nebraska, ton. . . .. . . . 67.50 85.00 85.00 Dried Distillers Grains, 10% Moisture
Nebraska Average. . . . 108.00 115.50 122.50 Wet Distillers Grains, 65-70% Moisture
Nebraska Average. . . . 41.73 42.00 43.50 ⃰ No Market
with some grids being uninsurable. The gridded pre-cipitation data represents an interpolated value based on the entire grid and cannot be traced to a single point or reporting station. An expected grid index is calculated for each grid and index interval using long-term, historical, gridded precipitation data (USDA-RMA 2016a). RI-PRF requires the producer to insure monthly precipitation using two-month intervals. The two-month interval rule results in eleven insurance intervals during the calendar year: January-February, February-March, March-April, April-May, May-June, June-July, July-August, August-September, September-October, October-November, and
November-December. RI-PRF rules require that producers must insure at least two intervals and intervals cannot over-lap (i.e., cannot insure January-February interval and February-March interval) effectively limiting the maxi-mum number of intervals to six. Intervals are
weighted with a minimum weight of 10% and a maxi-mum weight of 60% requiring the sum of weights to add up to 100%. Losses are calculated based on wheth-er the current year’s precipitation in a grid has deviated from the historical normal precipitation in the same grid, for the same interval.
Conceptual Model
Our conceptual model modifies Maples, Brorsen, and Biermacher (2016), by allowing monthly insurance interval selection in a perennial forage system. We assume producers are risk averse, expected-utility maximizers and can choose to purchase insurance. If producers insure, they are able to select from a portfo-lio of contracts based upon coverage level, productivity factor, and insurance intervals.
Our primary objective is to focus on the risk reducing aspects of different insurance intervals. As a result, we focus on evaluating producer net income and risk (measured as variance of net income) by comparing multiple insurance intervals to no insurance. Each insurance interval will likely have a different relation (basis risk) between observed production and return from insurance participation and, therefore, a different impact on the variance of net incomes. The impact on variance of net incomes identifies the risk reducing aspects of RI-PRF insurance intervals. A low relation between production and net income from a specific insurance interval can do one of two things. First, it can cause a producer who experiences low production to pay a premium without an indemnity, lowering net income even further than if there were no insurance. Second, it could cause a producer who experiences high production to receive a large indemnity thereby increasing net income further than without insurance. In either one of these cases, the variance of net income pated, which could result in a misallocation of government
resources (i.e., subsidies).
In this article, we empirically examine the financial out-comes from forage production and RI-PRF insurance par-ticipation in two locations in Nebraska. Both locations pro-vide historical forage production and precipitation data, allowing us to examine the relation between RI-PRF in-demnities and forage production. Specifically, we focus on the decision by the government to allow the insured to se-lect the insurance interval. We examine how the insurance intervals impact producer expected net income and net in-come risk, and government program cost. Results from our analysis can help policymakers improve the effectiveness of RI-PRF insurance.
This article is based on a longer research paper that goes into the issues in more depth. The full paper is available by contacting the authors and in review at Ag Finance Review.
RI-PRF Program
RI-PRF represents a single peril (precipitation) index insur-ance product focusing on the production of perennial for-ages on rangeland, pastureland, and cropland.1 The
objec-tive of RI-PRF is to provide perennial forage producers rev-enue (indemnities) due to losses in precipitation. RI-PRF differs from the traditional index insurance by insuring pre-cipitation over a specific period (two-month intervals) ver-sus production at some aggregate level (typically county). Additionally, the producer is able to choose under which practice they would insure their forage, either haying or grazing. If the producer uses land for both, the producer would choose which practice is most beneficial to him based on his own risk preferences. The current study ana-lyzes the haying option.
To be eligible for RI-PRF, the producer is required to have a share on insurable acreage that was in production before July 1 prior to the coverage year. RI-PRF offers a variety of contracts based on varying coverage levels and productivity factors. Coverage levels are chosen from 70%, 75%, 80%, 85%, and 90%. Productivity factors vary from 60% to 150% of county base value in 1% increments. The productivity factor allows producers to adjust forage value, in dollars per acre, based on their specific land productivity. RI-PRF in-sures by grids: 0.25 degrees latitude by 0.25 degrees longi-tude at the equator, which translates into grids of about 17 by 17 miles. Grids were created by the National Oceanic Atmospheric Administration Climate Prediction Center (NOAA CPC) and do not follow geopolitical boundaries,
__________________
1 While the Risk Management Agency (RMA) uses the term
rainfall in the title of the insurance product, they are actually measuring precipitation from the National Oceanic Atmos-pheric Administration Climate Prediction Center (NOAA CPC). Rainfall and precipitation are used interchangeably in this article to describe precipitation in the form of rainfall, snow, sleet, and other forms.
would increase rather than decrease. A properly function-ing insurance contract would reduce the variance of net income. A strong relation between precipitation and forage production would imply insurance payments when a low production event is observed, thereby reducing producer net income risk. Because RI-PRF insurance intervals are expected to reduce risk, the hypothesis would be rejected by empirical evidence that insurance intervals generate higher variance than not purchasing an RI-PRF insurance policy (i.e., no insurance).
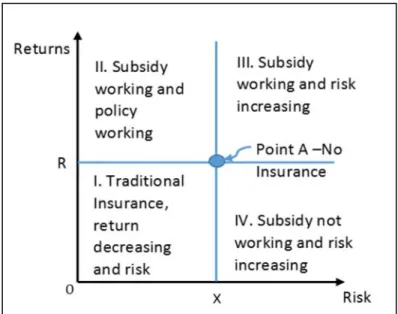
To further explain our approach, Figure 1 displays the change in risk versus reward when purchasing a subsidized index insurance policy. Point A represents the producer with no insurance. At this point the producer would face R
returns and X risk. Purchasing insurance will cause the producer to move into one of the four quadrants.
Zones I and IV represent outcomes where the subsidy is not working correctly and producer returns are lower than expected. Zone I portrays a traditional insurance contract where the producer pays a premium, in order to reduce risk, thereby lowering returns. Zone IV shows the region where a premium paid results in a reduction in returns but risk increased.
Zones II and III represent outcomes with the subsidy work-ing properly. In Zone II and Zone III the producer paid a subsidized premium therefore seeing increased returns over time. Zone II is a subsidized and well-functioning insurance market as risk was also reduced. Outcomes in Zone III imply a subsidy transfer but not a reduction in risk. Outcomes in Zones III or IV, lead to an increase in risk, violating RMA’s stated goal of an effective risk man-agement program.
Data
Data were obtained from two University of Nebraska-Lincoln research ranches, one located in the central Sandhills and the other in the eastern Sandhills of Ne-braska. The first site is the Gudmundsen Sandhills La-boratory (GSL), located in Grant, Hooker, and Cherry Counties. Data from GSL range from 2004 to 2015. The second site, Barta Brothers Ranch (BBR), is located approximately 140 miles to the east of GSL in Rock and Brown counties. Data from BBR is from 2001 to 2015. Both sites represent upland Sandhills rangeland domi-nated by a mixture of native warm-season grasses and cool-season grasses along with common prairie forbs and shrubs (Schacht et al. 2000). Each research site had an on-site weather station that provided daily pre-cipitation values which were aggregated up to monthly values for evaluation.
Methods
With many different RI-PRF contract combinations available to producers, we identify and evaluate six different insurance scenarios making sure to take into account precipitation extremes (low and high precipi-tation, discussed in detail below) and personal corre-spondence with producers. By examining precipitation extremes we are able to greatly lower the number of scenarios evaluated. Using expected monthly precipita-tion at the farm for each locaprecipita-tion, we categorized months into three precipitation categories: low, high, and medium, Figure 2. As illustrated in Figure 2, the low precipitation category includes: November, De-cember, January, February, and March. The high pre-cipitation category includes: April, May June, July, and August. The medium precipitation category includes September and October. With only two medium pre-cipitation months and RI-PRF requiring a minimum of four months, we are unable to evaluate the medium precipitation category exclusively. We evaluate two high precipitation insurance scenarios with one being early in the growing season (high/early) and one later in the growing season (high/late) and one low precipi-tation insurance scenario. We evaluate three other sce-narios which are a blend of precipitation categories. These three scenarios are: low/high, high/medium/low, and medium/low.2
In order to specifically analyze the risk reducing effec-tiveness of different insurance scenarios, we evaluate
__________________
2 The following are the interval selections for each scenario:
Low represents Jan/Feb and Nov/Dec; Low/High represents Jan/Feb and May/Jun: High/Early represents Apr/May and Jun/Jul: High/Late represents May/Jun and Jul/Aug; High/ Medium/Low represents Aug/Sep and Oct/Nov; and Medi-um/Low represents Sep/Oct and Nov/Dec.
yearly returns from insurance scenarios at each location, holding coverage level, productivity factor, and output pric-es constant. Each of the scenarios selected was insuring hay production at the 90% level, with a 100% productivity fac-tor. We chose the coverage level to insure the highest amount of precipitation. The productivity factor was cho-sen so that the dollar amount of protection approximated the expected value of production compared to the county based production values.
Results
Average monthly precipitation for both GSL and BBR are presented in Figure 2.3 Results indicate
large variation in average historical monthly pre-cipitation with November through March exhibit-ing low precipitation values and April through Au-gust with high precipitation. For GSL, average pre-cipitation varied from a low of 0.26 of an inch in December to a high of 4.37 inches in June. For BBR, results were similar, with the low being 0.39 of an inch in January to a high of 4.32 inches in June. Recall that in RI-PRF each insurable interval’s trig-ger grid index is expressed as a percentage with mean 100. With a 90% coverage level (or a 10% deducible), precipitation at GSL in November/ December interval would need to drop 0.058 of an
inch to trigger a payment. For a May/June interval, precipi-tation at GSL would need to drop 0.763 of an inch, which happens to be more than the expected precipitation in No-vember/December interval. Insuring precipitation declines greater than 0.058 of an inch is substantially different than insuring precipitation declines greater than 0.763 of an inch.
At GSL, we find three insurance scenarios, high/early, high/ late, and medium/low reduce net income risk over no in-
surance, Figure 3. The high/early insurance policy re-sults in the largest decline in risk. We find three insur-ance scenarios lead to increases in risk: low/high, high/ medium/low, and low. The low insurance scenario leads to the largest increase in risk and comes from in-tervals with low expected precipitation. Additionally, the low insurance scenario provides the second highest net income, behind the medium/low insurance scenar-io. The medium/low insurance scenario provides the highest net income while slightly lowering risk to the producer. From the perspective of risk-averse produc-ers, they would select an insurance scenario between the three risk reducing options. From the perspective of the RMA in that they are mandated to provide an effec-tive risk management program, they would discontinue all risk increasing scenarios. As a result, the medium/ low insurance scenario would disappear due to low in-surance scenario intervals no longer being available. Producers would then choose between high/early and high/late insurance scenarios.
For BBR we again find three insurance scenarios reduce risk (high/early, high/late, low/high) and three that
in-crease risk (low, high/medium/low, and medium/low), Figure 4. The low/high insurance scenario provides the highest reduction in risk and the second highest in-crease in expected income. The low insurance scenario provides the highest increase in expected income; how-ever, it also increases risk. At BBR, the risk averse pro-ducer would always select low/high insurance scenario because it provides the lowest risk at the highest ex-pected income. It should be noted that high/late and high/early insurance scenarios are close in proximity to low/high insurance scenario. From the perspective of the RMA, they would discontinue the three risk in-creasing insurance scenarios. Additionally, dropping
Figure 2. Average Historical Monthly Precipitation by
Farm Location.
Figure 3: Gudmundsen Sandhills Laboratory Expected Returns versus Variance for Varying Insurance Scenarios
_____________________________
3 RI-PRF weather station monthly precipitation is
unavailable. With both locations displaying similar monthly average precipitation totals, it is likely that RI-PRF weather station data exhibit similar patterns.
the low insurance scenario removes the incentive to max-imize insurance returns, saves RMA the most subsidy dol-lars since this scenario results in the highest total premium. As a result of dropping the risk increasing scenario, the low/high insurance scenario would disappear due to low insurance scenario intervals no longer being available. Producers would then choose between the risk reducing high/early insurance scenario and high/late insurance sce-nario.
Conclusions
Risk was assessed by evaluating the change in the variance of net income when purchasing insurance with different insurance intervals. Our findings suggest risk increasing insurance intervals exist at both locations. We also found one insurance scenario (low in BBR) that provided the highest net income while increasing risk, suggesting a profit maximizing opportunity. Dropping risk increasing intervals removes the one identified case where profit max-imizing behavior was found.
Our results indicate RI-PRF reduces net income risk with intervals insuring during high expected precipitation (growing season); while net income risk increases with in-tervals insuring low expected precipitation (non-growing season, winter months). As a result, we are unsure whether it is the growing season or size of expected precipitation contributing to insurance interval effectiveness. There is no doubt that the value of expected precipitation influences the precipitation deviation, indemnity and expected pro-duction. Rainfall during winter months will not contribute to crop growth if it evaporates or drains away, which is es-pecially true on the sandy soils that are found on the ranches evaluated in this study. Recall, that a drop of only 0.058 of an inch would trigger an indemnity at GSL during November/December interval whereas in May/June inter-val the drop would need to exceed 0.763 of an inch. It
could be possible that in some loca-tions a small drop in precipitation could impact production if it was during the growing season. Insuring during the growing season appears logicalbecause insurance results indi-cate the strongest decline in net in-come risk. Future research could help shed light on whether the amount of expected precipitation or the season contributes more or less to the risk reducing effectiveness of RI-PRF insurance.
While we find no risk management benefits from insuring during the low expected precipi-tation intervals, which are during the winter, for these two locations in Nebraska, locations farther south in the U.S. may have benefits due to different expectations on monthly precipitation and the growing season occurring earlier in the calendar year.
Figure 4: Barta Brothers Ranch Expected Returns versus Variance for Varying Insurance Scenarios.
References
Maples, J.G., Brorsen, B.W., and Biermacher, J.T. 2016. The Rainfall Index Annual Forage Pilot Program as a Risk Management Tool for Cool-Season
For-age. Journal ofAgricultural and Applied Economics 48 (01): 29-51.
Miranda, M. J., & Farrin, K. 2012. Index insurance for developing countries. Applied Economic Perspectives
and Policy, 34(3), 391-427.
Schacht, W. H., Volesky, J. D., Bauer, D., Smart, A.J., and Mousel, E.M. 2000. Plant Community Patterns on the Upland Prairie in the Eastern Nebraska Sandhills. The
Prairie Naturalist 32:43-48.
United States Department of Agriculture, Risk Manage-ment Agency (USDA, RMA).
----. 1994. Summary of Business. https:// www3.rma.usda.gov/apps/sob/current_week/ insplan1994.pdf (accessed December 2015). ----. 2016a. Rainfall and Vegetation Index Insur-ance Standards Handbook. Report number RMA -18150. http://www.rma.usda.gov/ handbooks/18000/2016/16_18150.pdf (accessed May 2016). ----. 2016b. Summary of Business. https:// www3.rma.usda.gov/apps/sob/current_week/ insplan2016.pdf (accessed July 2016). ----. 2016c. Summary of Business. https:// www3.rma.usda.gov/apps/sob/current_week/ crop2016.pdf (accessed July 2016).