Benchmarking Cloud Serving Systems with YCSB
Brian F. Cooper, Adam Silberstein, Erwin Tam, Raghu Ramakrishnan, Russell Sears
Yahoo! Research Santa Clara, CA, USA
{cooperb,silberst,etam,ramakris,sears}@yahoo-inc.com
ABSTRACT
While the use of MapReduce systems (such as Hadoop) for large scale data analysis has been widely recognized and studied, we have recently seen an explosion in the number of systems developed for cloud data serving. These newer systems address “cloud OLTP” applications, though they typically do not support ACID transactions. Examples of systems proposed for cloud serving use include BigTable, PNUTS, Cassandra, HBase, Azure, CouchDB, SimpleDB, Voldemort, and many others. Further, they are being ap-plied to a diverse range of applications that differ consider-ably from traditional (e.g., TPC-C like) serving workloads. The number of emerging cloud serving systems and the wide range of proposed applications, coupled with a lack of apples-to-apples performance comparisons, makes it difficult to un-derstand the tradeoffs between systems and the workloads for which they are suited. We present the Yahoo! Cloud Serving Benchmark (YCSB) framework, with the goal of fa-cilitating performance comparisons of the new generation of cloud data serving systems. We define a core set of benchmarks and report results for four widely used systems: Cassandra, HBase, Yahoo!’s PNUTS, and a simple sharded MySQL implementation. We also hope to foster the devel-opment of additional cloud benchmark suites that represent other classes of applications by making our benchmark tool available via open source. In this regard, a key feature of the YCSB framework/tool is that it is extensible—it supports easy definition of new workloads, in addition to making it easy to benchmark new systems.
Categories and Subject Descriptors: H.3.4 [Systems and Software]: Performance evaluation
General Terms:Measurement, Performance
1.
INTRODUCTION
There has been an explosion of new systems for data stor-age and manstor-agement “in the cloud.” Open source systems include Cassandra [2, 24], HBase [4], Voldemort [9] and
oth-Permission to make digital or hard copies of all or part of this work for personal or classroom use is granted without fee provided that copies are not made or distributed for profit or commercial advantage and that copies bear this notice and the full citation on the first page. To copy otherwise, to republish, to post on servers or to redistribute to lists, requires prior specific permission and/or a fee.
SoCC’10,June 10–11, 2010, Indianapolis, Indiana, USA. Copyright 2010 ACM 978-1-4503-0036-0/10/06 ...$10.00.
ers [3, 5, 7, 8]. Some systems are offered only as cloud services, either directly in the case of Amazon SimpleDB [1] and Microsoft Azure SQL Services [11], or as part of a pro-gramming environment like Google’s AppEngine [6] or Ya-hoo!’s YQL [13]. Still other systems are used only within a particular company, such as Yahoo!’s PNUTS [17], Google’s BigTable [16], and Amazon’s Dynamo [18]. Many of these “cloud” systems are also referred to as “key-value stores” or “NoSQL systems,” but regardless of the moniker, they share the goals of massive scaling “on demand” (elasticity) and simplified application development and deployment.
The large variety has made it difficult for developers to choose the appropriate system. The most obvious differ-ences are between the various data models, such as the column-group oriented BigTable model used in Cassandra and HBase versus the simple hashtable model of Voldemort or the document model of CouchDB. However, the data models can be documented and compared qualitatively. Com-paring the performance of various systems is a harder prob-lem. Some systems have made the decision to optimize for writes by using on-disk structures that can be maintained us-ing sequential I/O (as in the case of Cassandra and HBase), while others have optimized for random reads by using a more traditional buffer-pool architecture (as in the case of PNUTS). Furthermore, decisions about data partitioning and placement, replication, transactional consistency, and so on all have an impact on performance.
Understanding the performance implications of these de-cisions for a given type of application is challenging. De-velopers of various systems report performance numbers for the “sweet spot” workloads for their system, which may not match the workload of a target application. Moreover, an apples-to-apples comparison is hard, given numbers for dif-ferent systems based on different workloads. Thus, devel-opers often have to download and manually evaluate mul-tiple systems. Engineers at Digg [20] reported evaluating eight different data stores in order to implement one feature (the Green Badge, or “what have my friends dugg” feature). There have been multiple similar examples at Yahoo!. This process is time-consuming and expensive.
Our goal is to create a standard benchmark and bench-marking framework to assist in the evaluation of different cloud systems. We focus onserving systems, which are sys-tems that provide online read/write access to data. That is, usually a web user is waiting for a web page to load, and reads and writes to the database are carried out as part of the page construction and delivery. In contrast,batch or an-alyticalsystems such as Hadoop or relational OLAP systems
provide only near-line or offline queries, and are not typically used to support serving workloads (though the result of a batch computation may be cached into a serving store for low-latency access). Other researchers [26] are doing work to benchmark analytical systems such as these. Similarly, there are existing benchmarks for a variety of data storage systems (such as SQL databases [22] and filesystems [12, 10]). However, the novel interfaces (usually neither SQL nor POSIX), elasticity, and new use cases of cloud serving systems motivate a new benchmark.
We present theYahoo! Cloud Serving Benchmark(YCSB) framework. We are using this framework to benchmark our own PNUTS system and to compare it to other cloud databases. The framework consists of a workload gener-ating client and apackageof standard workloads that cover interesting parts of the performance space (read-heavy work-loads, write-heavy workwork-loads, scan workwork-loads, etc.). An im-portant aspect of the YCSB framework is its extensibility: the workload generator makes it easy to define new work-load types, and it is also straightforward to adapt the client to benchmark new data serving systems. The YCSB frame-work and frame-workloads are available in open source so that developers can use it to evaluate systems, and contribute newworkload packagesthat model interesting applications1. In this paper, we describe the YCSB benchmark, and re-port performance results for four systems: Cassandra, HBase, PNUTS, and a simple sharded MySQL implementation. Al-though our focus in this paper is on performance and elas-ticity, the framework is intended to serve as a tool for evalu-ating other aspects of cloud systems such as availability and replication, and we discuss approaches to extending it for these purposes.
The paper is organized as follows. Section 2 provides an overview of cloud data serving systems. Section 3 discusses benchmark tiers for performance and scaling. Section 4 dis-cusses the core workloads of the benchmark in detail, while Section 5 examines the architecture and extensibility of the YCSB tool. Section 6 presents benchmarking results on sev-eral systems. We propose future benchmark tiers covering availability and replication in Section 7. Section 8 examines related work, and Section 9 presents our conclusions.
2.
CLOUD SYSTEM OVERVIEW
2.1
Cloud Serving System Characteristics
Clouds serving systems share common goals, despite the different architectures and design decisions. In general, these systems aim for:
• Scale-out: To support huge datasets (multiple terabytes or petabytes) and very high request rates, cloud systems are architected toscale-out, so that large scale is achieved using large numbers of commodity servers, each running copies of the database software. An effective scale-out system must balance load across servers and avoid bot-tlenecks.
• Elasticity: While scale-out provides the ability to have large systems, elasticity means that we can add more capacity to a running system by deploying new instances of each component, and shifting load to them.
1YCSB can be obtained from
http://research.yahoo.com/-Web Information Management/YCSB.
• High availability: Cloud systems must provide high levels of availability. In particular, they are often multi-tenant systems, which means that an outage affects many different applications. Moreover, the use of commodity hardware means that failures are relatively common, and automated recovery must be a first-class operation of the system.
The main motivation for developing new cloud serving systems is the difficulty in providing all of these features (es-pecially scale-out and elasticity) using traditional database systems. As a tradeoff, cloud systems typically sacrifice the complex query capabilities and strong, sophisticated trans-action models found in traditional systems. Without the need for complex planning and processing of joins and aggre-gates, scale-out and elasticity become significantly easier to achieve. Similarly, scale-out (especially to multiple datacen-ters) is easier to achieve without strong transaction protocols like two-phase commit or Paxos. In particular, it is impos-sible to simultaneously guarantee availability, consistency and partition tolerance [21]. Because network partitions (or delays and failures which mimic partitions) are unavoidable, systems must prioritize either availability or consistency, and most cloud systems choose availability. As a result, cloud systems typically provide a consistency model that is weaker in various ways than traditional ACID databases.
2.2
Classification of Systems and Tradeoffs
We now examine the different architectural decisions made by cloud systems. As with many types of computer systems, no one system can be best for all workloads, and different systems make different tradeoffs in order to optimize for dif-ferent applications. The main tradeoffs facing cloud serving systems are:
• Read performance versus write performance
In a serving system, it is difficult to predict which record will be read or written next. Unless all data fits in mem-ory, this means that random I/O to the disk is needed to serve reads (e.g., as opposed to scans). Random I/O can be used for writes as well, but much higher write throughput can be achieved by appending all updates to a sequential disk-based log. However, log-structured systems that only store update deltas can very inefficient for reads if the data is modified over time, as typically multiple updates from different parts of the log must be merged to provide a con-sistent record. Writing the complete record to the log on each update avoids the cost of reconstruction at read time, but there is a correspondingly higher cost on update. Log-structured merge trees [29] avoid the cost of reconstructing on reads by using a background process to merge updates and cluster records by primary key, but the disk cost of this process can reduce performance for other operations. Over-all, then, there is an inherent tradeoff between optimizing for reads and optimizing for writes.
A particular case of this tradeoff is seen in systems such as HBase that are based on filesystems optimized for batch processing (for example, HBase is built on HDFS, which is the data store for Hadoop). For a system to excel at batch processing, it requires high throughput sequential reads and writes, rather than fast random accesses; thus, Hadoop only supports append-only files. Updates to existing records must be handled by using a differential files scheme that shares
the same disadvantages as a log-structured file system with respect to reads.
• Latency versus durability
Writes may be synched to disk before the system returns suc-cess to the user, or they may be stored in memory at write time and synched later. The advantages of the latter ap-proach are that avoiding disk greatly improves write latency, and potentially improves throughput (if multiple writes to the same record can be serviced by a single I/O operation or can be condensed in memory). The disadvantage is risk of data loss if a server crashes and loses unsynched updates.
• Synchronous versus asynchronous replication
Replication is used to improve system availability (by di-recting traffic to a replica after a failure), avoid data loss (by recovering lost data from a replica), and improve per-formance (by spreading load across multiple replicas and by making low-latency access available to users around the world). However, there are different approaches to repli-cation. Synchronous replication ensures all copies are up to date, but potentially incurs high latency on updates. Furthermore, availability may be impacted if synchronously replicated updates cannot complete while some replicas are offline. Asynchronous replication avoids high write latency (in particular, making it suitable for wide area replication) but allows replicas to be stale. Furthermore, data loss may occur if an update is lost due to failure before it can be replicated.
• Data partitioning
Systems may be strictly row-based, or allow for column storage. In row-based storage all of a record’s fields are stored contiguously on disk. With column storage, differ-ent columns or groups of columns can be stored separately (possibly on different servers). Row-based storage supports efficient access to an entire record (including low latency reads and insertion/update in a serving-oriented system), and is ideal if we typically access a few records in their en-tirety. Column-based storage is more efficient for accessing a subset of the columns, particularly when multiple records are accessed.
2.3
A Brief Survey of Cloud Data Systems
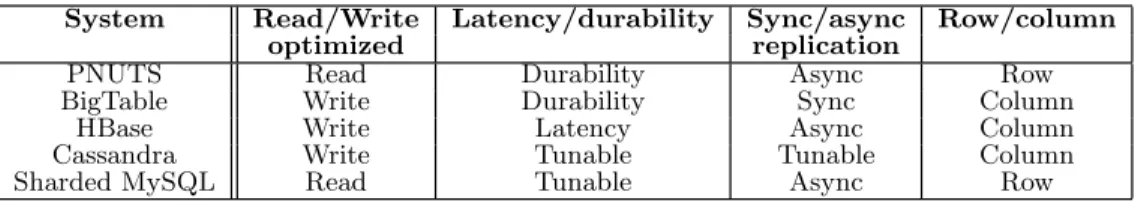
To illustrate these tradeoffs, Table 1 lists several cloud systems and the choices they have made for each dimension. We now examine some of these decisions.
An application developer must match their workload re-quirements to the best suited cloud database system. Con-sider the read-optimized versus write-optimized tradeoff. BigTable-like systems such as Cassandra and HBase attempt to always perform sequential I/O for updates. Records on disk are never overwritten; instead, updates are written to a buffer in memory, and the entire buffer is written sequen-tially to disk. Multiple updates to the same record may be flushed at different times to different parts of the disk. The result is that to perform a read of a record, multiple I/Os are needed to retrieve and combine the various up-dates. Since all writing is sequential, it is very fast; but reads are correspondingly de-optimized. In contrast, a more traditional buffer-pool architecture, such as that in MySQL and PNUTS, overwrites records when they are updated. Be-cause updates require random I/O, they are slower than the
BigTable-like systems; but reads are fast because a single I/O can retrieve the entire, up-to-date record.
Latency versus durability is another important axis. If developers know they can lose a small fraction of writes (for example, web poll votes), they can return success to writes without waiting for them to be synched to disk. Cassandra allows the client to specify on a per-call basis whether the write is durably persisted. MySQL and PNUTS always force log updates to disk when committing a transaction, although this log force can be disabled. HBase does not sync log updates to disk, which provides low latency updates and high throughput. This is appropriate for HBase’s target use cases, which are primarily to run batch analytics over serving data, rather than to provide guaranteed durability for such data. For such a system, high throughput sequential reads and writes are favored over durability for random updates.
Synchronous replication ensures freshness of replicas, and is used in HBase and Cassandra. Cassandra also supports asynchronous replication, as do MySQL and PNUTS. Asyn-chronous replication supports wide-area replication without adding significant overhead to the update call itself.
Column storage is advantageous for applications that need only access a subset of columns with each request, and know these subsets in advance. BigTable, HBase, and Cassandra all provide the ability to declare column groups or fami-lies, and add columns to any of them. Each group/family is physically stored separately. On the other hand, if re-quests typically want the entire row, or arbitrary subsets of it, partitioning that keeps the entire row physically together is best. This can be done with row storage (as in PNUTS), or by using a single column group/family in a column store like Cassandra.
The systems we discuss here are representative, rather than comprehensive. A variety of other systems make dif-ferent decisions. While we cannot survey them all here, we will point out a few interesting characteristics. Dynamo, Voldemort and Cassandra use eventual consistency to bal-ance replication and availability. In this model, writes are allowed anywhere, and conflicting writes to the same object are resolved later. Amazon SimpleDB and Microsoft Azure are hosted cloud serving stores. Both provide transactional functions not found in other serving stores. The caveat is that the user must partition their data into different contain-ers, both in terms of size and request rate. SimpleDB calls these containersdomains, while Azure calls themdatabases. The wide variance in design decisions has significant perfor-mance implications, which motivated us to develop a bench-mark for quantitatively evaluating those implications.
3.
BENCHMARK TIERS
In this section, we propose two benchmark tiers for eval-uating the performance and scalability of cloud serving sys-tems. Our intention is to extend the benchmark to deal with more tiers for availability and replication, and we discuss our initial ideas for doing so in Section 7.
3.1
Tier 1—Performance
The Performance tier of the benchmark focuses on the latency of requests when the database is under load. La-tency is very important in serving systems, since there is usually an impatient human waiting for a web page to load. However, there is an inherent tradeoff between latency and throughput: on a given hardware setup, as the amount of
System Read/Write Latency/durability Sync/async Row/column
optimized replication
PNUTS Read Durability Async Row
BigTable Write Durability Sync Column
HBase Write Latency Async Column
Cassandra Write Tunable Tunable Column
Sharded MySQL Read Tunable Async Row
Table 1: Design decisions of various systems.
load increases, the latency of individual requests increases as well since there is more contention for disk, CPU, network, and so on. Typically application designers must decide on an acceptable latency, and provision enough servers to achieve the desired throughput while preserving acceptable latency. A system with better performance will achieve the desired latency and throughput with fewer servers.
The Performance tier of the benchmark aims to charac-terize this tradeoff for each database system by measuring latency as we increase throughput, until the point at which the database system is saturated and throughput stops in-creasing. In the terminology of the Wisconsin Benchmark, a popular early benchmark used for parallel database systems, our metric is similar tosizeup [19], where the hardware is kept constant but the size of the workload increases.
To conduct this benchmark tier, we need aworkload gen-eratorwhich serves two purposes: first, to define the dataset and load it into the database; and second, to execute op-erations against the dataset while measuring performance. We have implemented the YCSB Client (described in more detail in Sections 4 and 5) for both purposes. A set of pa-rameter files defines the nature of the dataset and the opera-tions (transacopera-tions) performed against the data. The YCSB Client allows the user to define the offered throughput as a command line parameter, and reports the resulting la-tency, making it straightforward to produce latency versus throughput curves.
3.2
Tier 2—Scaling
A key aspect of cloud systems is their ability to scale elas-tically, so that they can handle more load as applications add features and grow in popularity. The Scaling tier of the database examines the impact on performance as more ma-chines are added to the system. There are two metrics to measure in this tier:
Scaleup—How does the database perform as the number of machines increases? In this case, we load a given number of servers with data and run the workload. Then, we delete the data, add more servers, load a larger amount of data on the larger cluster, and run the workload again. If the database system has good scaleup properties, the performance (e.g., latency) should remain constant, as the number of servers, amount of data, and offered throughput scale proportionally. This is equivalent to thescaleupmetric from [19].
Elastic speedup—How does the database perform as the number of machines increases while the system is running? In this case, we load a given number of servers with data and run the workload. As the workload is running, we add one or more servers, and observe the impact on performance. A system that offers good elasticity should show a perfor-mance improvement when the new servers are added, with a
short or non-existent period of disruption while the system is reconfiguring itself to use the new server. This is similar to thespeedup metric from [19], with the added twist that the new server is added while the workload is running.
4.
BENCHMARK WORKLOADS
We have developed a core set of workloads to evaluate dif-ferent aspects of a system’s performance, called theYCSB Core Package. In our framework, apackage is a collection of related workloads. Each workload represents a particular mix of read/write operations, data sizes, request distribu-tions, and so on, and can be used to evaluate systems at one particular point in the performance space. A package, which includes multiple workloads, examines a broader slice of the performance space. While the core package examines sev-eral interesting performance axes, we have not attempted to exhaustively examine the entire performance space. Users of YCSB can develop their own packages either by defining a new set of workload parameters, or if necessary by writing Java code. We hope to foster an open-source effort to create and maintain a set of packages that are representative of many different application settings through the YCSB open source distribution. The process of defining new packages is discussed in Section 5.
To develop the core package, we examined a variety of systems and applications to identify the fundamental kinds of workloads web applications place on cloud data systems. We did not attempt to exactly model a particular applica-tion or set of applicaapplica-tions, as is done in benchmarks like TPC-C. Such benchmarks give realistic performance results for a narrow set of use cases. In contrast, our goal was to examine a wide range of workload characteristics, in order to understand in which portions of the space of workloads systems performed well or poorly. For example, some sys-tems may be highly optimized for reads but not for writes, or for inserts but not updates, or for scans but not for point lookups. The workloads in the core package were chosen to explore these tradeoffs directly.
The workloads in the core package are a variation of the same basic application type. In this application, there is a table of records, each withF fields. Each record is identi-fied by a primary key, which is a string like “user234123”. Each field is namedfield0,field1 and so on. The values of each field are a random string of ASCII characters of length L. For example, in the results reported in this paper, we construct 1,000 byte records by usingF = 10 fields, each of L= 100 bytes.
Each operation against the data store is randomly chosen to be one of:
• Update: Update a record by replacing the value of one field.
• Read: Read a record, either one randomly chosen field or all fields.
• Scan: Scan records in order, starting at a randomly chosen record key. The number of records to scan is randomly chosen.
For scan specifically, the distribution of scan lengths is chosen as part of the workload. Thus, thescan() method takes an initial key and the number of records to scan. Of course, a real application may instead specify a scan interval (i.e., from February 1st to February 15th). The number of records parameter allows us to control the size of these in-tervals, without having to determine and specify meaningful endpoints for the scan. (All of the database calls, including scan(), are described in Section 5.2.1.)
4.1
Distributions
The workload client must make many random choices when generating load: which operation to perform (Insert, Update, Read or Scan), which record to read or write, how many records to scan, and so on. These decisions are gov-erned by random distributions. YCSB has several built-in distributions:
• Uniform: Choose an item uniformly at random. For ex-ample, when choosing a record, all records in the database are equally likely to be chosen.
• Zipfian: Choose an item according to the Zipfian dis-tribution. For example, when choosing a record, some records will be extremely popular (theheadof the distri-bution) while most records will be unpopular (thetail).
• Latest: Like the Zipfian distribution, except that the most recently inserted records are in the head of the dis-tribution.
• Multinomial: Probabilities for each item can be speci-fied. For example, we might assign a probability of 0.95 to the Read operation, a probability of 0.05 to the Up-date operation, and a probability of 0 to Scan and Insert. The result would be a read-heavy workload.
Figure 1 illustrates the difference between the uniform, zipfian and latest distributions. The horizontal axes in the figure represent the items that may be chosen (e.g., records) in order of insertion, while the vertical bars represent the probability that the item is chosen. Note that the last in-serted item may not be inin-serted at the end of the key space. For example, Twitter status updates might be clustered by user, rather than by timestamp, meaning that two recently inserted items may be far apart in the key space.
A key difference between the Latest and Zipfian distribu-tions is their behavior when new items are inserted. Under the Latest distribution, the newly inserted item becomes the most popular, while the previously popular items become less so. Under the Zipfian distribution, items retain their popularity even as new items are inserted, whether or not the newly inserted item is popular. The Latest distribution is meant to model applications where recency matters; for example, only recent blog posts or news stories are popular, and the popularity decays quickly. In contrast, the Zipfian distribution models items whose popularity is independent of their newness; a particular user might be extremely
pop-Uniform: Insertion order Popularity 0 1 ... N Zipfian: Insertion order Popularity 0 1 ... N Latest: Insertion order Popularity 0 1 ... N
Figure 1: Probability distributions. Horizontal axes represents items in order of insertion, and vertical axes represent probability of being chosen.
ular, with many views of her profile page, even though she has joined many years ago.
4.2
The Workloads
We defined the workloads in the core package by assign-ing different distributions to the two main choices we must make: which operation to perform, and which record to read or write. The various combinations are shown in Table 2. Although we do not attempt to model complex applications precisely (as discussed above), we list a sample application that generally has the characteristics of the workload.
Loading the database is likely to take longer than any individual experiment. In our tests, loads took between 10-20 hours (depending on the database system), while we ran each experiment (e.g., a particular workload at a particular target throughput against a particular database) for 30 min-utes. All the core package workloads use the same dataset, so it is possible to load the database once and then run all the workloads. However, workloads A and B modify records, and D and E insert records. If database writes are likely to impact the operation of other workloads (e.g., by fragment-ing the on-disk representation) it may be necessary to re-load the database. We do not prescribe a particular database loading strategy in our benchmark, since different database systems have different loading mechanisms (including some that have no special bulk load facility at all).
5.
DETAILS OF THE BENCHMARK TOOL
We have developed a tool, called the YCSB Client, to execute the YCSB benchmarks. A key design goal of our tool is extensibility, so that it can be used to benchmark new cloud database systems, and so that new workloads can be developed. We have used this tool to measure the performance of several cloud systems, as we report in the next section. This tool is also available under an open source license, so that others may use and extend the tool, and contribute new workloads and database interfaces.
Workload Operations Record selection Application example
A—Update heavy Read: 50% Zipfian Session store recording recent actions in a user session
Update: 50%
B—Read heavy Read: 95% Zipfian Photo tagging; add a tag is an update, but most operations
Update: 5% are to read tags
C—Read only Read: 100% Zipfian User profile cache, where profiles are constructed elsewhere
(e.g., Hadoop)
D—Read latest Read: 95% Latest User status updates; people want to read the latest statuses
Insert: 5%
E—Short ranges Scan: 95% Zipfian/Uniform* Threaded conversations, where each scan is for the posts in a
Insert: 5% given thread (assumed to be clustered by thread id)
*Workload E uses the Zipfian distribution to choose the first key in the range, and the Uniform distribution to choose the number of records to scan.
Table 2: Workloads in the core package
− ... Threads Workload file − Read/write mix − Record size − Popularity distribution − ... YCSB Client
Command line properties − DB to use − Workload to use − Target throughput − Number of threads Client Stats Executor DB Interface Layer Workload Serving Store Cloud
Figure 2: YCSB client architecture
In this section we describe the architecture of the YCSB client, and examine how it can be extended. We also de-scribe some of the complexities in producing distributions for the workloads.
5.1
Architecture
The YCSB Client is a Java program for generating the data to be loaded to the database, and generating the op-erations which make up the workload. The architecture of the client is shown in Figure 2. The basic operation is that the workload executor drives multiple client threads. Each thread executes a sequential series of operations by mak-ing calls to the database interface layer, both to load the database (theload phase) and to execute the workload (the
transaction phase). The threads throttle the rate at which they generate requests, so that we may directly control the offered load against the database. The threads also measure the latency and achieved throughput of their operations, and report these measurements to the statistics module. At the end of the experiment, the statistics module aggregates the measurements and reports average, 95th and 99th percentile latencies, and either a histogram or time series of the laten-cies.
The client takes a series of properties (name/value pairs) which define its operation. By convention, we divide these properties into two groups:
• Workload properties: Properties defining the
work-load, independent of a given database or experimental run. For example, the read/write mix of the database, the distribution to use (zipfian, latest, etc.), and the size and number of fields in a record.
• Runtime properties:Properties specific to a given ex-periment. For example, the database interface layer to use (e.g., Cassandra, HBase, etc.), properties used to initialize that layer (such as the database service host-names), the number of client threads, etc.
Thus, there can be workload property files which remain static and are used to benchmark a variety of databases (such as the YCSB core package described in Section 4). In contrast, runtime properties, while also potentially stored in property files, will vary from experiment to experiment, as the database, target throughput, etc., change.
5.2
Extensibility
A primary goal of YCSB is extensibility. In fact, one of our motivations was to make it easy for developers to benchmark the increasing variety of cloud serving systems. The shaded boxes in Figure 2 show the components which can be easily replaced. The Workload Executor contains code to execute both the load and transaction phases of the workload. The YCSB package includesCoreWorkload, a standard workload executor for the core package described in Section 4. Users of YCSB can define new packages in two ways. The most straightforward is to define a set of workloads that useCoreWorkloadbut define different work-load parameters. This allows users to vary several axes of the core package: which operation to perform, the skew in record popularity, and the size and number of records. The second approach is to define a new workload executor class (e.g., by writing Java) and associated parameters. This ap-proach allows for introducing more complex operations, and exploring different tradeoffs, than the core package does; but involves greater effort compared to the former approach.
TheDatabase Interface Layer translates simple requests (such asread()) from the client threads into calls against the database (such as Thrift calls to Cassandra or REST requests to PNUTS). The Workload Executor and Database Interface Layer classes to use for an experiment are specified as properties, and those classes are loaded dynamically when the client starts. Of course, as an open source package, any class in the YCSB tool can be replaced, but the Workload Executor and Database Interface Layer can be replaced most easily. We now discuss in more detail how the YCSB client can be extended with new database backends and workloads.
5.2.1 New Database Backends
The YCSB Client can be used to benchmark new database systems by writing a new class to implement the following methods:
• read()—read a single record from the database, and re-turn either a specified set of fields or all fields.
• insert()—insert a single record into the database.
• update()—update a single record in the database, adding or replacing the specified fields.
• delete()—delete a single record in the database.
• scan()—execute a range scan, reading a specified num-ber of records starting at a given record key.
These operations are quite simple, representing the stan-dard “CRUD” operations: Create, Read, Update, Delete, with Read operations to read one record or to scan records. Despite its simplicity, this API maps well to the native APIs of many of the cloud serving systems we examined.
5.2.2 New Workload Executors
A user can define a new workload executor to replace CoreWorkloadby extending theWorkloadclass of the YCSB framework. One instance of the workload object is cre-ated and shared among the worker threads, which allows the threads to share common distributions, counters and so on. For example, the workload object can maintain a counter used to generate new unique record ids when insert-ing records. Similarly the workload object can maintain a commonLatestGeneratorobject, which assigns high pop-ularity to the latest record ids generated by the counter.
For each operation, the thread will either execute the workload object’s doInsert() method (if the client is in theload phase) or the workload object’s doTransaction() method (if the client is in thetransaction phase).
5.3
Distributions
One unexpectedly complex aspect of implementing the YCSB tool involved implementing the Zipfian and Latest distributions. In particular, we used the algorithm for gen-erating a Zipfian-distributed sequence from Gray et al [23]. However, this algorithm had to be modified in several ways to be used in our tool. The first problem is that the popular items are clustered together in the keyspace. In particular, the most popular item is item 0; the second most popular item is item 1, and so on. For the Zipfian distribution, the popular items should be scattered across the keyspace. In real web applications, the most popular user or blog topic is not necessarily the lexicographically first item.
To scatter items across the keyspace, we hashed the out-put of the Gray generator. That is, we called anextItem() method to get the next (integer) item, then took a hash of that value to produce the key that we use. The choice of hash function is critical: the Java built-in String.hashCode() function tended to leave the popular items clustered. Fur-thermore, after hashing, collisions meant that only about 80 percent of the keyspace would be generated in the sequence. This was true even as we tried a variety of hash functions (FNV, Jenkins, etc.). One approach would be to use perfect hashing, which avoids collisions, with a downside that more setup time is needed to construct the perfect hash (multiple minutes for hundreds of millions of records) [15]. The ap-proach that we took was to construct a Zipfian generator for
a much larger keyspace than we actually needed; apply the FNV hash to each generated value; and then take mod N (whereN size of the keyspace, that is, number of records in the database). The result was that 99.97 % of the keyspace is generated, and the generated keys continued to have a Zipfian distribution.
The second issue was dealing with changing numbers of items in the distribution. For some workloads, new records are inserted into the database. The Zipfian distribution should result in the same records being popular, even af-ter insertions, while in the Latest distribution, popularity should shift to the new keys. For the Latest, we computed a new distribution when a record was inserted; to do this cheaply we modified the Gray algorithm of [23] to compute its constants incrementally. For Zipfian, we expanded the initial keyspace to the expected size after inserts. If a data set had N records, and the workload had T total opera-tions, with an expected fraction I of inserts, then we con-structed the Zipfian generator to draw from a space of size N+T×I+. We added an additional factor since the actual number of inserts depends on the random choice of operations during the workload according to a multinomial distribution. While running the workload, if the genera-tor produced an item which had not been inserted yet, we skipped that value and drew another. Then, the popularity distribution did not shift as new records were inserted.
6.
RESULTS
We present benchmarking results for four systems: Cas-sandra, HBase, PNUTS and sharded MySQL. While both Cassandra and HBase have a data model similar to that of Google’s BigTable [16], their underlying implementations are quite different—HBase’s architecture is similar to BigTable (using synchronous updates to multiple copies of data chunks), while Cassandra’s is similar to Dynamo [18] (e.g., using gos-sip and eventual consistency). PNUTS has its own data model, and also differs architecturally from the other sys-tems. Our implementation of sharded MySQL (like other implementations we have encountered) does not support elas-tic growth and data repartitioning. However, it serves well as a control in our experiments, representing a conventional distributed database architecture, rather than a cloud-oriented system designed to be elastic. More details of these systems are presented in Section 2.
In our tests, we ran the workloads of the core package de-scribed in Section 4, both to measure performance mark tier 1) and to measure scalability and elasticity (bench-mark tier 2). Here we report the average latency of requests. The 95th and 99th percentile latencies are not reported, but followed the same trends as average latency. In summary, our results show:
• The hypothesized tradeoffs between read and write opti-mization are apparent in practice: Cassandra and HBase have higher read latencies on a read heavy workload than PNUTS and MySQL, and lower update latencies on a write heavy workload.
• PNUTS and Cassandra scaled well as the number of servers and workload increased proportionally. HBase’s performance was more erratic as the system scaled.
• Cassandra, HBase and PNUTS were able to grow elasti-cally while the workload was executing. However, PNUTS
0 10 20 30 40 50 60 70 0 2000 4000 6000 8000 10000 12000 14000 Read latency (ms) Throughput (ops/sec) Cassandra HBase PNUTS MySQL 0 10 20 30 40 50 60 70 80 0 2000 4000 6000 8000 10000 12000 14000 Update latency (ms) Throughput (ops/sec) Cassandra HBase PNUTS MySQL (a) (b)
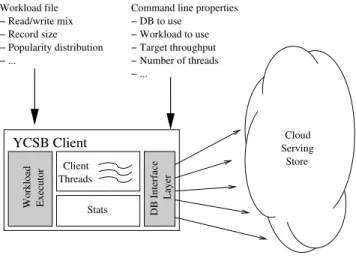
Figure 3: Workload A—update heavy: (a) read operations, (b) update operations. Throughput in this (and all figures) represents total operations per second, including reads and writes.
provided the best, most stable latency while elastically repartitioning data.
It is important to note that the results we report here are for particular versions of systems that are undergoing con-tinuous development, and the performance may change and improve in the future. Even during the interval from the initial submission of this paper to the camera ready version, both HBase and Cassandra released new versions that sig-nificantly improved the throughput they could support. We provide results primarily to illustrate the tradeoffs between systems and demonstrate the value of the YCSB tool in benchmarking systems. This value is both to users and de-velopers of cloud serving systems: for example, while trying to understand one of our benchmarking results, the HBase developers uncovered a bug and, after simple fixes, nearly doubled throughput for some workloads.
6.1
Experimental Setup
For most experiments, we used six server-class machines (dual 64-bit quad core 2.5 GHz Intel Xeon CPUs, 8 GB of RAM, 6 disk RAID-10 array and gigabit ethernet) to run each system. We also ran PNUTS on a 47 server cluster to successfully demonstrate that YCSB can be used to bench-mark larger systems. PNUTS required two additional ma-chines to serve as a configuration server and router, and HBase required an additional machine called the “master server.” These servers were lightly loaded, and the results we report here depend primarily on the capacity of the six storage servers. The YCSB Client ran on a separate 8 core machine. The Client was run with up to 500 threads, de-pending on the desired offered throughput. We observed in our tests that the client machine was not a bottleneck; in particular, the CPU was almost idle as most time was spent waiting for the database system to respond.
We ran Cassandra 0.5.0, HBase 0.20.3, and MySQL 5.1.24 (for PNUTS) and 5.1.32 (for sharded MySQL). For one ex-periment (elastic speedup), we used Cassandra 0.6.0-beta2, at the suggestion of the Cassandra developers. For Cas-sandra, we used the OrderedPartitioner with node tokens evenly spaced around the key space. Our sharded MySQL implementation used client-side hashing to determine which server a given record should be stored on.
We configured and tuned each system as well as we knew how. In particular, we received extensive tuning assistance from members of the development teams of the Cassandra,
HBase and PNUTS systems. For HBase, we allocated 1GB of heap to Hadoop, and 5GB to HBase. For PNUTS and sharded MySQL, we allocated 6 GB of RAM to the MySQL buffer pool. For Cassandra, we allocated 3GB of heap to the JVM, at the suggestion of Cassandra developers, so the rest of RAM could be used for the Linux filesystem buffer. We disabled replication on each system so that we could bench-mark the baseline performance of the system itself. In on-going work we are examining the impact of replication. For Cassandra, sharded MySQL and PNUTS, all updates were synched to disk before returning to the client. HBase does not sync to disk, but relies on in-memory replication across multiple servers for durability; this increases write through-put and reduces latency, but can result in data loss on fail-ure. We ran HBase experiments with and without client-side buffering; since buffering gave a significant throughput ben-efit, we mainly report on those numbers. Cassandra, and possibly PNUTS and sharded MySQL, may have benefited if we had given them a dedicated log disk. However, to ensure a fair comparison, we configured all systems with a single RAID-10 array and no dedicated log disk. Users of YCSB are free to set up alternative hardware configurations to see if they can get better performance.
HBase performance is sensitive to the number of log struc-tured files per key range, and the number of writes buffered in memory. HBase shrinks these numbers usingcompactions
and flushes, respectively, and they can be system or user-initiated. We periodically applied these operations during our experiments; but HBase users must evaluate how often such operations are needed in their own environment.
Our database consisted of 120 million 1 KB records, for a total size of 120 GB. Each server thus had an average of 20 GB of data, more than it could cache entirely in RAM. Read operations retrieved an entire record, while updates modified one of the fields (out of ten).
6.2
Workload A—Update Heavy
First, we examined Workload A, which has 50 percent reads and 50 percent updates. Figure 3 shows latency ver-sus throughput curves for each system for both the read and update operations. In each case, we increased the of-fered throughput until the actual throughput stopped in-creasing. As the figure shows, for all systems, operation la-tency increased as offered throughput increased. Cassandra, which is optimized for write-heavy workloads, achieved the
0 5 10 15 20 25 30 35 40 0 2000 4000 6000 8000 10000 Read latency (ms) Throughput (ops/sec) Cassandra HBase PNUTS MySQL 0 5 10 15 20 0 2000 4000 6000 8000 10000 Update latency (ms) Throughput (ops/sec) Cassandra HBase PNUTS MySQL (a) (b)
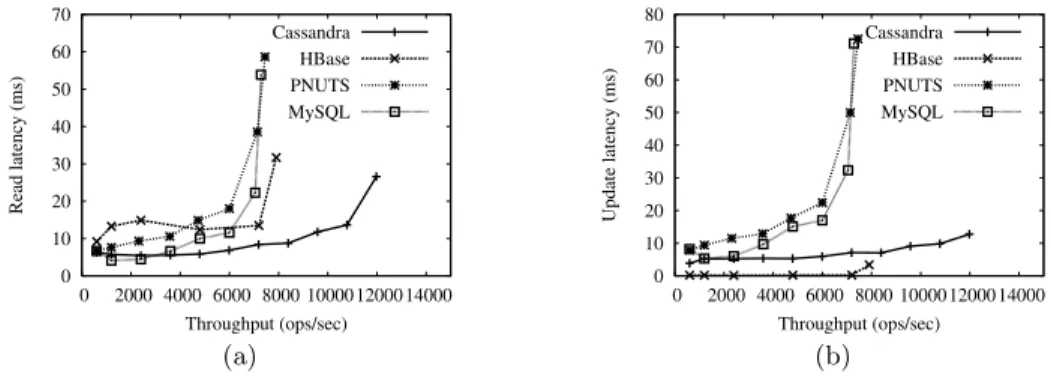
Figure 4: Workload B—read heavy: (a) read operations, (b) update operations.
best throughput and the lowest latency for reads. At high throughputs, Cassandra’s efficient sequential use of disk for updates reduces contention for the disk head, meaning that read latency is lower than for the other systems. PNUTS has slightly higher latency than MySQL, because it has extra logic on top of MySQL for distributed consistency. HBase had very low latency for updates, since updates are buffered in memory. With buffering off, writes are committed to memory on the HBase server, and latency was only 10-50% lower than read latency. Because of efficient sequential up-dates, Cassandra also provides the best throughput, peaking at 11978 operations/sec, compared to 7904 operations/sec for HBase, 7283 operations/sec for sharded MySQL, and 7448 operations/sec for PNUTS.
6.3
Workload B—Read Heavy
Workload B, the read heavy workload, provides a differ-ent picture than workload A. The results for workload B are shown in Figure 4. As the figure shows, PNUTS and sharded MySQL are now able to provide lower latencies on reads than either Cassandra or HBase. Cassandra and HBase still perform better for writes. The extra disk I/Os being done by Cassandra to assemble records for reading dominates its performance on reads. Note that Cassandra only begins to show higher read latency at high throughputs, indicat-ing that the effects matter primarily when the disk is close to saturation. HBase also has to reconstruct fragments of records from multiple disk pages. However, the read latency is relatively higher because of HBase’s log-structured stor-age implementation. HBase flushes its memtables to disk in separate files, and potentially must search each such file for fragments of the record, even if only some contain relevant fragments. In fact, we observe worse latency and through-put as the number of files grows, and improvement when the number shrinks through compaction. When there is a great deal of fragmentation (for example, after a large num-ber of writes), throughput drops to as low as 4800 opera-tions/sec due to the expense of reconstruction. Future im-provements, such as Bloom filters, may cut down such false positive searches.
6.4
Workload E—Short Ranges
We ran workload E (short ranges) using HBase, Cassandra and PNUTS, with ranges up to 100 records. Our sharded MySQL implementation is a hash table and does not sup-port range scans. The results are shown in Figure 5. As the
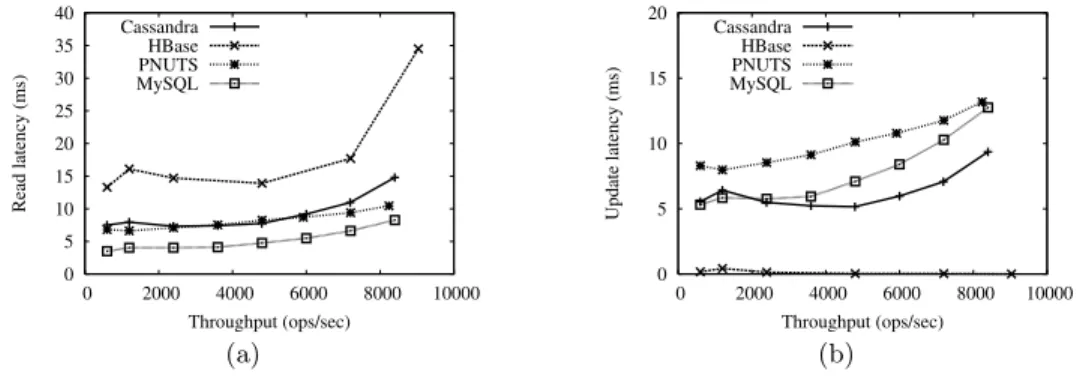
0 20 40 60 80 100 120 0 200 400 600 800 1000 1200 1400 1600 Read latency (ms) Throughput (ops/sec) Cassandra HBase PNUTS
Figure 5: Workload E—short scans.
results show, both HBase and PNUTS can sustain similar maximum throughputs (1519 ops/sec for HBase, and 1440 ops/sec for PNUTS) with roughly equivalent latency. Cas-sandra performs much worse. CasCas-sandra’s range scan sup-port is relatively new in version 0.5.0, and is not yet heavily optimized; future versions may or may not be able to pro-vide better scan latency. HBase and PNUTS have similar scan performance, but only for short scans. We ran an ex-periment where we varied the average range query from 25 to 800 records. The results (not shown) demonstrate that HBase has better scan performance when the range scans retrieve more than 100 records on average. MySQL’s on disk storage used a B-Tree to support low latency reads; but B-trees inherently have some fragmentation, so the cost of reading pages with empty space increases the cost of a range scan in PNUTS. HBase stores data more compactly on disk, improving performance for large ranges. For exam-ple, when the average range scan is for 800 records, HBase’s response time is 3.5 times faster than PNUTS.
6.5
Other Workloads
Next, we ran the other core YCSB workloads. The re-sults of workload C (read only) were similar to those of the read-heavy workload B: PNUTS and sharded MySQL achieved the lowest latency and highest throughput for the read operations. Workload D (read latest) also showed sim-ilar results to workload B. Although the popularity of items shifted over time, the dominant effect was that PNUTS and MySQL were most efficient for reads, and workload D is dominated by read requests. Note that in workload D the recently inserted records are not necessarily clustered on the
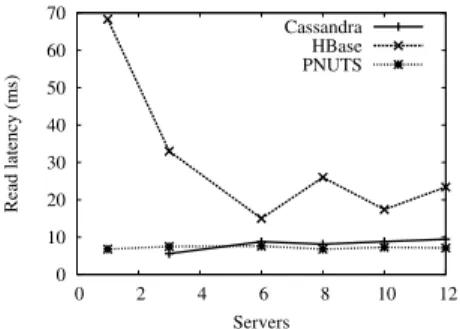
0 10 20 30 40 50 60 70 0 2 4 6 8 10 12 Read latency (ms) Servers Cassandra HBase PNUTS
Figure 6: Read performance as cluster size in-creases.
same server. Such a clustering scheme would not likely be used in practice, as it would result in a severe hotspot on one server while the other servers were underutilized. “Read latest” applications instead typically construct the record keys to cluster records by some other attribute to avoid this hotspot, and we did this as well. This mimics the design of an application like blogging or Twitter, where recent up-dates are most popular but are likely clustered by user rather than by time. We have omitted the graphs for workloads C and D for lack of space.
We also ran a “read-modify-write” workload that reflects the frequently used pattern of reading a record, modifying it, and writing the changes back to the database. This work-load is similar to workwork-load A (50/50 read/write ratio) except that the updates are “read-modify-write” rather than blind writes. The results (not shown) showed the same trends as workload A.
6.6
Scalability
So far, all experiments have used six storage servers. (As mentioned above, we did run one experiment with PNUTS on 47 servers, to verify the scalability of YCSB itself). How-ever, cloud serving systems are designed to scale out: more load can be handled when more servers are added. We first tested thescaleup capability of Cassandra, HBase and PNUTS by varying the number of storage servers from 2 to 12 (while varying the data size and request rate proportion-ally). The resulting read latency for workload B is shown in Figure 6. As the results show, latency is nearly constant for Cassandra and PNUTS, indicating good elastic scaling properties. In contrast, HBase’s performance varies a lot as the number of servers increases; in particular, performance is better for larger numbers of servers. A known issue in HBase is that its behavior is erratic for very small clusters (less than three servers.)
6.7
Elastic Speedup
We also examined theelastic speedupof Cassandra, HBase and PNUTS. Sharded MySQL is inherently inelastic. In this case, we started two servers, loaded with 120 GB of data. We then added more servers, one at a time, until there were six servers running. After adding each server, we attempted to run long enough to allow the system to stabilize before adding the next server (although in some cases it was diffi-cult to determine if the system had truly stabilized.) Dur-ing the entire run, we set the YCSB client to offer the same throughput; in particular, the offered throughput was 80
percent of that achievable with 6 servers. This models a situation where we attempt to elastically expand an over-loaded cluster to a size where it can handle the offered load, a situation that often occurs in practice.
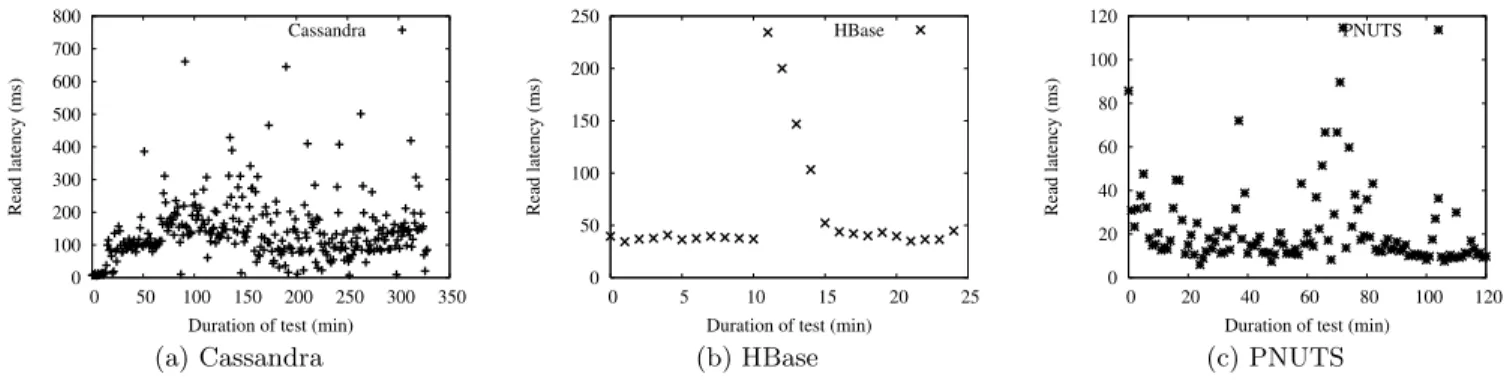
First, we show a slice of the time series of read latencies for Cassandra in Figure 7(a). In this figure, the first ten minutes represent five servers, after performance has stabilized; then, a sixth server is added. As the figure shows, this results in a sharp increase in latency, as well as a wide variance in the latency. This performance degradation results from moving data to the 6th server; regular serving requests compete for disk and network resources with the data repartitioning pro-cess, resulting in high and highly variable latency. In fact, under load, it takes many hours for Cassandra to stabilize. In our test, we had to stop the YCSB workload after 5.5 hours to allow the system to complete its repartitioning and quiesce. The high cost of repartitioning is a known issue with Cassandra 0.5.0 and is being optimized in ongoing develop-ment. After completing its repartitioning, the performance of the system under load matched that of a system that had started with 6 servers, indicating that eventually, the elastic expansion of the cluster will result in good performance.
Results for HBase are shown in Figure 7(b). As before, this figure represents just one slice of the total experiment. As the figure shows, the read latency spikes initially after the sixth server is added, before the latency stabilizes at a value slightly lower than the latency for five servers. This re-sult indicates that HBase is able to shift read and write load to the new server, resulting in lower latency. HBase does not move existing data to the new server until compactions occur2. The result is less latency variance compared to Cas-sandra since there is no repartitioning process competing for the disk. However, the new server is underutilized, since existing data is served off the old servers.
A similar slice of the timeseries (adding a sixth server at time=10 minutes) is shown for PNUTS in Figure 7(c). PNUTS also moves data to the new server, resulting in higher latency after the sixth server is added, as well as latency variability. However, PNUTS is able to stabilize more quickly, as its repartitioning scheme is more optimized. After stabilizing at time=80 minutes, the read latency is comparable to a cluster that had started with six servers, indicating that PNUTS provides good elastic speedup.
7.
FUTURE WORK
In addition to performance comparisons, it is important to examine other aspects of cloud serving systems. In this section, we propose two more benchmark tiers which we are developing in ongoing work.
7.1
Tier 3—Availability
A cloud database must be highly available despite failures, and the Availability tier measures the impact of failures on the system. The simplest way to measure availability is to start a workload, kill a server while the workload is running, and observe any resulting errors and performance impact. However, in a real deployed system, a variety of failures can occur at various other levels, including the disk, the network,
2It is possible to run the HDFS load balancer to force data
to the new servers, but this greatly disrupts HBase’s ability to serve data partitions from the same servers on which they are stored.
0 100 200 300 400 500 600 700 800 0 50 100 150 200 250 300 350 Read latency (ms)
Duration of test (min) Cassandra 0 50 100 150 200 250 0 5 10 15 20 25 Read latency (ms)
Duration of test (min) HBase 0 20 40 60 80 100 120 0 20 40 60 80 100 120 Read latency (ms)
Duration of test (min) PNUTS
(a) Cassandra (b) HBase (c) PNUTS
Figure 7: Elastic speedup: Time series showing impact of adding servers online.
and the whole datacenter. These failure may be the result of hardware failure (for example, a faulty network interface card), power outage, software faults, and so on. A proper availability benchmark would cause (or simulate) a variety of different faults and examine their impact.
At least two difficulties arise when benchmarking avail-ability. First, injecting faults is not straightforward. While it is easy to ssh to a server and kill the database process, it is more difficult to cause a network fault for example. One approach is to allow each database request to carry a special fault flag that causes the system to simulate a fault. This approach is particularly amenable to benchmarking be-cause the workload generator can add the appropriate flag for different tests to measure the impact of different faults. A “fault-injection” header can be inserted into PNUTS re-quests, but to our knowledge, a similar mechanism is not currently available in the other systems we benchmarked. An alternate approach to fault injection that works well at the network layer is to use a system like ModelNet [34] or Emulab [33] to simulate the network layer, and insert the appropriate faults.
The second difficulty is that different systems have dif-ferent components, and therefore different, unique failure modes. Thus, it is difficult to design failure scenarios that cover all systems.
Despite these difficulties, evaluating the availability of sys-tems is important and we are continuing to work on devel-oping benchmarking approaches.
7.2
Tier 4—Replication
Cloud systems use replication for both availability and performance. Replicas can be used for failover, and to spread out read load. Some systems are also designed to split write requests across replicas to improve performance, although a consistency mechanism (such as eventual consistency in Cassandra, or timeline consistency in PNUTS) is needed to avoid corruption due to write-write conflicts.
Replication may be synchronous or asynchronous. HBase, for example, writes synchronously to multiple replicas, while PNUTS performs replication asynchronously. Thus, the fol-lowing measures are important when evaluating replication:
• Performance cost or benefit—what is the impact to performance as we increase the replication factor on a constant amount of hardware? The extra work to main-tain replicas may hurt performance, but the extra
repli-cas can potentially be used to spread out load, improving performance.
• Availability cost or benefit—what is the impact to availability as we increase the replication factor on a con-stant amount of hardware? In some systems, the read availability may increase but the write availability may decrease if all replicas must be live to commit an update.
• Freshness—are replicas consistent, or are some replicas stale? How much of the data is stale and how stale is it? This is primarily an issue for systems that use asyn-chronous replication.
• Wide area performance—how does replication per-form between datacenters in geographically separate lo-cations? Some replication schemes are optimized to be used within the datacenter or between nearby datacen-ters, while others work well in globally distributed data-centers.
8.
RELATED WORK
Benchmarking
Benchmarking is widely used for evaluating computer sys-tems, and benchmarks exist for a variety of levels of ab-straction, from the CPU, to the database software, to com-plete enterprise systems. Our work is most closely related to database benchmarks. Gray surveyed popular database benchmarks, such as the TPC benchmarks and the Wiscon-sin benchmark, in [22]. He also identified four criteria for a successful benchmark: relevance to an application domain,
portabilityto allow benchmarking of different systems, scala-bilityto support benchmarking large systems, andsimplicity
so the results are understandable. We have aimed to satisfy these criteria by developing a benchmark that is relevant to serving systems, portable to different backends through our extensibility framework, scalable to realistic data sizes, and employing simple transaction types.
Despite the existence of database benchmarks, we felt it was necessary to define a new benchmark for cloud serving systems. First, most cloud systems do not have a SQL in-terface, and support only a subset of relational operations (usually, just the CRUD operations), so that the complex queries of many existing benchmarks were not applicable. Second, the use cases of cloud systems are often different than traditional database applications, so that narrow do-main benchmarks (such as the debit/credit style benchmarks
like TPC-A or E-commerce benchmarks like TPC-W) may not match the intended usage of the system. Furthermore, our goal was to develop a benchmarking framework that could be used to explore the performance space of different systems, rather than to measure a single performance num-ber representing a particular application. It is for similar reasons that new benchmarks have been developed for other non-traditional database systems (such as XMark for XML systems [28] and Linear Road for stream systems [14]).
Designing an accurate and fair benchmark, and using it to gather accurate results, is non-trivial. Seltzer et al [30] argue that many micro and macrobenchmarks do not effec-tively model real workloads. One approach they propose (thevector approach) is to measure the performance of sys-tem operations, and compute the expected performance for a particular application that uses some specified combination of those operations. Our approach is similar to this, except that we directly measure the performance of a particular combination of operations; this allows us to accurately mea-sure the impact of things like disk or cache contention when the operations are used together. Shivam et al [31] describe a workbench tool for efficiently running multiple benchmark tests to achieve high confidence results. Their tool inter-faces with a workload generator, like the YCSB Client, to execute each run. We are examining the possibility of using their workbench to run our benchmark.
Cloud systems
The term “cloud” has been used for a variety of different kinds of systems and architectures. A special issue of the Data Engineering Bulletin [25] showcased several aspects of data management in the cloud. We have focused on serving systems like PNUTS, Cassandra, and others. In contrast,
batch systems provide near-line or offline analysis, but are not appropriate for online serving. Pavlo et al [26] have benchmarked cloud systems like Hadoop against more tra-ditional relational systems and relational column stores like Vertica/C-Store [32]. Some batch systems might use the same database systems that would be used in a serving envi-ronment. For example, HBase can be used both as a serving store and as a storage backend for Hadoop, and is reportedly used this way at StumbleUpon, one of the major developers of HBase [27].
9.
CONCLUSIONS
We have presented the Yahoo! Cloud Serving Benchmark. This benchmark is designed to provide tools for apples-to-apples comparison of different serving data stores. One con-tribution of the benchmark is an extensible workload gener-ator, the YCSB Client, which can be used to load datasets and execute workloads across a variety of data serving sys-tems. Another contribution is the definition of five core workloads, which begin to fill out the space of performance tradeoffs made by these systems. New workloads can be easily created, including generalized workloads to examine system fundamentals, as well as more domain-specific work-loads to model particular applications. As an open-source package, the YCSB Client is available for developers to use and extend in order to effectively evaluate cloud systems. We have used this tool to benchmark the performance of four cloud serving systems, and observed that there are clear tradeoffs between read and write performance that result from each system’s architectural decisions. These results
highlight the importance of a standard framework for exam-ining system performance so that developers can select the most appropriate system for their needs.
10.
ACKNOWLEDGEMENTS
We would like to thank the system developers who helped us tune the various systems: Jonathan Ellis from Cassan-dra, Ryan Rawson and Michael Stack from HBase, and the Sherpa Engineering Team in Yahoo! Cloud Computing.
11.
REFERENCES
[1] Amazon SimpleDB. http://aws.amazon.com/simpledb/. [2] Apache Cassandra. http://incubator.apache.org/cassandra/. [3] Apache CouchDB. http://couchdb.apache.org/.
[4] Apache HBase. http://hadoop.apache.org/hbase/. [5] Dynomite Framework.
http://wiki.github.com/cliffmoon/-dynomite/dynomite-framework.
[6] Google App Engine. http://appengine.google.com. [7] Hypertable. http://www.hypertable.org/. [8] mongodb. http://www.mongodb.org/.
[9] Project Voldemort. http://project-voldemort.com/. [10] Solaris FileBench.
http://www.solarisinternals.com/wiki/index.php/FileBench. [11] SQL Data Services/Azure Services Platform.
http://www.microsoft.com/azure/data.mspx. [12] Storage Performance Council.
http://www.storageperformance.org/home.
[13] Yahoo! Query Language. http://developer.yahoo.com/yql/. [14] A. Arasu et al. Linear Road: a stream data management
benchmark. InVLDB, 2004.
[15] F. C. Botelho, D. Belazzougui, and M. Dietzfelbinger.
Compress, hash and displace. InProc. of the 17th European
Symposium on Algorithms, 2009.
[16] F. Chang et al. Bigtable: A distributed storage system for
structured data. InOSDI, 2006.
[17] B. F. Cooper et al. PNUTS: Yahoo!’s hosted data serving
platform. InVLDB, 2008.
[18] G. DeCandia et al. Dynamo: Amazon’s highly available
key-value store. InSOSP, 2007.
[19] D. J. DeWitt. The Wisconsin Benchmark: Past, present and
future. In J. Gray, editor,The Benchmark Handbook. Morgan
Kaufmann, 1993.
[20] I. Eure. Looking to the future with Cassandra. http://blog.digg.com/?p=966.
[21] S. Gilbert and N. Lynch. Brewer’s conjecture and the feasibility of consistent, available, partition-tolerant web
services.ACM SIGACT News, 33(2):51–59, 2002.
[22] J. Gray, editor.The Benchmark Handbook For Database and
Transaction Processing Systems. Morgan Kaufmann, 1993. [23] J. Gray et al. Quickly generating billion-record synthetic
databases. InSIGMOD, 1994.
[24] A. Lakshman, P. Malik, and K. Ranganathan. Cassandra: A
structured storage system on a P2P network. InSIGMOD,
2008.
[25] B. C. Ooi and S. Parthasarathy. Special issue on data
management on cloud computing platforms.IEEE Data
Engineering Bulletin, vol. 32, 2009.
[26] A. Pavlo et al. A comparison of approaches to large-scale data
analysis. InSIGMOD, 2009.
[27] R. Rawson. HBase intro. InNoSQL Oakland, 2009.
[28] A. Schmidt et al. Xmark: A benchmark for XML data
management. InVLDB, 2002.
[29] R. Sears, M. Callaghan, and E. Brewer. Rose: Compressed,
log-structured replication. InVLDB, 2008.
[30] M. Seltzer, D. Krinsky, K. A. Smith, and X. Zhang. The case
for application-specific benchmarking. InProc. HotOS, 1999.
[31] P. Shivam et al. Cutting corners: Workbench automation for
server benchmarking. InProc. USENIX Annual Technical
Conference, 2008.
[32] M. Stonebraker et al. C-store: a column-oriented DBMS. In
VLDB, 2005.
[33] B. White et al. An integrated experimental environment for
distributed systems and networks. InOSDI, 2002.
[34] K. Yocum et al. Scalability and accuracy in a large-scale