Does happiness itself directly aff ect mortality? The prospective
UK Million Women Study
Bette Liu, Sarah Floud, Kirstin Pirie, Jane Green, Richard Peto, Valerie Beral, for the Million Women Study Collaborators
Summary
Background Poor health can cause unhappiness and poor health increases mortality. Previous reports of reduced
mortality associated with happiness could be due to the increased mortality of people who are unhappy because of their poor health. Also, unhappiness might be associated with lifestyle factors that can aff ect mortality. We aimed to establish whether, after allowing for the poor health and lifestyle of people who are unhappy, any robust evidence remains that happiness or related subjective measures of wellbeing directly reduce mortality.
Methods The Million Women Study is a prospective study of UK women recruited between 1996 and 2001 and
followed electronically for cause-specifi c mortality. 3 years after recruitment, the baseline questionnaire for the present report asked women to self-rate their health, happiness, stress, feelings of control, and whether they felt relaxed. The main analyses were of mortality before Jan 1, 2012, from all causes, from ischaemic heart disease, and from cancer in women who did not have heart disease, stroke, chronic obstructive lung disease, or cancer at the time they answered this baseline questionnaire. We used Cox regression, adjusted for baseline self-rated health and lifestyle factors, to calculate mortality rate ratios (RRs) comparing mortality in women who reported being unhappy (ie, happy sometimes, rarely, or never) with those who reported being happy most of the time.
Findings Of 719 671 women in the main analyses (median age 59 years [IQR 55–63]), 39% (282 619) reported being
happy most of the time, 44% (315 874) usually happy, and 17% (121 178) unhappy. During 10 years (SD 2) follow-up, 4% (31 531) of participants died. Self-rated poor health at baseline was strongly associated with unhappiness. But after adjustment for self-rated health, treatment for hypertension, diabetes, asthma, arthritis, depression, or anxiety, and several sociodemographic and lifestyle factors (including smoking, deprivation, and body-mass index), unhappiness was not associated with mortality from all causes (adjusted RR for unhappy vs happy most of the time 0·98, 95% CI 0·94–1·01), from ischaemic heart disease (0·97, 0·87–1·10), or from cancer (0·98, 0·93–1·02). Findings were similarly null for related measures such as stress or lack of control.
Interpretation In middle-aged women, poor health can cause unhappiness. After allowing for this association and
adjusting for potential confounders, happiness and related measures of wellbeing do not appear to have any direct eff ect on mortality.
Funding UK Medical Research Council, Cancer Research UK.
Copyright © Liu et al. Open Access article distributed under the terms of CC BY.
Introduction
Happiness and related measures of wellbeing are reportedly associated with reduced mortality, particularly from heart disease.1–4 Postulated mechanisms to account for this association include the possibility that happiness might itself cause biological changes, such as in serum cortisol concentration or immune function, that could in turn aff ect mortality.2,3 However, serious challenges exist in interpreting the association between happiness and reduced mortality as evidence for a protective biological mechanism for happiness. Unhappiness might, for example, be associated with lifestyle factors that can cause disease,3 such as smoking, high alcohol con sumption, obesity, or physical inactivity. Perhaps more important is reverse causality whereby poor health, which is known to be associated with an increase in mortality, can also cause unhappiness. This results in a non-causal association between unhappiness and
increased mortality—or, equivalently, between happiness and reduced mortality. Our aim was to establish whether, after appropriate allowance for reverse causality and for confounding by lifestyle and sociodemographic factors, any robust evidence remains that happiness itself, or related subjective measures of wellbeing such as being in control, relaxed, or not unduly stressed, are independently associated with reduced mortality.
Methods
Study design and participants
From May 1, 1996, to Dec 31, 2001, the Million Women Study recruited 1·3 million women aged 50–69 years through the national Breast Screening Programmes of England and Scotland, and has continued to follow them up by electronic record linkage, recording the causes of any deaths.5 At recruitment, and every 3–5 years
Published Online December 9, 2015 http://dx.doi.org/10.1016/ S0140-6736(15)01087-9 SeeOnline/Comment http://dx.doi.org/10.1016/ S0140-6736(15)01222-2
Faculty of Medicine, University of New South Wales, Sydney, NSW, Australia (B Liu DPhil); Cancer Epidemiology Unit
(S Floud PhD, K Pirie MSc, Prof J Green DPhil, Prof V Beral FRS) and Clinical Trial Service Unit and Epidemiological Studies Unit
(Prof R Peto FRS), Nuffi eld Department of Population Health, University of Oxford, Oxford, UK
Correspondence to:
Bette Liu, School of Public Health and Community Medicine, Faculty of Medicine, University of New South Wales, Sydney, NSW 2052, Australia
bette.liu@unsw.edu.au
For more on the Million Women Study see http://www. millionwomenstudy.org
subsequently, women were posted a questionnaire asking about sociodemographic factors, lifestyle, and health.
Ethics approval was from the Anglia and Oxford multicentre research ethics committee. Access to hospital admission data was approved by the Information Centre for Health and Social Care (England) and the Information Services Division (Scotland). All study participants provided written consent.
Procedures
At baseline 3 years after recruitment, women were asked: “How often do you feel happy?” Possible responses were “most of the time”, “usually”, “sometimes”, or “rarely/ never”. They were also asked about related subjective measures of wellbeing including how often they felt in control, relaxed, and stressed. In addition, women were asked whether they had had various common health disorders and to self-rate their current health as “excellent”, “good”, “fair”, or “poor”. In the questionnaire, self-rated health came before happiness and related measures. We used data from this 3 year survey as baseline for our investigation of any associations of unhappiness (or related factors) with cause-specifi c mortality, and our analyses are restricted to the women who answered this question on happiness. A random sample of women were re-sent the same questionnaire about 1 year after the fi rst one to assess the repeatability of responses.6
All participants in the Million Women Study are routinely followed for death (or emigration), cancer registration, and hospital admission through electronic linkage to centrally held National Health Service (NHS) records, using a combination of name, date of birth, and NHS number. Underlying causes of death, cancers, and hospital admissions are coded according to WHO Tenth International Classifi cation of Diseases (ICD-10). Follow-up time was from the date when the baseline questionnaire on happiness was answered to whichever was fi rst of Jan 1, 2012, or date of death or emigration.
Outcomes and exposures
Our outcomes were mortality from all causes, from ischaemic heart disease (ICD-10 I20-I25), and from cancer (ICD-10 C00-C97). We classifi ed women into three categories: unhappy (ie, sometimes, rarely, or never happy), usually happy, or happy most of the time. Because the latter two categories are similar, for some analyses we combined them into one category, called generally happy. Associations of mortality with other subjective measures of wellbeing (being in control, relaxed, and stressed) were also examined.
Statistical analysis
For analyses examining which baseline factors were associated with happiness we used logistic regression (adjusted for various factors) to compare individuals who were unhappy with those who were generally happy (two-way classifi cation). For the analyses of the association
Figure1: Correlates of being generally happy—relevance of personal and lifestyle characteristics at baseline Analysis for whole population (N=845 440), including women later excluded for life-threatening health disorders. *ORs are adjusted for age, region, area deprivation, body-mass index, qualifi cations, strenuous exercise, smoking, alcohol, living with a partner, parity, participation in group activities, and sleep duration.
OR=odds ratio. g-s CI=group-specifi c confi dence interval.
0 0·5 1·0 1·5 2·0 Less likely to feel happy More likely to feel happy
OR* (99% g-s CI) Age (years) <55 55–59 ≥60 Region of residence South England Midlands North England Scotland Deprivation tertile Least deprived Middle tertile Most deprived Highest qualification College or university A-level O-level None of the above
Body-mass index (kg/m2) <25 (desirable) 25–29·9 (overweight) ≥30 (obese) Strenuous exercise None <3 h per week ≥3 h per week Smoking Never Past Current Alcohol None <7 drinks per week ≥7 drinks per week
Living with a partner and parity
No partner and nulliparous No partner and parous Partner and nulliparous Partner and parous
Participation in group activities
None Religious group Other group activities
Sleep duration <7 h 7 h 8 h ≥9 h 125 679/31 580 238 910/54 281 334 475/60 515 333 397/66 946 143 755/32 044 169 162/38 039 52 750/9347 237 815/44 104 234 121/46 382 221 743/54 909 106 633/24 543 31 410/7249 141 657/28 527 405 666/82 791 295 807/60 446 245 422/48 115 106 931/25 306 273 482/63 956 124 399/23 426 100 783/17 229 376 956/70 874 228 861/48 928 76 571/22 473 223 514/53 002 223 909/42 221 165 415/31 345 27 471/8279 95 478/30 710 49 053/9296 516 069/94 645 238 665/61 539 130 757/21 077 329 642/63 760 146 638/48 292 236 108/44 431 240 291/37 015 70 076/14 731 Generally happy/unhappy (n/n) 1·000 (0·983–1·017) 1·103 (1·089–1·116) 1·398 (1·381–1·416) 1·000 (0·988–1·012) 0·920 (0·905–0·935) 0·934 (0·920–0·949) 1·150 (1·116–1·185) 1·000 (0·986–1·014) 0·977 (0·964–0·990) 0·886 (0·875–0·898) 1·000 (0·981–1·019) 1·056 (1·021–1·093) 1·258 (1·237–1·280) 1·387 (1·370–1·403) 1·000 (0·988–1·012) 1·046 (1·032–1·059) 0·947 (0·929–0·965) 1·000 (0·987–1·013) 1·123 (1·103–1·145) 1·297 (1·269–1·325) 1·000 (0·989–1·011) 0·911 (0·899–0·922) 0·763 (0·747–0·779) 1·000 (0·986–1·014) 1·182 (1·166–1·198) 1·231 (1·211–1·252) 1·000 (0·967–1·034) 0·965 (0·948–0·982) 1·552 (1·507–1·599) 1·596 (1·581–1·612) 1·000 (0·987–1·013) 1·488 (1·459–1·518) 1·233 (1·219–1·247) 0·597 (0·589–0·605) 1·000 (0·987–1·014) 1·196 (1·179–1·213) 0·893 (0·872–0·915)
between unhappiness and mortality we used the three-way classifi cation (with those happy most of the time as the reference group), but for clarity in the text, we report only the mortality rate ratios (RR) for unhappy versus happy most of the time. For analyses of all-cause mortality, ischaemic heart disease mortality, and cancer mortality, we used Cox proportional hazards models. We did sensitivity analyses to exclude the fi rst 5 years of follow-up. We repeated such analyses for related measures of subjective wellbeing: being in control, being relaxed, and being stressed.
To limit reverse causality, the main mortality analyses excluded women who had already had certain illnesses (heart disease, stroke, lung disease, or cancer, as done previously7); additional analyses assessed the eff ects of these exclusions.
RRs of death were fi rst adjusted only for age, and then additionally adjusted for various combinations of self-rated health and sociodemographic and lifestyle characteristics. These characteristics were region of residence at recruitment (Scotland and the nine cancer registration regions covering England at that time); area deprivation (quintiles, based on the Townsend Index, a score incorporating census area data for employment, car ownership, home ownership, and household overcrowding8); educational achievement (college [after age 18 years], A-level qualifi cations [usually at age 18 years], O-level qualifi cations [usually at age 16 years], none of these); whether living with a partner (yes, no), parity (0, 1, ≥2), body-mass index (<25 kg/m², 25 to <30 kg/m², ≥30 kg/m²); strenuous exercise (0, <3 h
per week, ≥3 h per week); smoking (never, past, current <15 cigarettes per day, current ≥15 cigarettes per day); alcohol consumption (0, <7 drinks per week, ≥7 drinks per week); hours of sleep (<7 h, 7 h, 8 h, ≥9 h); and participation in religious groups (yes, no) or other group activities (yes, no). All adjustment variables were from the baseline survey (ie, at the same time that happiness and related measures were recorded), except region, deprivation, education, and parity, which were recorded at recruitment, about 3 years earlier.
We used conventional 95% CIs or 99% CIs, except in fi gures that compared more than two groups. For these comparisons, the variance of the log risk was estimated for each group (including the reference group).9 We used these group-specifi c variances to calculate group-specifi c CIs, allowing valid comparisons between any two or more groups, whether or not one of them was designated as the reference group. Analyses were done with STATA version 13.1.
Role of the funding source
The funders of the study had no role in study design, data collection, data analysis, data interpretation, or writing of the report. The corresponding author had full access to all the data in the study and had fi nal responsibility for the decision to submit for publication.
Results
At baseline, a total of 845 440 women (median age 59 years; IQR 55–63) responded to the question about how often they felt happy. Replies were: 39% (329 326 women) happy
Figure 2: Correlates of being generally happy—relevance of various indices of health at baseline
Analysis for whole population (N=845 440), including women later excluded for life-threatening health disorders. ORs are adjusted for age, region, area deprivation, body-mass index, qualifi cations, strenuous exercise, smoking, alcohol, living with a partner, parity, participation in group activities, and sleep duration. OR=odds ratio.
Serious illness at baseline
Cancer Heart disease Stroke Chronic obstructive lung disease
Current treatment at baseline
High blood pressure Diabetes Asthma Arthritis Depression or anxiety
Self-rated health at baseline
Fair or poor With illness 44 481/9579 49 035/13 329 11 703/3501 4924/1902 Treated 153 825/34 249 22 070/5854 49 919/13 104 79 848/22 729 29 285/25 628 Fair or poor 125 393/62 859 Without illness 654 583/136 797 650 029/133 047 687 361/142 875 694 140/144 474 Not treated 545 239/112 127 676 994/140 522 649 145/133 272 619 216/123 647 669 779/120 748 Excellent or good 541 004/76 505 0 0·5 1·0 Less likely to feel happy More likely to feel happy
Generally happy/unhappy (n/n) OR (99% CI)
0·953 (0·924–0·982) 0·784 (0·763–0·806) 0·748 (0·710–0·787) 0·668 (0·621–0·718) 0·928 (0·911–0·945) 0·863 (0·829–0·898) 0·848 (0·825–0·871) 0·763 (0·747–0·780) 0·224 (0·218–0·229) 0·298 (0·293–0·303)
most of the time, 44% (369 738) usually happy, 16% (138 678) sometimes happy, and 1% (7698) rarely or never happy. In all analyses we combined women who reported being happy sometimes, rarely, or never, and describe them as unhappy.
Among 10 143 women who completed the same
happiness question twice, about 1 year apart, there was reasonably good reproducibility between the categorised responses (weighted κ for agreement 0·62). The two extreme categories had little crossover. Of 4003 women who reported being happy most of the time at baseline, only 2% (85) reported being unhappy 1 year later; conversely, of 1763 women who reported being unhappy at baseline, only 5% (81) reported being happy most of the time 1 year later.
The strongest sociodemographic and lifestyle correlates of being generally happy were increasing age, having fewer educational qualifi cations, doing strenuous exercise, not smoking, living with a partner, and participating in religious and other group activities (fi gure 1). The relation between happiness and the number of hours of sleep was J-shaped, with women reporting about 8 h sleep most likely to be generally happy. Each of the indices of ill health at baseline was
associated with unhappiness (fi gure 2). Of all factors shown in fi gure 1 or fi gure 2, the strongest associations with reported unhappiness were treatment for depression or anxiety and reporting only fair or poor general health (fi gure 2).
Women were followed for a mean of 9·6 years (SD 1·9) after completing the questionnaire about happiness. Including women with and without illness at baseline, 48 314 deaths were recorded in this time. Compared with those reporting being happy most of the time, women who had reported being unhappy had excess all-cause mortality when adjusted only for age (RR 1·36, 95% CI 1·33–1·40). Simultaneous adjustment for the sociodemographic and lifestyle factors in fi gure 1 and the indices of health in fi gure 2 completely eliminated this excess (fully adjusted RR 0·95, 0·93–0·98; appendix p 4). However, these analyses include women who already had life-threatening diseases at baseline. Hence, our subsequent analyses exclude the 125 769 women who at baseline already had heart disease, stroke, cancer, or chronic obstructive airways disease. These excluded women had three times the death rate of the women without any such illnesses (age-adjusted RR 2·91, 95% CI 2·85–2·96), and are omitted from the main analyses below.
Unhappy* Usually happy Happy most of the time
All women
Number of women 121 178 315 874 282 619
Number of deaths 6052 13 720 11 759
RR (95% CI) of all-cause mortality, adjusted for:
Age only 1·29 (1·25–1·33) 1·05 (1·03–1·08) Ref
Age and personal characteristics† 1·14 (1·11–1·18) 1·04 (1·02–1·07) Ref
Age and self-rated health‡ 1·02 (0·98–1·05) 0·97 (0·95–1·00) Ref
Age, characteristics†, and self-rated health‡ 0·97 (0·94–1·00) 0·98 (0·96–1·01) Ref Age, characteristics†, self-rated health‡, and treatment for common
health disorders§
0·98 (0·94–1·01) 0·99 (0·96–1·01) Ref In women reporting poor or fair health at baseline
Number of women 46 547 56 447 31 733
Number of deaths 3193 4049 2364
RR (95% CI) of all-cause mortality, adjusted for:
Age only 0·99 (0·94–1·04) 0·97 (0·92–1·02) Ref
Age, characteristics†, and treatment for common health disorders§ 0·93 (0·88–0·99) 0·97 (0·93–1·03) Ref In women reporting good or excellent health at baseline
Number of women 68 762 244 488 237 487
Number of deaths 2509 8852 8712
RR (95% CI) of all-cause mortality, adjusted for:
Age only 1·06 (1·02–1·11) 1·00 (0·97–1·03) Ref
Age, characteristics†, and treatment for common health disorder§ 1·01 (0·97–1·06) 1·00 (0·97–1·03) Ref
Analyses are limited to the 719 671 women without cancer, heart disease, stroke, or chronic obstructive airways disease at baseline. *Happy only sometimes, rarely, or never. †Region of residence, area deprivation, educational qualifi cations, body-mass index, strenuous exercise, smoking, alcohol consumption, living with a partner, parity, participation in religious or other group activities, and sleep duration (appendix p 5 gives analyses adjusted for each of these separately). ‡Self-rated health at baseline, in three categories: poor or fair, good, and excellent (the numbers for all women include the few who did not answer the question on self-rated health at baseline). §Treatment at baseline for high blood pressure, diabetes, asthma, arthritis, depression or anxiety (appendix p 5 gives the corresponding result adjusted only for treatment for depression or anxiety). RR=rate ratio. Ref=reference group.
Table: Eff ects of adjustment for personal characteristics and various indices of health on the association between all-cause mortality and how often women reported being happy
Of the remaining 719 671 women (median age 59 years, IQR 55–63), 4% (31 531) died during follow-up. In response to the question at baseline about how often they felt happy, 39% (282 619) reported being happy most of the time, 44% (315 874) usually happy, and 17% (121 178) unhappy. In crude analyses adjusted only for age, unhappiness remained associated with increased mortality (RR 1·29, 95% CI 1·25–1·33; table). This excess risk was partly accounted for by associations with various personal characteristics (appendix p 5). Self-rated health was, however, the key characteristic. Poor health at baseline was strongly associated with unhappiness at baseline (fi gure 2) and once we adjusted for self-rated health, unhappiness was no longer signifi cantly associated with all-cause mortality (RR 1·02, 0·98–1·05; table). After simultaneous adjustment for all socio demographic and lifestyle factors in fi gure 1 (personal characteristics) and all indices of health in fi gure 2, the association vanished (fully adjusted RR 0·98, 0·94–1·01, for all-cause mortality [table]; 0·97, 0·87–1·10, for ischaemic heart disease mortality; and 0·98, 0·93–1·02, for cancer mortality [appendix pp 8–9]).
Further details of this multivariate adjustment are available (appendix p 5), showing that after adjusting for age, additional adjustment for each single personal characteristic in fi gure 1 changed the RR estimate only slightly (adjustment for smoking had the greatest eff ect). Simultaneous adjustment for all personal characteristics, however, halved the association between unhappiness and mortality (RR 1·14, 95% CI 1·11–1·18). Adjustment just for being treated for common health disorders (hypertension, diabetes, asthma, arthritis, depression, or anxiety), particularly depression or anxiety, also weakened the relationship (RR 1·21, 1·17–1·25; appendix p 5). The main fi ndings were essentially unchanged in sensitivity analysis that ignored the fi rst 5 years of follow-up (appendix p 6).
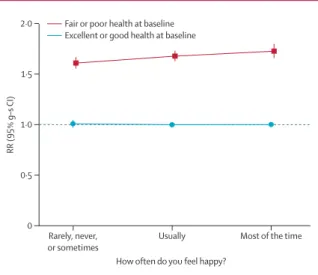
Because self-rated health was so strongly associated with both happiness and mortality, we examined the associations between happiness and mortality in women separately by self-rated health (table, fi gure 3, appendix pp 7–9, pp 13–15). All-cause mortality was substantially greater for the 20% (134 727 of 685 464) of women who reported that their health was fair or poor than for the remaining 80% (550 737) of women who reported good or excellent health (RR 1·67, 95% CI 1·63–1·71). Within each category of self-rated health there was no signifi cant excess mortality in individuals who reported being unhappy (table, fi gure 3). For women who reported only fair or poor health, mortality was actually lower in those who reported being unhappy compared with those who were happy most of the time, but these fi ndings might be biased by some unhappy women tending to rate their general health worse than it was, thus producing a spuriously low mortality associated with being unhappy. Women reporting being
in good or excellent health are less liable to such a potential bias, and we give results for these women only in fi gure 4 and fi gure 5, with results for women reporting fair or poor health in the appendix.
Among 550 737 women reporting good or excellent health, 1253 died from ischaemic heart disease and 12 943 from cancer; among these women, unhappiness was
Figure 3: RR of all-cause mortality by self-rated health and happiness Includes 719 671 women (31 531 deaths). Excludes women with cancer, heart disease, stroke, or chronic obstructive airways disease at baseline. RRs are adjusted for age, region, area deprivation, body-mass index, qualifi cations, strenuous exercise, smoking, alcohol, living with a partner, parity, participation in group activities, and sleep duration. Women who reported being in good or excellent health and happy most of the time are the reference group (RR=1·0). RR=rate ratio. g-s CI=group-specifi c confi dence interval.
Figure 4: Risk of ischaemic heart disease mortality and cancer mortality by happiness in women who rated their health as good or excellent at baseline Includes 550 737 women (1253 ischaemic heart disease deaths, 12 943 cancer deaths). Excludes women with cancer, heart disease, stroke, or chronic obstructive airways disease at baseline, and women who rated their health as poor or fair at baseline. RRs are adjusted for age, region, area deprivation, body-mass index, qualifi cations, strenuous exercise, smoking, alcohol, living with a partner, parity, participation in group activities, and sleep duration. Women who reported being happy most of the time are the reference group (RR=1·0). RR=rate ratio. g-s CI=group-specifi c confi dence interval.
Rarely, never, or sometimes
Usually Most of the time 0 0·5 1·0 1·5 2·0 RR (95% g–s CI)
How often do you feel happy? Fair or poor health at baseline
Excellent or good health at baseline
Rarely, never, or sometimes
Usually Most of the time 0 0·5 1·0 1·5 RR (95% g–s CI)
How often do you feel happy? Cancer
not associated with mortality from either cause (fi gure 4). Nor was unhappiness associated with mortality from these causes for women who reported being in poor or fair health (appendix pp 8–9, pp 14–15).
Being treated for depression or anxiety was also strongly associated with self-reported unhappiness, so we did analyses separately for women who were and were not being treated for depression or anxiety at baseline (appendix pp 16–17). Again, unhappiness did not seem to be related to mortality in any of the subgroups of self-rated health.
We examined the associations of mortality with three other related subjective measures of wellbeing (being in control, relaxed, or not stressed). Correlates of each measure with sociodemographic, lifestyle, and health indices at baseline were similar to those found
for happiness (appendix pp 18–19), even though the diff erent measures were themselves not strongly correlated (appendix p 10). Among women reporting good or excellent health, not being in control, not being relaxed, and being stressed were all not associated with increased mortality (fi gure 5; appendix pp 11–12).
Discussion
Poor health can cause unhappiness and poor health increases mortality, so unhappiness is associated with increased mortality. Additionally, unhappiness might correlate with some adverse lifestyle choices. After allowance for these associations our large prospective study shows no robust evidence that happiness itself reduces cardiac, cancer, or overall mortality.
There is no perfect or generally agreed way to measure happiness or related subjective indices of wellbeing. Diff erent approaches thus limit comparability between studies. We used a single question about happiness with a four-point scale, whereas other investigators have used diff erent measures.10–14 Nevertheless, we are able to show the validity of our measure in three ways. First, personal factors found to be associated with happiness in this study (fi gure 1, fi gure 2) were similar to those reported by others who used either single-item or multi-item measures of happiness—ie, women were more likely to report feeling happy if they were older,15–17 less deprived,13,15,16,18 physically active,11,13,19–21 did not smoke,312,20–22 had a partner,17,18,23 belonged to a religious group or participated in social activities,17,18 and had adequate sleep3,21 (but not too much). Women were also less likely to be happy if they had poor self-rated health or were being treated for various common health disorders, particularly depression or anxiety.16–18,21,24 Second, in analyses that were adjusted only for age and not corrected for other factors, our measure of unhappiness was correlated with increased mortality. Third, the response to our single question on happiness was reasonably repeatable on resurvey 1 year later (weighted κ=0·62), a level of repeatability comparable with that reported by other researchers using both single-item and multiple-item measures.3,13,25 Also, there was minimal cross-over in responses 1 year apart between the two extremes of happy most of the time or unhappy.
Crude analyses, adjusting only for age, showed some excess mortality to be associated with unhappiness, but this excess was completely eliminated after additional adjustment for personal characteristics and for poor health at baseline (table). This was true for all-cause mortality and, separately, for mortality from ischaemic heart disease and from cancer. Far fewer women died from heart disease than from cancer and confounding was greater, so our null fi ndings are less defi nite for heart disease than for cancer.
By far the most important adjustment factor was self-rated health. A systematic review of previous studies has confi rmed that self-rated health predicts an increased
0 0·5 1·0 1·5 A RR (95% g–s CI)
How often do you feel happy? B How often do you feel in control?
Rarely, never, or sometimes Usually Most of the time 0 0·5 1·0 1·5 C RR (95% g–s CI)
How often do you feel relaxed?
Usually, most of the time Sometimes Rarely or never Rarely, never, or sometimes Usually Most of the time Rarely, never, or sometimes Usually Most of the time
D How often do you feel stressed?
Figure 5: All-cause mortality by happiness and other measures of wellbeing in women who rated their health as good or excellent at baseline
Includes 550 737 women (20 073 deaths). Excluding women with cancer, heart disease, stroke, or chronic obstructive airways disease at baseline and women who rated their health as poor or fair at baseline. RRs are adjusted for age, region, area deprivation, body-mass index, qualifi cations, strenuous exercise, smoking, alcohol, living with a partner, parity, participation in group activities, and sleep duration. The referenced groups (RR=1·0) were women who reported being happy most of the time (A); in control most of the time (B); relaxed most of the time (C); and rarely or never stressed (D). g-s CIs that are not visible are smaller than the solid circle. RR=rate ratio. g-s CI=group-specifi c confi dence interval.
risk of death, in agreement with our fi ndings.26 Self-rated poor health was also strongly associated with unhappiness. Hence we examined the eff ects of happiness in categories of self-rated health, giving most weight to the fi ndings in the many women who reported that they were in good or excellent health. In these women, unhappiness was not associated with an increased mortality. In women who reported that they were in fair or poor health, being unhappy was associated with a slightly lower mortality than being happy most of the time, but this fi nding could well be biased by unhappy women tending to rate their health as slightly worse than it actually was.
Unhappiness might cause some people to do things known to aff ect mortality adversely—eg, smoke or be inactive.2,3 Hence, such variables might be mediators rather than confounders of the unhappiness–mortality association. Furthermore, some lifestyle factors such as inactivity and morbid obesity could cause unhappiness. However, adjustment for most of the behavioural factors, except smoking, resulted in little or no attenuation of the RR estimates for mortality, suggesting that even if these factors were mediating the association, their contribution is small. Adjustment for smoking caused a greater attenuation of the RR estimates than did adjustment for any other personal characteristics, so it is possible that part of the association between unhappiness and mortality, particularly for cancer mortality, might be mediated by smoking.
Some, but not all, other prospective studies have reported that happiness or related subjective measures of wellbeing are associated with lower all-cause
mortality (panel).4,13,14,19,20,22,27–29 However, few of those reports excluded people with life-threatening illnesses at baseline and adjusted for self-rated health (or related measures of ill health) at baseline. Self-rated health was the most important confounding factor in our analyses; where other investigators adjusted for self-rated health, any apparent excess mortality associated with unhappiness was attenuated or disappeared completely.27 If there is inadequate allowance for ill health at baseline, any associations between happiness and lower mortality are likely to be artefactual.
Participants in the Million Women Study were slightly less likely to be from deprived areas than were the general UK population.5 However, at recruitment the cohort included about one in four women in England and Scotland in the eligible age range, indicating that fi ndings should be generally applicable to middle-aged women in the UK. We provide no data about men or women of other ages.
It has been suggested that related subjective measures of wellbeing, including being in control, not being unduly stressed, or having positive or negative attitudes to life, could independently aff ect mortality.4,12,14,30 However, just as for happiness, these associations were wholly accounted for by personal characteristics and ill health at baseline—after adjusting for these factors, any association with mortality was eliminated. We conclude that happiness and unhappiness have no material direct eff ect upon mortality.
Contributors
All authors contributed to study conception, design, analysis, and manuscript writing or revision.
Declaration of interests
We declare no competing interests. Acknowledgments
This study was supported by Cancer Research UK, the British Heart Foundation, and the UK Medical Research Council. BL is supported by a fellowship from the Australian National Health and Medical Research Council. We thank the Million Women Study participants, the National Health Service breast screening centres, and the staff from the Million Women Study coordinating centre.
References
1 Diener E, Chan MY. Happy people live longer: subjective well-being contributes to health and longevity. Appl Psychol 2011; 3: 1–43. 2 Pressman SD, Cohen S. Does positive aff ect infl uence health?
Psychol Bull 2005; 131: 925–71.
3 Boehm JK, Kubzansky LD. The heart’s content: the association between positive psychological well-being and cardiovascular health. Psych Bull 2012; 138: 655–91.
4 Chida Y, Steptoe A. Positive psychological well-being and mortality: a quantitative review of prospective observational studies. Psychosom Med 2008; 70: 741–56.
5 Beral V, Million Women Study Collaborators. Breast cancer and hormone-replacement therapy in the Million Women Study. Lancet 2003; 362: 419–27.
6 Roddam AW, Spencer E, Banks E, et al. Reproducibility of a short semi-quantitative food group questionnaire and its performance in estimating nutrient intake compared with a 7-day diet diary in the Million Women Study. Public Health Nutr 2005; 8: 201–13. 7 Pirie K, Peto R, Reeves GK, Green J, Beral V. The 21st century
hazards of smoking and benefi ts of stopping: a prospective study of one million women in the UK. Lancet 2013; 381: 133–41. Panel: Research in context
Systematic review
In November, 2014, we searched MEDLINE and PubMed for relevant reports with the terms “happiness”, “positive aff ect”, “well-being”, and “mortality” with no language or date restrictions. At least three comprehensive reviews had been done in the previous 6 years on the relation between happiness or related measures and mortality. We therefore did not do a new systematic review. The reviews and individual studies have reported inconsistent fi ndings. Some suggest that happiness or related subjective measures of wellbeing are independently associated with decreased mortality, and some suggest no eff ect after adjustment for potential confounding factors such as poor health.
Interpretation
Some previous reports have confused cause and eff ect. Our fi ndings show that unhappiness is associated with poor health mainly because poor health causes unhappiness and partly because unhappiness is associated with lifestyle factors such as smoking. After adjustment for these factors, no robust evidence remains that unhappiness or stress increase mortality or that being happy, relaxed, or in control reduces mortality.
8 Townsend P, Beattie A, Phillimore P. Health and deprivation: inequality and the North. London: Croom Helm, 1988.
9 Plummer M. Improved estimates of fl oating absolute risk. Stat Med 2004; 23: 93–104.
10 Boehm JK, Peterson C, Kivimaki M, Kubzansky L. A prospective study of positive psychological well-being and coronary heart disease. Health Psych 2011; 30: 259–67.
11 Boehm JK, Peterson C, Kivimaki M, Kubzansky LD. Heart health when life is satisfying: evidence from the Whitehall II cohort study. Eur Heart J 2011; 32: 2672–77.
12 Davidson KW, Mostofsky E, Whang W. Don’t worry, be happy: positive aff ect and reduced 10-year incident coronary heart disease: The Canadian Nova Scotia Health Survey. Eur Heart J 2010; 31: 1065–70.
13 Nabi H, Kivimaki M, De Vogli R, Marmot MG, Singh-Manoux A. Positive and negative aff ect and risk of coronary heart disease: Whitehall II prospective cohort study. BMJ 2008; 337: a118. 14 Xu J, Roberts RE. The power of positive emotions: it’s a matter of
life or death–subjective well-being and longevity over 28 years in a general population. Health Psychol 2010; 29: 9–19.
15 Blanchfl ower DG, Oswald AJ. Well-being over time in Britain and the USA. J Public Econ 2004; 88: 1359–86.
16 Bryson A, Green F, Bridges S, Craig R. Chapter 7: Well-being, health and work. Health Survey for England. Leeds: The Health and Social Care Information Centre, 2010.
17 Haller M, Hadler M. How social relations and structures can produce happiness and unhappiness: an international comparative analysis. Soc Indic Res 2006; 75: 169–216.
18 Oguz S, Merad S, Snape D. Measuring national well-being: what matters most to personal well-being? London: Offi ce for National Statistics, 2013.
19 Shirai K, Iso H, Ohira T, et al. Perceived level of life enjoyment and risks of cardiovascular disease incidence and mortality: the Japan public health center-based study. Circulation 2009; 120: 956–63. 20 Tindle HA, Chang YF, Kuller LH, et al. Optimism, cynical hostility,
and incident coronary heart disease and mortality in the Women’s Health Initiative. Circulation 2009; 120: 656–62.
21 Strine TW, Chapman DP, Balluz LS, Moriarty DG, Mokdad AH. The associations between life satisfaction and health-related quality of life, chronic illness, and health behaviors among U.S. community-dwelling adults. J Comm Health 2008; 33: 40–50. 22 Giltay EJ, Geleijnse JM, Zitman FG, Hoekstra T, Schouten EG.
Dispositional optimism and all-cause and cardiovascular mortality in a prospective cohort of elderly dutch men and women. Arch General Psyc 2004; 61: 1126–35.
23 ONS. Analysis of Experimental Subjective Wellbeing Data from the Annual Population Survey, April to September 2011. London: Offi ce for National Statistics, 2012.
24 Fleche S, Smith C, Sorsa P. Exploring determinants of subjective wellbeing in OECD countries: evidence from the World Value Survey. Paris: OECD Publishing, 2011. http://dx.doi. org/10.1787/5kg0k6zlcm5k-en.
25 Berkman L, Breslow L. Health and ways of living: the Alameda County study. New York: Oxford University Press, 1983.
26 Idler EL, Benyamini Y. Self-Rated Health and Mortality: a review of twenty-seven community studies. J Health Soc Behav 1997; 38: 21–37.
27 Kaplan GA, Camacho T. Perceived health and mortality: a nine-year follow-up of the human population laboratory cohort.
Am J Epidemiol 1983; 117: 292–304.
28 Koopmans T, Geleijnse J, Zitman F, Giltay E. Eff ects of happiness on all-cause mortality during 15 years of follow-up: the Arnhem Elderly Study. J Happiness Stud 2010; 11: 113–24.
29 Blazer DG, Hybels CF. What symptoms of depression predict mortality in community-dwelling elders? J Am Geriatr Soc 2004; 52: 2052–56.
30 Steptoe A, Deaton A, Stone A. Subjective wellbeing, health, and ageing. Lancet 2015; 385: 640–48.