Volume 28
Number 359
The effect of injury simulating hail
damage to soybeans
Article 1
January 1949
The effect of injury simulating hail damage to
soybeans
R. R. Kalton
Texas Research Foundation
C. R. Weber
U.S.D.A.
J. C. Eldredge
Iowa State College
Follow this and additional works at:
http://lib.dr.iastate.edu/researchbulletin
Part of the
Agriculture Commons
, and the
Agronomy and Crop Sciences Commons
This Article is brought to you for free and open access by the Iowa Agricultural and Home Economics Experiment Station Publications at Iowa State University Digital Repository. It has been accepted for inclusion in Research Bulletin (Iowa Agriculture and Home Economics Experiment Station) by an authorized editor of Iowa State University Digital Repository. For more information, please [email protected].
Recommended Citation
Kalton, R. R.; Weber, C. R.; and Eldredge, J. C. (1949) "The effect of injury simulating hail damage to soybeans,"Research Bulletin (Iowa Agriculture and Home Economics Experiment Station): Vol. 28 : No. 359 , Article 1.
January, 1949 Research Bulletin 359
The Effect of Injury Simulating
Hail Damage to Soybeans
By R. R. KALTON, C. R. WEBER AND J. C. ELDREDGEAGRICULTURAL EXPERIMENT STATION IOWA STATE COLLEGE OF AGRICULTURE
AND MECHANIC ARTS FARM CROPS SUBSECTION
AGRONOMY SECTION
UNITED STATES REGIONAL SOYBEAN LABORATORY DIVISION OF FORAGE CROPS AND DISEASES
BUREAU OF PLANT INDUSTRY, SOILS AND AGRICULTURAL ENGINEERING AGRICULTURAL RESEARCH ADMINISTRATION
UNITED STATES DEPARTMENT OF AGRICULTURE Cooperating
CONTENTS
Page
Summary ... : ... 736
Introduction ... : ... 739
Review of pertinent literature ... -... 741
Experimental methods ... _ ... 744
Experimental results ... ." ... _ ... 758
Simulated hail tests ... _ ... _ ... _... 759
Seed yield ... _ ... : ... __ ... _ ... 7::>9 Other agronomic characters ... _ ... 767
Non-weeded test ... ; ... 770
ChE~.mical composition of the seed ... 772
Stand reduction tests ... : ... : ... 775
Seed yield ... : ... 775
Other agronomic characters ... , ... 780
Defoliation tests ... 780
Seed yield ... ~... 780
Other agronomic characters ... 784
Chemical composition of the seed ... : ... ~ ... 786
Simulated shatter test .. : ... , ... , ... 789
Discussion . ... ... ... ... ... 790
736
SUMMARY
1. Each year during a 4-year period light, medium and h.eavy simulated hail damage was inflicted on replicated plots of soybeans at different stages of development. Two methods of inflicting injury, beating and clipping, were com-pared for 1 year with a difference of only 1/10 bushel be-tween them. In one year two varieties (Lincoln and Rich-land) were used. They responded in a similar manner to
~u~ .
2. Yields were consistently reduced most when simulated hail damage was inflicted at· about the time seed began de-veloping in the lower pods. Average decreases in yield at that stage were 27, 50 and 77 percent for light, medium and heavy damage, respectively. Yields were reduced least when the plants injured were 6 to 12 inches tall and had from two to five trifoliate leaves unrolled.
3. Simulated hail injuries before and during blooming delayed maturity approximately 3 days for medium and 8 days for heavy damage. All degrees of damage after the "green bean" stage hastened maturity several days. Plant height was reduced most when injury was inflicted during blooming. Heavy damage during that period decreased height approximately 40 percent. Medium and heavy dam-age while seed was developing lowered its quality and mark-edly reduced its size. Light damage slightly decreased seed size at the same stages.
4. -In a 1-year test weed growth was appreciably in-creased on plots which were not hand-weeded only when all plants were cut off above the cotyledons at stage 1 (plants were 4 to 5 inches tall with one trifoliate leaf com-pletely unrolled). The added weed growth only slightly decreased the yield as compared with the hand-weeded plots. 5. Although protein percentage of the seed was 'not ap-preciably affected by the simulated hail injuries, oil per-centage was consistently decreased by heavy damage before the pods began to yellow. To a lesser extent, medium dam-age showed the same tendency. The greatest decrease in oil percentage of the seed was 2.4 percent, which resulted from heavy damage at the time the beans in the lower pods were approaching the "green bean" stage. All degrees of damage during the period of pod formation and early seed development tended to increase the iodine number of the oil with Richland, but this tendency was apparent only fol-lowing medium and heavy damage with Lincoln.
737
cutting off 25, 50 and 75 percent of the plants at ground level and at one-half their height at five stages of growth. Reductions in yield became progressively greater from stand removal as the plants developed. Yields were de-creased most when beans in the pods were approaching the "green bean"stage and .the lower leaves had started to yellow. Removal of 25, 50 and 75 percent of the plants at the ground level at that stage reduced the yield an aver-age of 16, 43 and 73 percent, respectively. Before bloom-ing 25 and -50 percent stand reduction at ground level and at half height reduced yields about the same. After blooming, cutting off the plants at ground level consistently reduced yields more than cutting them off at half height. At all stages of growth cutting off 75 percent of the plants at ground level caused greater reduction in yield than cutting at half height.
7. Stand removal had little effect on plant height and date of maturity. Reducing th.e stand 50 and 75 percent just before and during blooming slightly decreased plant height.
8. In defoliation tests for 2 years 10, 25, 50, 75 and 100 percent of the leaves were removed at five stages of plant development from replicated plots of Richiand. Removing 10 to 75 percent of the leaves before blooming reduced the yield only slightly. When all leaves were removed during the same period, the average yield decreased 22 percent. Yields were reduced most in every instance when leaves were removed at the time beans were beginning to develop in the lower pods. Decreases in yield at that stage were 8, 13, 18, 36 and 83 percent for 10, 25, 50, 75 and 100 percent defoliation, respectively.
9. Maturity was delayed 4 to {) days by 100 percent de-foliation before and during blooming and was hastened sev-eI:al days by 75 and 100 percent leaf removal after the plants reached the "green bean" stage. lesser amounts of defoli-ation had no significant effect on maturity. Plant height was markedly decreased only by total defoliation befor~ and during blooming. The greatest decrease, 19 percent, oc-curred at full bloom stage. Poorer seed quality resulted only with 100 percent defoliation during the period of seed de-velopment. Seed size was decreased approximately 10 and 22 percent by 75 and 100 percent leaf removal, respectively,
at the same stages.
-10. Leaf removal had no appreciable effect on protein percentage of the seed. Oil percentage was decreased an average of 1.7 percent by 100 percent defolia,tion during
788
the period of seed development. In both years iodine num-ber of the oil was increased by 50, 75 and 100 percent leaf removal during the stage of beginning seed development: The same treatments in the second year caused an increase in iodine number at the "green bean" stage.
11. Lodging in these studies was not considered compar-able to that following actual hail. Simulated damage tended to decrease the amount of lodging, while actual hailstorms generally cause considerable increases in lodging due to accompanying winds.
12. A I-year tffit on simulated seed shattering indicated that seed size is important in estimating shatter losses from hail.
Th~
Effect of Injury Simulating Hail
Damage to Soybeans
1By R. R. KAL1'ON, C. R. WEBER AND J, C. ELDREDGE:!
Hail has damaged soybeans in Iowa rather frequently in recent years. Although no figures are available on the ex-tent of these losses to soybeans alone, the annual estimat~d losses from hail damage to all crops in Iowa from 1936 to 1946 may show their probable significance. These . losses, shown in table I, were compiled from township assessors' reports. Crop losses due to hail damage apparently were considerably above average from 1942 to 1946. During this same period soybean acreage and 'production reached an all-time peak in Iowa (table 2).
The expan.ded acreage and production of. soybeans to-gether with the increased incidence of hail has resulted in a large increase in the hail insurance" written on this crop. Little was known reg.arding the evaluation of hail losses to soybeans when these experiments were initiated. Neither farmers nor hail adjustors knew the recovery to expect after soybean crops were damaged by hail at different stages of plant development. To provide th~s information was th.e principal objective of the investigations reported in this
bulletin. .
Hailstorms cause various kinds and degrees of injury to soybean plants. In some instances only a few leaves. are torn off or shredded and stems slightly bruised. In other case!!! practically all leaves may be removed and many" plants m~y be broken down or cut off, In the latter part of the season pods may be bruised. or knocked off in addition to leaf and stem injuries. Terminal buds may be cut off or damaged at different stages of development. The types of possible hail injury fall naturally into several differen~ 'Project No. 856 of the Iowa Agricultural Experiment Station which was sup· ported In part by a grant in aid from the Western Han and Adjustment Association and five Mutual Hall Insurance Companies. U.S.R.S.L. Publication No. 172. The authors are Indebted to the staff of the U. S. Regional Soybean Laboratory, Urbana.
m., for the chemical analyses of the seed.' Grateful acknowledgment is also extended to Professors H. D. Hughes and I. J. Johnson who have offered many constructive suggestions and criticisms during the course of these investigations and in the prep· aration of this manuscript. John Staby. Experiment Station Photographer. took the photographs shown herein.
"Formerly Re •• arch Associate. Farm Crops Subsection. Iowa Agricultural Experi. ment Statl.on.. now Associate Agronomist. Texas Research Foundation; Aasoclate Agronomist. U. S. Regional Soybean Laboratory. Division of Forage Crops anil Diseases, United States Department of Agriculture; and Research Associate Professor, Farm Crops Subsection, Iowa Agricultural Experiment Statlon, respectively,
740
TABLE 1. ANNUAL ESTIMATED LOSSES FROM HAIL DAMAGE TO ALL CROPS IN IOWA FROM 1936-46."
Year 1936 1937 1938 1939 1940 1941 1942 1943 1944 1945 1946 20.vear average 1928-42
Estimated crop losses from hail damage
$ 2,898,790 1,890,235 1,599,187 1,107,816 1,637,645 2,649,434 4,184,133 13,232,824 10,000,175 6,839576 7,464,212 3,092,366
Number of Iowa counties reporting hail damage
89 187 94 83 80 91 95 97 95 96 95
"Taken from the Annual Iowa Yearbooks of Agriculture Issued by the Iowa State Department of Agriculture and published by the State of Iowa, Des Moines, Iowa.
classes as follows: (1) leaf shredding or removal, (2) stem damage involving bruising, breakage or removal, and (3) pod bruising or removal. Anyone or all of these types of hail damage may occur during the growing season, After plants are mature, the main type of damage is shattering. Hailstorms cannot be manufactured at will nor can the accompanying weather conditic)lls be duplicated, We were able, however, to inflict different degrees of damage to soy-bean plants that approximated a combination of the various types of injury resulting from actual hail. We studied separately different percentages of leaf and stem removal at different stages of plant development and determined their effect on yield and chemical composition of the seed and on other agronomic characters. The results obtained in these simulated hail tests and their possible relationships to actual hail damage are presented and discussed herein.
TABLE 2. ANNUAL ACRF.A..nE A)lD PRODUCTION 01" SOYBEANS HARVESTED FOR BEANS IN lOW A FROM 1936-46.·
Year 1936 1937 1988 1939 1940 1941 1942 1943 1944 1945 1946 Acres 174,452 219,120 305,943 539,365 702,720 932,609 1,799,757 1,857,744 1,884,090 1,883,619 1,539,181 Production In bushels 2,408,847 4,050,229 6,462,314 11,095,972 13,968,336 15,799604 34,723,807 35,708,298 37,939.251 34,358.795 35,119,653
·Taken from the Annual Iowa Yeartooks of Agriculture Issued by the Iowa State Department of AI<riculture and published by the State of Iowa, DeB Moines, Iowa.
741
REVIEW OF PERTINENT LITERATURE
Simulated hail studies have been conducted with several different crops. The majority reported have been with corn and the small grains. Eldredge (4) reviewed hail studies with corn previous to 1935 and reported the results of a 5-year study on the effect of injury imitating hail damage on development of the corn plant. He found that the great-est reduction in yield of grain occurred when damage (leaf stripping, leaf shredding and stalk bruising) was inflicted during the tasseling period. Similar results were obtained by Kiesselbach and Lyness (11). In a defoliation experi-ment with kaoIiang, Li and Liu (13) removed all leaves at various stages of growth and also obtained the greatest reduction in seed yield during the blooming period. Com-plete defoliation when the kernels were in the dough stage caused insignificant decreases in yield.
The effect of several types of injury at weekly intervals during the growing season on yields of wheat, oats and barley was measured by Eldredge (5). He found that dam-age inflicted during the vegetative stdam-ages resulted in less reduction in yield than damage at heading time, with the reductions being progressively less at weekly intervals be-fore heading. In an experiment designed to measure the the effect of grasshopper damage, White (16) completely defoliated wheat plots at a number of stages of plant de-velopment. Yields were reduced most when all leaves were removed from heading to soft dough stage. Complete de-foliation during the two weeks just prior to maturity did not affect yields. Bushel weight and plant height were reduced most by defoliation when heads were emerging.
Klages (12) observed that the effects of simulated hail damage to flax were similar to those with small grains. In his studies, recovery from damage was greatest when plants were in the early stages of growth. Leaf removal was most detrimental to yield at the budding and flowering stages. The results indicated that mechanical injuries to the stems caused considerably more reduction in yield than removal of leaves.
Recently, Hawthorn (9) reported the results of a 2-year study of defoliation in onions. In that study (1) one-half the foliage and (2) all the foliage were removed from rows of two varieties of onions. The treatments extended over a period ranging 1 to 11 weeks before harvest in each of the two years 1943 and 1944. The most serious loss in yield resulted in both varieties when foliage was removed during
742
the beginning of bulb formation. Losses at that time varied from 84 to 100 percent.
Very little information has been published pertaining di-rectly to the effect of injury in imitation of hail damage to soybeans. Dungan (2) measured the effect of removing all leaves from spaced soybean plants cut off 1 foot above the ground at several different times during the period of, pod formation and bean development. When compared with paired undamaged plants, this type of injury caused an aver-age loss in yield of more than 95 percent. In another part of the same test removal of approximately 50 percent of the leaves at the same stages of development caused an average loss in yield of 22 percent. Yields were reduced most when half the leaves were removed at the time the pods were ap-proximately
1Y3
inches long and nearly flat. The least ef-fect on yield occurred when one-half the leaves were re-moved at the time the pods were full length and the beans. approximately one-half grown. This study was conducted only during the period of pod and bean development.In another experiment Dungan (3) damaged soybean plants in several ways at the following four stages: (1) first trifoliate leaf, (2) vegetative, (3) flowering and (4) seed one-half developed. At all stages when 100 percent of the leaves and cotyledons or 100 percent of the leaves and stems above the cotyledons were removed, no seed was produced. The removal of all leaves caused only slight reductions in seed yield at the first stage but much larger reductions at the last three stages. Removal of the upper leaves and parts of the stems, as the plants developed, resulted in progres-sively greater losses in yield. In every case the treatments delayed maturity in comparison with the checks. As this study was conducted in the greenhouse, the results may not be strictly comparable to field conditions.
In another simulated hail study with soybeans Fuelleman (6) removed three different percentages of leaves (30, 50 and 75 percent) from replicated rows of the Richland va-riety at each of seven dates throughout the growing sea-son. The 75 percent defoliation treatment also included bruising and breakage of stems. The 30 and 50 perc~nt de-foliation treatments before blooming reduced the yield little, whereas 75 percent defoliation materially reduced the yield. All rates of defoliation when inflicted at the period of pod and seed formation brought about severe reductions in yield.
A defoliation experiment with soybeans was ~onducted in North Carolina by Gibson, et al. (8). In this
investiga-743
tion varying quantities' of leaves were removed from two varieties at 10-, 20- and 30-day intervals during the grow-ing season. Reductions in seed yield were progressively greater as the amount and frequency of defoliation in-creased. Practically no seed was produced by one o'f the varieties (Biloxi) when completely defoliated at each of the three intervals. A small amount of seed was produced by the second variety (Tokyo) at the 20- and 30-day intervals of 100 percent-defoliation. The smallest decrease in yield resulted when all but six leaves were removed from each plant at 30-day intervals.
The experiments thus far reviewed were related only to the effect of injury on yield and maturity of soybean plants. Garner, et al. (7) noted that other agronomic characters also might be affected by varying degrees and kinds of injury. They studied the effect of partial defoliation and removal of blossoms and young seed pods on seed size, oil content of the seed, plant height and seed yield. Partial defoliation consisted of removal of 50 to 60 percent of the leaves several times just before and after blooming. In all cases this treatment decidedly reduced plant ~eight and total yield of seed but only slightly reduced seed size. Oil percentage of the seed, on the other hand, was increased by the injury. In another phase of the study a portion of the blossoms and young pods were removed shortly after blooming. This treatment also reduced the yield. The beans that developed in this case, however, were considerably larger than those on undamaged plants. Oil percentage of the seed was un-affected by this type of injury.
In addition to leaf and pod injuries, hail may also reduce the stand. Generally, with soybeans planted in rows at the recommended rate (approximately a bushel per acre for 36- to 42-inch rows) a stand of 9 to 12 plants per foot re-sults. Wiggans (17) and Probst (15) found that stand could vary from as few as four to five up to as many as 20 to 25 plants per linear foot of row without noticeable effect on yields when weeds were eliminated. The thicker stands, however, resulted in delayed maturity and more lodging. Results of many rate-of-seeding tests by a number of experiment stations also have indicated that soybean varieties can adjust themselves to a relatively wide range in stand without altering yield appreciably.
Injuries to leaves and stems resulting from hail may be confused with certain soybean diseases. This is especially true for bacterial blight, bacterial pustule, Alternaria leaf spot and frogeye disease, which are found on the leaves,
744
and for pod and stem blight, which is found on the stems and pods. Consequently, the ability to distinguish hail in-jury from disease is desirable. Johnson and Koehler (10) discussed and illustrated many of the important soybean diseases in the United States in 1943. Grasshopper injury to soybeans also might be confused with light hail damage, as both result in a "shot-hole" appearance of the leaves.
EXPERIMENTAL METHODS
Investigations relative to the effect of injury simulating hail damage to soybeans were initiated at the Iowa Station in 1943 and continued through 1946. The study was divided into four different phases as follows:
Simulated hail tests (1943 through 1946)
Defoliation tests (1945 and 1946)
Stand reduction tests (1945 and 1946)
Shatter test (1946)
In the simulated hail tests an attempt was made to simulate actual hail injury as closely as possible. This was done by using instruments to remove certain amounts of the leaves and to bruise and break the stems at various stages of plant development. In the defoliation and stand reduction tests specific amounts of leaves and stems, respectively, were re-moved at several dates during the growing season. The shatter test was concerned with estimating shatter losses on the basis of seed size results for several previous years.
TABLE 3. DESCRIPTION OF SIMULATED HAIL DAMAGE INFLICTED AT EACH STAGE OF GROWTH. 1943 THROUGH 1946.
Check-No damage. Light damage
Each stage of growth-average of 25-30 percent of leaves removed and 1-2 percent of plants broken. Minor stem bruising incidental to leaf removal.
First through se,'enth stage of I1:rowth-2-5 percent of terminal buds removed. Seventh through tenth stage of growth-1-3 percent of pods removed. Medium damage
Each stnge of growth-average of 55-60 percent of leaves removed and 4-7 percent of plants broken.
First through seventh stage of growth-lO-15 percent of terminal buds removed. Fourth through tenth stage of growth-plants bruised with one blow between a
lath al,d board.
Seventh through tenth stage of growth-3-7 percent of pods removed. Heavy damage
First stage of growth-nil plants cut all just above the cotyledons.
Second through tenth stare of I<"rowth-average of 80-90 percent of leaves removed. Second through seventh stage of I1:rowth-10-15 percent of plant. broken and
50-60 percent of terminal buds removed.
Seventh throul!h tenth stage of growth-8-12 pereent of pods removed. Eighth throu~h tenth stage of growth-6-l0 percent of plants broken.
Fourth through tenth stage of growth-plants bruised with two blows between a lath and board.
745
The methods and procedures used in each of these tests are presented and discussed in succeeding sections.
All investigations reported herein were conducted at the Agronomy Farm, Ames, Iowa. The plots were planted with small nursery planters at a rate of approximately 1 bushel per acre in each year, except 1945. In that year a slightly heavier rate was seeded resulting in a stand of 13 to 14 plants per foot. The stand in 1943, 1944 and 1946 was about 8 to 10 plants per foot.
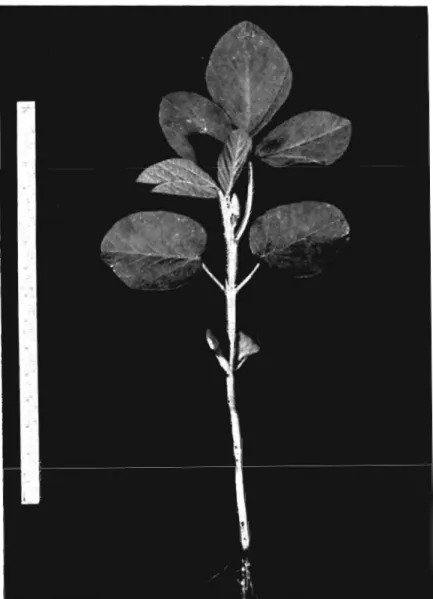
In 1943, three degrees of injury simulating hail damage were inflicted on small replicated plots of Richland soybeans at five different stages of development. A description of the damage that resulted is found in table 3. For simplicity, the three degrees of injury were designated "light," "me-dium" and "heavy" damage. The five stages of plant de-velopment at which damage was inflicted are described in table 4 as stages 1, 3, 5, 7 and 9; photographs of soybean plants representing each are shown in figs. 1 to 5, inclusive.
'l'ABLE 4. STAGES OF GROWTH AT WHICH SIMULATED HAIL INJURY WAS INFLICTED. 1943 THROUGH 1946.
Stage of Average Average
growth date height Ceneral description of plant development
June 18 2 June 28 3 July 8 4 July 15 July 21 6 Aug. 2 7 Aug. 12 8 Aug. 26 9 Sept. 4 10 Sept. 13 (inches)
4-6 First trifoliate leaf completely unrolled, second tri-foliate leaf in bud stage of unrolling.
7·9 Three trifoliate leaves comp'etely unrolled, fourth one beginning to unroll. Some cotyledons dropped.
12-14 Five to six trifoliate leaves unrolled. One to 5 per-cent of plants flowering.
15-18 Seven to eight trifoliate leaves unrolled. Some stem branching. Forty to 60 percent of plants flowering with one to four flowers per plant.
21-24 Nine to ten trifoliate leaves unrolled. More stem branching evident. Full bloom stage with withered flowers in lower leafaxils.
26-28 Pod. in lower half of plants well formed and up to % inch long. Practically through· blooming al-though a few flowers still in evidence in tops of plants.
31-33 Pods plainly evident in tops of plants. Lower pods nearly full length with beans deveJoping in them. Flowering ceased.
33-35 Pods in top of plants full length. Pods in lower half of plants containing beans approaching "green bean" stage. No yellowing of leaves.
33-36 Bottom leaves on plants beginning to yellow. Top pods almost fully developed with beans approaching
"green bean" stage.
34·37 Leaves 30 to 50 percent yellow with a few falling. Lower pods yellowing.
746
Fig. 1. Stage of growth 1. First trifoliate leaf completely unrolled: second trifoliate leaf unrolllujf.
747
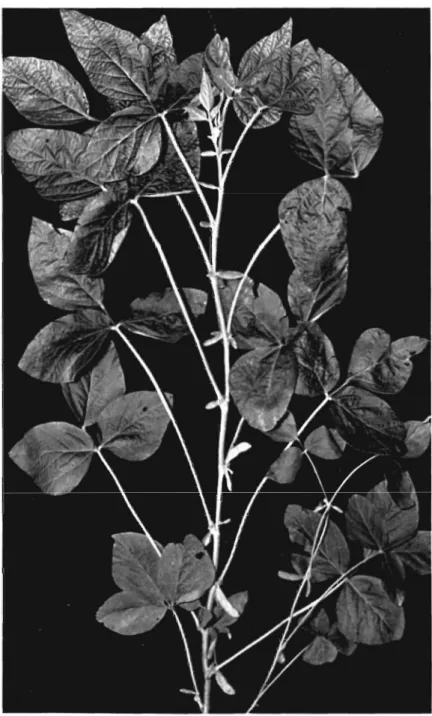
Fig. 2. Stage of growth S. Five to six trifoliate leaves unrolled: few plants flowering.
748
749
Fig. 4. Stage of growth 7. Poda plainly evident in tops of )Iant.. Lower pod. nearly full length with beans developing in them. Flowering ceased.
750
Fill'. o. Stage of growth 9. Bottom leaves on plants beginning to yellow. Top pods almost fully developed and with beans approaching "green bean" stage.
751
Plants were damaged by two different methods. In one method various portions of leaves and stems were clipped off with shears. In the second method, hereafter referred to as the shredding or beating method, an instrument made by mounting several heavy wire hooks on a paddle-like board was used to remove leaves and stems by an upward stroke. Either of these methods was satisfactory for obtaining the
desired degree of damage. '
The Richland variety was used in the 1943 hail study because of its lodging resistance and early maturity. These attributes made it especially adapted to these experiments. The experimental plots consisted of 15-foot rows spaced 36 inches apart. In subsequent years, 1944 through 1946, inclusive, 16-foot rows spaced 42 inches apart were used to reduce competition between rows treated differently. In all cases each row was damaged only once. A 4 x 4
latin square with the degrees of damage (check, light,
me-dium and heavy) as whole plots and the five stages of growth as subplots constituted the experimental design.
The effects produced by the two methods of inflicting damage in 1943 were very similar. Consequently, only the shredding (beating) method of inflicting injury was used in 1944 and in subsequent years. The 1944 test was en-larged by including five additional stages of plant
develop-Fig, 6, Injury resulting f.'om the infliction of Illilat damage at full b'oom stag ... stage of growth 6, Photo taken July 17. 1946,
752
Fig. 7. Injury resulting from the infliction of medium damage at full bloom stage, staKe of growth O. Undamaged row in background. Photo taken July 17, 1946.
Fig. 8. InjurY resulting from the infliction of heavy damage at full bloom .tage, stage of growth 5. Note recovery on row in background. It Was inflicted with heavy dnmage at stage of growth 3. Photo was tllken July 17, 1946.
753
ment. These stages, namely, 2, 4, 6, 8 and 10, are described in table 4.
The possibility that soybean varieties might react differ-ently to the effects of simulated hail injury prompted the inclusion of a second variety, Lincoln, in the 1944 test. Lincoln differs considerably from Richland in growth habit.
It lodges and branches more and matures a week later than Richland. The addition of Lincoln to the study necessitated a modification in the experimental design. A sub-subplot feature was included with varieties constituting the sub-plots and stages of growth the sub-subsub-plots. The whole plots of the 4 x 4 latin square remained the same. On the basis of' results in 1943 and 1944, the studies were con-tinued in the two succeeding years with only the Richland variety. The stages of growth, degrees of damage, plot size and experimental design remained the same. The studies were terminated in 1946.
Rows showing different degrees of damage at several stages of growth were photographed in 1946. Figures 6, 7 and 8 illustrate the damage resulting from infliction of three degrees of simulated hail injurY (light, medium and heavy) at full bloom stage (stage of growth 5). Several plants in the "green bean" stage damaged by actual hail are shown in fig. 9. Figure 10 shows a row inflicted with heavy damage at stage of growth 9. The amount and type of injury resulting from actual hail and simulated hail ap-pear to be similar in these two photographs.
The effects of injury simulating hail damage to soybeans were measured by the following plant and seed character-istics: seed yield, date of maturity, plant height, lodging, seed' quality, seed size, protein and oil percentage of the seed and iodine number of the oil. The methods used in de-termini,ng each of these characters were as follows:
Seed yield-air-dry plot yields calculated in 'bushels per acre.
Date
0/
maturity-expressed as the calendar date when 90-100 percent of the pods had turned brown and most leaves had fallen from the plants.Plant height-average height in inches from ground level to the highest point on the mature plants.
Lodging-scored on the scale -of 1 (nearly erect) to 5 (all plant~ nearly prostrate).
Seed quality-scored on a scale ranging from 1 (very good) to 5 (very poor), considering seed development, seed coat defectiveness, and color.
Seed size-expressed as weight in grams per 100 seeds.
754
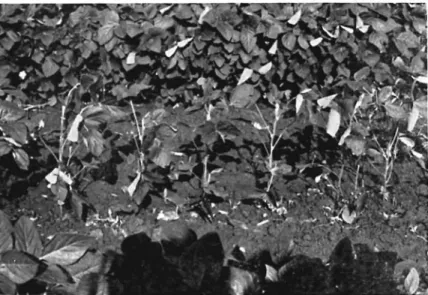
Fig. 9. Plants severely damaged by actual hail at the "green bean" stage. Col-Iprted neRr Relmond. Iowa. on Sept. 6. 1946.
755
Fig. 10. Injury resulting from the infliction of heavy damnl!e when bean" in tOIl
pods were approaching the "green bean" sta~e. stage of gro,,,,"th 9. Photo taken Sept. 2, 1946.
Protein and oil pe1'centage-expressed as percentage all
a dry weight basis.
Iodine number oj oil-a measure of drying quality of the
oil determined by refractive index on a colorimetric scale. Seed quality, size and chemical composition were not taken in the 1943 test.
One of the characteristic features of many hailstorms is that they break or cut off various portions of the soybean plants. Therefore, we studied separately the effeCt of dif-ferent amounts of stand removal at several stages of plant development on seed yield and other agronomic characters. The stand reduction test was initiated in 1945. In this test three percentages of stand, namely, 25, 50 and 75 percent, were removed at two different heights, one at ground level, the other at one-half the height of the plants. Each of these percentages of stand reduction was carried out at five stages of plant development corresponding to stages 1, 3, 5, 7 and 9, as described in table 4. The stand was reduced at each stage by cutting off the desired percentages of the plants at each height with a grass clipper. The appear-ance of rows in which 75 percent of the stand was removed at the two heights is shown in figs. 11 and 12. This same test was repeated in 1946.
756
Fig. 11. Part of a row in which 75 percent of the plants were cut orr at gmuncl level at full bloom stage, stal(e of growth 5. Check row in background. Photc, taken July 17, 1946.
Fig. 12. Part of a row in which 75 percent of the plants were cut off at One-half their height at full bloom stslle, sterre of Ilrowth 6. Note stem stumps in the ccnter of the picture. Photo taken July 17, 1948.
757
Richland, variety were planted in 16-foot rows spaced 42 inches apart. A 4 x 4 latin square with a double split plot was used as the experimental design. The percentages of stand reduction constituted the whole plots, heights were the subplots, and stages of gr9wth the sub-subplots. The effect of stand reduction on seed yield, date of maturity, plant height and lodging was determined in the same manner as in the simulated hail tests.
Hailstorms universally strip the leaves from soybean plants in varying amounts. For that reason a defoliation test in which certain percentages of leaves were removed from the plants also was conducted in 1945 and 1946. Five different percentages (10, 25, 50, 75 and 100) of leaves were removed at five stages of plant development during the season. The stages of growth corresponded to those described as 1, 3, 5, 7 and 9 in table 4. Leaves were re-moved by pinching off the desired percentage from each plant at a point just below the attachment of the leaf to the petiole (leaf stalk). By so doing, no other injury re-sulted to the plant. Figure 13 shows a row in which 100 percent of the leaves were removed at stage of growth 5
(full bloom stage) in the manner just described.
The exacting job of defoliation was conducted on rows 8 feet in length and spaced 42 inches apart so that all
de-Fig. 13. A row of Richland soybeans from which 100 percent of the leaves were removed when the plants were at full bloom stage, stage of growth 5. Note recovery by regeneration of new leaves of row at right from which 100 percent of the leaves were removed at stage of growth 3, and the row at left from which 100 percent of the leaves were removed at stage of growth 1. Photo taken July 17, 1946.
758
grees of defoliation at anyone stage of growth could be re-moved the same day. A randomized split-plot arrangement with percentages of defoliation as the whole plots and stages of growth as the subplots constituted the experimental de-sign. Each subplot was replicated four times. The effect of defoliation on agronomic characters and on chemical composition of the seed was determined as in the simulated hail tests.
Although most hailstorms in Iowa come during the grow-ing season, a few occur in late September and in October. At that time, the majority of soybean fields are mature, and seed shatt~ring is the primary result of hail. In order to obtain some information on estimating such losses, a small test simulating seed shattering was conducted in the fall of 1946. In this test the average weight in grams per hundred seeds of Richland for the several previous years was used to estimate the number of seeds required to obtain varying amounts of simulated shatter loss in bushels per acre. In all, 10 levels of shatter loss were estimated, rang-ing from no loss to a loss of 27 bushels per acre, with" 3-bushel intervals between each level. The estimated num-ber of beans then were removed from 8-foot rows of Rich-land spaced 42 inches apart. Four replications were used for each level of estimated shatter loss. The amount of beans removed was then calculated in bushels per acre and compared with the expected losses.
EXPERIMENTAL RESULTS
These investigations were divided into four distinct phases, and the results for each are presented separately in the following sections. Major emphasis of the discussion is placed on yield of seed, as it is the primary consideration in adjusting hail losses. Data for other agronomic char-acters and for chemical composition of the seed are pre-sented separately as long-time averages.
For brevity stages of growth usually are referred to by the numerical stage or stages. Calendar dates are omitted, since varietal and seasonal effects may have considerable influence on the time plants reach any particular stage of development. D~scriptions given in table 4 should be kept in mind, as a stage of growth usually can be ascertained with reasonable accuracy for any variety of soybeans in any sea-son. The effect of simulated hail injury to soybeans de-pends not only upon the amount and kind of damage but also upon the stage of development of the plants when damage occurs.
759
SIMULATED HAIL TESTS (1943 through 1946)
SEED YIELD
Information was sparse concerning the recovery of soy-beans from hail injury when these investigations were initi-ated in 1943. It was necessary, therefore, to design the experiments so as. to gain information on both the effect of simulated hail damage and the methods of inflicting in-jury. Two methods of inflicting injury were compared in the 1943 test-beating and clipping. These methods have already been described. Yields resulting from the&e meth-ods appear in table 5 and their analysis of variance in table 6. The two methods gave similar reductions in yield, with a difference of only 1/10 bushel. The yield discrepancies between the methods at stage 9 with medium and heavy damage were the result of greater pod removal with beating than with clipping.
In the 1944 test only the beating method of inflicting in-jury was used, out a second variety and five more stages of growth were added. The yields of the Lincoln variety in 1944 are shown in table 7. Yields for the Richland
va-TABLE 5. EFFECT OF THREE DEGREES OF SIMULATED HAIL DAMAGE INFLTCTED BY TWO METHODS AT FIVE STAGES OF GROWTH
ON YIELD OF SEED IN SOYBEANS. 1943.
Stage of Beating Clipping
]leg-ree of growth when
damage dama~ Yield Percent Yie'd Perc~nt
inflicted Bu./A of check Bu./A· of check
Cheek (no damage) 83.3 33.3
Light damage 1 32.1 96 31.3 94 8 32.3 97 31.2 94 5 27.9 84 26.5 80 7 21.2 64 21.8 65 9 26.8 80 28.0 84 Mean 28.1 84 27.7 83 Medium damage 1 32.3 97 32.1 96 3 32.2 97 33.0 99 5 27.9 " ~4 27.6 83 7 20.3 61 19.5 59 9 26.2 79 30.2 91 Mean 27.8 83 28.5 86 Heavy damage 1 31.2 94 24.7 74 3 28.4 85 25.9 78 5 22.7 68 22.0 66 7 15.7 47 14.2 43 9 18.4 55 26.8 80 Mean 23.3 70 22.7 68 Grand mean 26.4 26.3
760
TABLE 6. ANALYSIS OF VARIANCE OF YIELDS FOR SIMULATED HAIL TEST. 1948.
Source of variation D. F. Mean
square Whole plot-including checks on a sub-subplot basis:
Rows 3 16.14
Uolumns 3 22.34
lJegrees of damage 3 716.12
Error (a) 6 12.57
Subplot-eliminating checks on a sUb-subplot basis:
Stages of growth 4 556.95
Stages of growth x degrees of damage 8 3.34
Error (b) 36 4.81
Sub-subplot~lImlnating checks:
Method. of damage 1 .11
Methods x stages of growth 4 43.30
Method. x degrees of damage 2 4.64
Methods x stages x degrees of damage 8 13.49
Error (e) 45 6.67
TABLE 7. EFFECT OF THREE DEGREES OF SIMULATED HAIL DAMAGE AT 10 STAGES OF GROWTH ON YIELD OF SEED OF LINCOLN
SOYBEANS. 1944.
Stage of growth Lill'ht damage Medium damage Heavy damage
when damage Yield Percent Yield Percent Yield Percent
inflicted Bu./A of check Bu./A of check Bu./A of check
1 38.7 82 34.4 84 35.6 87 2 87.6 91 46.6 113 28.9 70 3 36.1 88 37.0 90 27.4 67 4 86.7 89 25.8 63 18.9 46 5 38.1 98 30.7 75 23.5 57 6 34.6 84 26.3 64 13.1 32 7 28.6 70 20.6 50 6.9 17 8 80.4 74 21.1 51 10.2 25 9 30.0 73 23.7 58 16.8 41 10 30.3 74 23.7 58 22.2 54 Mean 33.6 82 29.0 71 20.3 49
Average yield of check (no damage) in bushels per acre
=
41.1.riety in 1944, 1945 and 1946 are shown in table 8. Simi. lar degrees of damage and stages 9f growth were used in each of three years. Analyses of variance of yields for the 1944 test with two varieties, and for the 1944
to
1946 tests with Richland, appear in tables 9 and 10, respectively. Not all of the yield results obtained will be discussed in detail here, but the more significant features will be pointed out. In all tests noticeable decreases in yield re-sulted from different degrees of damage. On the average the decrease in yield for each degree of damage was similar761
TABLE 8. EFFECT OF THREE DEGREES OF SIMULATED HAIL DAMAGE AT 10 STAGES OF GROWTH ON YIELD OF SEED OF RICHLAND SOYBEANS.
Stage of 1944 1945 1946 19!:~~afge46
Degree growth
of damage damage when l:.elu Percent Yield Percent Yield Percent Yield Percent lnftlcted uU./n. of cheek Bu./A of cheek llu./A of check Bu./A of check
- - -
- -
- - -- -
-Check 36.11 30.0 33.2 33.4 (no damage) ~7.9 27.0 90 31.3 94 28.7 86 Light 1 76 damage 2 00.0 91 27.5 92 31.3 94 au.~ 92 3 a ... u 87 26.6 89 8~.7 98 aU.4 91 4 "V.b 80 27.6 92 l!U.5 89 ~~.Il 86 Ii U.l 84 l!6.0 87 28.2 85 l!IM 86 6 l:b.O 68 23.8 79 211.0 84 l!6.6 77 7 l:~.0 60 24.1 80 27.4 83 l!4.6 73 8 l:t;.1 71 25.8 86 25.7 77 26.8 77 9 l!'I.O 73 26.7 89 25.6 77 26.4 79 10 l!9.8 81 27.7 92 30.1 91 29.2 87 Mean 28.4 - 7 - 7 -26.3 - 8 - 8 - 29.0 - 8 - 7 - 27.9 8 4 -Medium 1 30.2 82 25.2 84 28.9 87 2S.1 84 damage 2 37.7 102 24.8 83 32.4 98 31.6 95 3 88.3 90 23.9 80 27.8 84 28.8 85 4 29.1 79 19.8 66 26.2 76 24.7 74 5 30.0 84 19.6 65 22.8 , 69 24.4 73 6 21.4 68 16.9 53 20.7 62 19.5 58 7 18.6 50 15.9 53 15.7 47 16.7 50 8 18.7 51 17.6 58 17.8 54 18.0 54 9 28.2 63 21.8 78 19.9 60 21.6 66 10 28.8 78 24.2 81 28.1 86 27.0 81 Mean 27.2 ' - 7 - 4 -2il:8 - 6 - 9 - ·23.9 -7-2-24.0 7 2 -Heavy 1 28.1 76 17.0 67 18.7 56 21.2 63 damage 2 29.8 81 21.0 70 26.6 SO 26.8 77 3 23.4 63 22.3 74 26.1 76 28.6 71 4 18.8 52 17.8 59 20.6 62 19.0 57 6 22.2 60 16.8 53 17.2 52 18.4 55 6 10.9 SO 10.0 88 14.8 45 11.9 36 7 6.1 17 8.3 28 8.8 27 7.7 23 8 10.4 28 11.0 37 9.9 SO 10.4 31 9 21.6 59 18.3 61 14.9 45 18.S 56 10 28.0 76 22.6 76 22.2 67 24.3 73 Mean 19.9 - - 5 4 -'""i'ii:4 - 5 - 5 -17.9' - 6 - 4 -18.1
-6-4-in all years, irrespective of the method of damage or variety. Medium damage did not cause a greater reduction in yield than light damage in 1943, even though there were visual differences in appearance between the respective degrees of damage. From 1944 through 1946, however, medium damage
decrease~ the yield more than light damage, with the re-ductions being similar each year. Heavy damage caused the largest reductions in yield every year, the average loss in yield being slightly less than 50 percent in 1944, 1945 and 1946. The yield following heavy damage in 1943 was not decreased as much as in subsequent years. Two factors other than seasonal variations caused this result: (1) the severity of heavy damage was increased' after 1943; (2) plants were not bruised in the 1943 test but were in 1944 through 1946.
762
TABLE 9. ANALYSIS OF VARIANCE OF YIELDS FOR SIMULATED HAIL TEST WITH LINCOLN AND RICHLAND SOYBEANS. 1944.
Source of variation D.F. Mean
squat'e Whole plol-including checks on a sub-subplol basis:
Rows 3 86.86
Columns 3 168.44
Degrees of damage 3 4.848.79
Error (a) 6 62.60
Subplot-including checks on a sub-subplot basis:
Varieties 1 671.64
Varieties x degrees of damage 3 96.92
Error (b) 12 49.49
Sub-aubplot--eliminating checks:
Stages of growth 9 828.64
Slages of growth x degrees of damage 18 111.'11
Stages of growth x varieties 9 47.17
Stages of growth x degrees of damage x va deUes 18 14.69
Error (c) 162 10.12
Analyses of variance of yields (tables 6, 9 and 10) showed that the three degrees of damage caused consider-able differences in yield each year. There was also a differ-ential effect of injury at the various stages of growth, as indicated by the large differences among their mean yields each year. In practically all cases damage inflicted at stage 7 caused the greatest reductions in yield. In this period beans were beginning to<' develop in the pods. The effect of injury on yield at the earlier stages of growth was more variable than at later stages because of environmental
in-TABLE 10. ANALYSES O~' VARIANCE OF YIELDS FOR SIMULATED HAIL TESTS WITH RICHLAND SOYBEANS.
Mean squares Mean
Source of variation D.F. D.F. ~)uare
1944 1945 1946 1944-46
combined
, - - - -
-,
Whole plot-Including checks on a subplot basis:
Rows 3 74.97 41.59 9.82 9 42.12
Columns ~ 67.77 5.46 13.73 9 28.99
Degrees of damage 3 1,937.38 1.437.34 1.753.30 3 6.001.37
Years 2 890.41
Degrees of damage x years
6 6 63.32
Error (a) ,",' 46.10 7.32 to,9~ 18 21.47
Subplot--eliminating checks:
Slages of growth 9 403.03 127.15- 237.88 9 685.25
Stages of growth :x degrees
18
of damage .- 41.35 19.07 . - 22.28 18 59.86
Stages of growth x years 18 41.40
- Stages of growth x degrees
of damage x years 36 11.42
Error (b) 81
763
fluences. Plant recovery was relatively good following light and medium damage at stages 1 and 3 in 1943 and at stage 2 in 1946. Medium damaged plots at stage 2 in 1944 ,recovered sufficiently well to out yield the check. On the other hand, significant decreases in yield were obtained with light and medium damage at stage 1 in 1944. Heavy damage at stage 1 reduced yields considerably more in 1945 and 1946 than in 1943 and 1944. These somewhat erratic re-sults at the first three or four stages of growth show, thefore, that the environment influenced the amount of re-covery.
Damages from approximately stages 4 to 7 reduced the yield progressively more for each successive stage. After stage 7 the losses in yield became smaller with each later
loor---~---. ~
uso
W
I UTe lLOc;;
~
uJ
-!50 UI'll.
W4C [l. 10 \Fig. 14. Average yield. in percent of check resulting from three degrees of sim~. lated hail damage at 10 stages of plant de\'eJol>ment In Richland soybeans. 1944.46.
764
stage of plant development. Damage at the last few stages of growth was primarily mechanical in that losses were largely the result of pod removal. These results emphasize the importance of stage of plant development when injured as well as amount of injury in determining the effect of simulated hail damage to soybean yields.
Figure 14 shows that the greatest differences in yield reduction between all three degrees of damage in these tests were obtained at stages 6 through 8. Light and medium damage at stages 1 to 3 resulted in practically the same
re-ductions in yield. It was this differential in yield between
the stages of growth and the different degrees of damage that caused considerably large interactions in the 1944, 1945 and 1946 tests (see tables 9 and 10). This interaction was not high in the 1943 test (see table 6) because the dam-age inflicted was not as severe as in the last three years. The lack of an interaction between varieties and degrees of damage in the 1944 test indicated that the two varieties were affected in a similar manner by the three degrees of simulated hail injury. For this reason only Richland was utilized in the 1945 and 1946 tests.
The question might be asked: "Why do soybean plants damaged at certain stages of growth recover more than those damaged at other stages?" In all tests, recovery (measured by formation of new plant tissues) was greatest
, Fig. 15. At the left. a row in which all plants were cut off above the eotyledons at ".tage 1. Undamaged row at the right. Photo taken June 16. 1946. '
765
Fig. 16. Plant showing the production of new stem branches which originated In
the wdls of the cotyledcms 2 weeks after It was cut off above the cotyledons at
stage 1. Photo taken July 3, 1946.
during the earlier stages of growth and practically non-existent after stage 6. Plants damaged at stages 1 through 5 or 6 formed new leaves and branches
to
replace in part those lost. An illustration of this type of recovery is shown in figs. 15 to 17. Figure 15 shows a row after all plants were cut off above the cotyledons at stage 1. Most of these plants produced new stem branches in the axils766
Fig. 17. At the right, II row .howing recovery 1 month after all plants were
"ut otT IIbove the cotyledons lit stage 1. Check rOW at the left. Photo taken July 17. 1946.
Fig. 18. From front to back, heavy damage at stages 4, 5, 3 and check taken at stage 5. Note tbe amount of reoovery in 11 days on the row damaged at stage 3.
767
of the cotyledons, in f.:e manner shown in fig. 16, and a month later the row appeared as in fig. 17. However, some of the plants in these rows died, and as a result the stand was reduced. The plants which survived produced new branches and leaves and, yielded an average of 63 percent of undamaged plants. Figure 18 shows three rows heavily damaged at the third, fourth and fifth stages of growth. One of the rows had already partially recovered by the regeneration of new leaves and branches when the photo-graph was taken. After full bloom (stage 5) the plants were not able to regenerate new leaves and stems, probably because the available food materials produced by the re-maining leaves were used for pod and bean formation, or because terminal primordia had already developed into flow-ers and vegetative primordia no longer were functional. Consequently, damage at stages 6 through 9 resulted in greater reductions in yield than damage during the earlier stages of plant development.
OTHER AGRONOMIC CHARACTERS
Several other agronomic characters in addition to yield were markedly affected by the simulated hail injury inflicted in these tests. As shown by the maturity data in table 11, heavy damage had a profound effect on date of maturity. Heavy damage at the first six stages of growth delayed maturity an' average of a week or more. Medium damage at the first five stages of growth delayed maturity about 3 days on the average. These effects were most noticeable at stages 1, 4 and 5. Light damage, on the other hand, ap-peared to have little effect on maturity. At the last two stages of growth there was a tendency for maturity to be hastened somewhat by all degrees of damage. Although seasonal variations influenced maturity, the general trends were similar each year.
All plots matured before frost in these investigations. Under actual farming conditions, however, most farmers grow full season varieties. Delays in maturity, therefore, would enhance the danger of frost injury, which might be the case when actual hailstorms occur during the early part
of the growing season. .
Plant height is important in harvesting soybeans. Short varieties such as Richland and Habaro bear many pods close to the ground. As a result, many such pods cannot be har-vested with a combine. The effect of injury in decreasing plant height in these tests (table 11) emphasized the
poten-768
TABLE 11. EFFECT OF THREE DEGREES OF SIMULATED HAIL DAMAGE AT 10 STAGES OF GROWTH ON DATE OF MATURITY AND
PLANT HEIGHT IN SOYBEANS.
I
I
Maturities" HeightsStage of .
Lincoln Richland Lincoln growth Rlchland
Deg-ree of damage when Av.1944-46 1944 Av.1944-46 1944 damage
inllicted %
of % of
In.
check In. check
- - -
- - -- -
- - -- -
-Check (no damage) 9-28 10-10 33 39
Light dama~e 1 0 -1 31 94 36 92 2 0 -1 32 97 88 97 3 +1 0 30 91 35 90 4 0 -1 80 91 36 92 5 0 -1 30 91 37 95 6 --2 -2 30 91 37 95 7 --1 -1 32 97 38 97 8 -2 -1 33 100 38 97 9 - 2 -2 32 97 38 97. 10 - 2 --2 32 97 38 97 Medium damage 1 +3 +1 29 88 35 90 2 +1 0 30 91 37 95 3 +1
il
28 85 32 82 4 +5 24 73 27 69 5tt
. 2 25 76 29 74 6 -2 28 85 33 B5 7 - 1 -5 30 91 37 95 8 -1 -6 32 97 36 92 9 - 2 -6 32 97 36 92 10 -3 -8 32 97 35 90 HeR"Y damage 1 +12 +3 25 76 33 85 2 +6!i
27 82 31 79 3 +6 24 73 27 69 4 +10 21 64 23 59 5 +10 +6 19 58 24 62 6 +7 +5 24 73 25 64 7 +1 - 3 30 91 32 82 8 0 -6 31 94 33 85 9 ---2 -7 31 94 35 90 10 - 3 ·-8 31 94 36 £2*Maturity expressed as days later (+) or earlier (-) than average date of maturity {or the check.
tial importance that this character might assume in the adjustment of severe hail losses. The greatest decreases in height occurred when damage was inflicted during the fourth and fifth stages of growth-during the blooming period. All degrees of damage, however, reduced the height at stages 1 through 6. At the last few stages of growth there :was little effect on height. Increasing the severity of injury decreased plant height proportionately in every instance.
The data obtained on lodging were recorded but they are not reported here because they are not comparable to results in the field with actual hail. Hailstorms generally are accompanied with winds, and the combined effect ·of hail and wind causes considerable lodging. In these studies
769
damage decreased the lodging. In fact, the tendency was for the least lodging to occur with heavy damage. This probably was because the removal of plant parts lessened the weight on main stems in comparison to that found in undamaged plots.
Seed quality and seed size also were affected by the dif-ferent degrees of damage. Seed quality is an important factor in determining the market price of soybeans. Table 12 shows that the quality of seed obtained from damaged plots was definitely poorer than seed from check plots. In general, seed quality became poorer as the severity of in-jury increased, with the poorest seed quality resulting from heavy damage at stages 8 and 9. Seed quality at these stages was sufficiently poor to justify a lower price than for undamaged beans.
TABLE 12. EFFECT OF THREE DEGREES OF SIMULATED HAIL DAMAGE AT
10 STAGES OF GROWTH ON SEED QUALITY AND SEED SIZE IN SOYBEANS.
Seed quality indices· Grams per 100 seeds Stage of
growth Richland Lincoln
Degree of damage when Av. 1944-46 1944
damage Richland Lincoln intlicted Av. 1944-46 1944
Gm. %of Gm. % of
check check
-Check (no damage) 1.0 1.0 16.9 15.2
Light damage 1 1.0 2.0 17.1 101 16.0 106 2 1.0 1.8 17.1 101 15.8 104 8 1.2 1.3 17.3 102 15.5 102 4 1.0 1.3 16.9 100 15.5 102 6 1.2 1.3 IS.5 98 15.4 101 6 1.1 1.8 16.7 99 15.1 99 7 1.8 1.3 16.2 96 14.8 97 8 1.0 1.8 15.9 94 14.7 97 9 1.4 1.8 15.6 92 13.9 91 10 1.3 1.8 16.2 96 14.4 95 l.lcdium damage 1 . 1.2 1.3 17.1 101 16.1 106 2 1.1 1.0 17.1 101 16.1 106 3 1.3 1.8 16.7 f'9 16.9 105 4 1.7 2.0 16.9 100 16.7 110 5 1.6 1.8 16.6 fi8 16.0 IO~ 6 1.8 1.6 16.9 94 14.5 95 7 1.8 1.8 15.5 92 14.3 94 8 2.2 2.3 14.8 85 13.6 89 9 2.0 2.5 H.~ S5 12.8 84 10 1.8 2.0 :6.6 98 14.1 93 Heavy carnage 1 1.6 1.8 18.1 107 16.3 107 2 1.2 2.0 16.8 99 17.1 113 8 1.7 1.8 17.1 101 17.2 113 4 1.6 2.0 17.3 102 17.2 113 5 1.5 2.0 16.8 99 16.6 Ion 6 1.9 1.5 16.2 96 15.1 99 7 2.2 2.0 14.6 86 12.S 83 8 2.9 3.0 13.1 78 11.5 76 9 2.6 3.0 18.5 80 11.5 76 10 2.0 2.8 16.2 96 13.5 89
'Seed quality was scored on a scale ranging from 1 (very good) to 5 (very poor). coruddering seed development. seed coat defectiveness and color.
770
Data appearing in table 12 also show that seed size was appreciably decreased at stages 7 through 9 with all degrees of damage. Heavy damage at stage 8 caused an average reduction of 22 percent in seed size of Richland. In addi-tion to affecting seed size, damage during the last three or four stages of growth produced many flat aborted seeds, only a few of which were found in seed from check plots. This effect on seed size was reflected in poorer quality seed during the later stages of plant development.
NON·WEEDED TEST
Weeds are one of the most serious menaces to profitable soybean production. Often hail during the first part of the .growing season has greatly enhanced the growth of weeds in soybean fields by lessening the number and size of
plants. In all previously discussed simulated hail tests
the plots were hand-weeded to eliminate the influence of weed growth on results. In this test, conducted in 1946 only, the plots were not hand-weeded and damage was in-flicted only at stages 1, 3, 5, 7 and 9. Data were collected on the effect of the different degrees of damage on agro-nomic characters, and observations were made on the effect of damage on weed growth.
Fig. 19. On the left. a ,·ow showing the depleted stand and amount of recovery 19 days "fter all plants were cut off above the cotyledons at stage 1. Photo taken
771
Fig. 20. The center row shows weed growth which developed 7 wee~ after all
plants were cut ofT above the cotyledons at stage 1. Photo taken Aug. 6. 1946.
The only marked increase in weed growth followed heavy damage at stage 1, when all plants were cut off above the cotyledons. As previously stated, stand was reduced on plots subjected to such treatment, thereby leaving blank spaces for weeds to grow. This is illustrated in fig. 19, taken 19 days after heavy damage at stage 1. The prolific weed growth that resulted is shown in fig. 20. Damage at other stages did not cause appreciable increases in weed growth.
The agronomic data in table 13 include the measurements on maturity, lodging, seed quality, plant height and seed yield. The analysis of variance of the yields appears in table 14. Although this test was conducted in another field, the results were remarkably similar to those obtained in 1946 in the comparable hand-weeded test already dis-cussed. The percentage reduction in yield resulting from heavy damage at stage 1, despite the added growth of weeds, was only slightly greater than that observed in the hand-weeded test. It is possible, however, that actual hail damage to farmers' fields during the earlier stages of growth may result in a greater growth of weeds and cause larger reductions in yield than observed in this test.
772
TABLE 13. EFFECT OF THREE DEGREES OF SIMULATED HAIL DAMAGE AT FIVE STAGES OF GROWTH ON MATURITY. LODGING. SEED
QUALITY, PLANT HEIGHT AND SEED YIELD OF SOYBEANS ON PLOTS NOT HAND-WEEDED. 1946.
Stage of Height Yield
growth Seed
Degree of when Maturity· Lodging quality Peroent Percent
damage damage score index Inches of Bu/A of
inflicted cheek check
- - - -- - - -Check 9-20 1.4 1.0 31 29.7 (no damage) 27.7 93 right 1
t
~
1.3 1.0 29 94 damage 3 1.5 1.0 28 90 27.4 92 5 1.0 1.0 28 90 25.2 86 7 0 1.0 1.0 30 97 24.2 81 9 - 1 1.0 1.0 31 100 24.9 84 Mean ~ -8-7-Medium 1Ii
1.5 1.0 29 94 27.3 92 damage 3 2.0 1.0 26 81 26.7 ~~ , 6 1.3 1.0 18 58 19.7 7 1.5 1.3 26 84 16.9 64 9 1.0 1.8 30 97 19.3 65 Mean ~ ~ Heavy 1r~
1.0 1.3 25 81 15.8 53 damage 3 1.5 1.0 22 71 23.6 79 5 15 1.0 1.0 15 48 16.8 . 53 7 5 2.0 1.3 27 87 8.2 28 9 1 1.3 2.3 30 97 16.0 64 Mean l'5.9-5-4-·Maturity expressed as days later (+) or earlier (-) than average date of maturity for check.
TABLE 14. ANALYSIS OF VARIANCE OF YIELDS IN SIMULATED HAIL TEST ON PLOTS NOT HAND-WEEDED. 1946.
Source of variation D. F. Mean square
Whole plot-including checks on a subplot basis:
Rows S 88.80 Columns 3 41.80 Degrees of damage 3 702.28 Error (a) 6 7.45 Subplot·-eliminating checks: Stages of growth 4 158.48
Stages of growth x degrees of damage 8 30.51
Error (b) 86 2.78
CHEMICAL COMPOSITION OF THE SEED
Several chemical characteristics of soybean seed are con~
sidered of industrial importance. These include protein and oil percentage and iodine number of the oil. Conse~ quently, .it seemed desirable to determine whether or not the injuries inflicted affected these characteristics, as any marked changes would concern the soybean processors.
773
TABLE 15. EFFECT OF THREE DEGREES OF SIMULATED HAIL DAMAGE AT 10 STAGES OF GROWTH ON PROTEIN AND OIL PERCENTAGE
OF THE SEEn AND ON IODINE NUMBER OF THE OIL.
Stage of Protein percentage Oil percentage Iodine no. of oil growth
Richland Richland Richland
Degree of when
damage damage average Lincoln average Lincoln average Lincoln inflicted 1944-46 1944 1944-46 1944 1944-46 1944
- - - -
- - --Check 41.9 41.4 20.0 20.2 127.6 137.4 (no damage) 1 41.6 41.9 20.0 2u.3 127.9 136.8 Light damage 2 41.~ 41.6 19.8 2u.3 128.2 136.6 3 41.9 42.4 19.8 20.2 127.8 137.3 4 41.7 42.1 19.9 ~O.4 127.7 137.4 5 41.S 42.1 19.9 20.5 127.8 137.2 6 41.7 41.2 20.1 20.6 128.7 137.4 7 41.3 41.3 19.9 20.6 129.8 137.7 S 40.8 41.6 19.9 20.8 130.0 138.3 9 41.1 41.1 19.7 20.3 29.0 137.7 10 41.3 41.6 20.2 20.3 127.6 138.0 Medium 1 41.0 42.2 1U.~ 20.1 128.7 186.5 damage 2 41.0 41.7 19.7 20.5 128.1 137.0 3 41.4 42.0 19.7 20.3 128.1 137.7 4 41.1 43.2 19.6 19.6 129.2 136.9 5 41.5 42.1 19.7 20.0 129.0 137.2 6 41.2 41.1 19.9 20.4 130.9 138.0 7 41.2 40.5 19.7 20.4 132.0 188.9 8 40.6 41.2 19.2 19.6 133.3 139.4 9 41.8 41.6 19.1 19.4 130.1 188.7 10 41.3 41.2 19.9 20.3 128.0 138.6 Heavy 1 42.2 42.0 19.2 19.7 130.8 137.4 damage 2 41.6 43.4 19.4 19.4 128.8 137.2 3 42.0 43.0 19.1 19.4 129.2 137.2 4 42.0 43.1 19.3 18.9 180.5 137.5 5 42.2 43.5 19.4 19.4 130.4 137.4 6 41.8 41.9 19.1 19.1 J32.2 138.0 7 41.9 42.1 1R.9 lS.9 134.9 141.4 8 42.4 42.7 17.6 17.2 184.8 142.0 9 41.8 42.1 18.6 IS.4 130.1 139.4 10 41.6 42.2 lfl.7 19.9 127.8 139.1
-Table 15 shows that protein percentage was not appre-ciably affected by any degree of damage at any stage of growth. Variations in protein percentages were of a random nature expected due to seasonal fluctuations in the environment and to sampling. Oil percentage of the seed, however, appeared to be affected 'by heavy damage and to some extent by medium damage. Seed from heavily dam-aged plots was consistently lower in average oil percentag'3 than seed from undamaged plots. The greatest decrease in oil content occurred at stages 8 and 9 with both the medium and heavy degrees of injury. Light damage caused little perceptible effect on oil percentage at any stage of growth. These results indicated that severe hail injury during the period of bean formation may cause not only large reduc-tions in yield but also substantial decreases in oil content of the seed.