sustainability
Article
Analysis of Pavement Condition Survey Data for
Effective Implementation of a Network Level
Pavement Management Program for Kazakhstan
Antonio Pantuso1 , Giuseppe Loprencipe1,* , Guido Bonin2andBagdat Burkhanbaiuly Teltayev3
1 Department of Civil, Constructional and Environmental Engineering, Universitàdegli Studi di Roma
“La Sapienza”, DICEA—via Eudossiana, 18, 00184 Rome, Italy; [email protected] 2 SPT Studi e Pianificazione del Territorio S.r.l., Via Tuscolana 336, 00181 Roma (RM), Italy;
3 KazDorNII, Kazakhstan Highway Research Institute, Nurpeissov Street, 2 A, Almaty 050061, Kazakhstan;
* Correspondence: [email protected]; Tel.: +39-06-44-585-112
Received: 29 December 2018; Accepted: 5 February 2019; Published: 10 February 2019
Abstract: Pavement roads and transportation systems are crucial assets for promoting political stability, as well as economic and sustainable growth in developing countries. However, pavement maintenance backlogs and the high capital costs of road rehabilitation require the use of pavement evaluation tools to assure the best value of the investment. This research presents a methodology for analyzing the collected pavement data for the implementation of a network level pavement management program in Kazakhstan. This methodology, which could also be suitable in other developing countries’ road networks, focuses on the survey data processing to determine cost-effective maintenance treatments for each road section. The proposed methodology aims to support a decision-making process for the application of a strategic level business planning analysis, by extracting information from the survey data.
Keywords:network level; pavement survey data analysis; pavement management program; strategic decision level; international banks of development; Asian Development Bank
1. Introduction
Transportation highway systems are essential for the political stability and economic growth of developing countries [1]. However, backlogs and high costs of maintenance characterize the highway systems in those countries. Therefore, road agencies need appropriate procedures and methods for survey data processing, in order to develop the business planning of future investments at the strategic level based on pavement condition assessments.
Development banks are promoting the implementation of Performance-Based Maintenance Contracting (PBMC) for their funded projects, since the payments for these projects are based on performance measures. However, network-level pavement management strategies (PMS) in these countries are limited, and there is a lack of experience on the part of road agencies personnel.
This paper proposes the implementation of a methodology for the processing and analysis of pavement survey data at the network-level. In this work, pavement condition indicators have been used, to give a score of pavement functional condition; and to enhance the decision-making process, pavement structural measurements have been applied, such as the Falling Weight Deflectometer (FWD). This research provides knowledge on the use of spatial data processing techniques and the implementation of Linear Referencing Systems (LRS) to associate survey attribute data and road Sustainability2019,11, 901; doi:10.3390/su11030901 www.mdpi.com/journal/sustainability
inventory data via their geographical location. The development of geospatial location algorithms ensures spatial consistency and supports the creation of a pavement management database. The integration of performance measurements into the decision-making process ensures cost-effective mid-term repair treatment strategies within a network level pavement management program for Kazakhstan.
2. Background
One of the aims of a roadway agency is to keep the entire network managed to a high level of service [2]. Therefore, a successful PMS should include indicators to reflect the current pavement condition and to predict the future pavement condition of the road network features. PMSs include a set of tools to support the decision-making process that is useful for determining Maintenance, Repair and Reconstruction (M, R&R) treatments at the network level [3].
Pavement surface distress data collection is one of the main elements of a cost-effective PMS, so several methods have been proposed worldwide to support the pavement management process. The main contribution to the state-of-the-art has been developed by the U.S. Army Corps of Engineers (USACE) in the 1980s, defining the Pavement Condition Index (PCI) rating procedure. The PCI measures the integrity and the surface operational condition of the pavement, based on a numerical scale, ranging from 100 (perfect condition) to 0 (failed pavement) [3]. The American Society for Testing and Materials (ASTM) adopted this procedure, as documented in ASTM D6433: Standard Test Method for Roads and Parking Lots Pavement Condition Index Surveys [4]. This methodology has been widely used by roadway agencies throughout the USA by readapting the definition of the pavement overall index to suit their local conditions (such as data collection techniques). Researchers and highway agencies around the USA summarized the use of pavement scores by US states, including: the rating methods used, the score scales, and distress definitions [5–7]. In particular, they did a complete literature review comparing the level of agreement among six condition indexes from five US Department of Transportation (DOT) agencies, testing pavement data obtained from the Pavement Management Information System of the Texas DOT. Some pavement state agencies are using the pavement score indexes combined with other pavement functional measurements, such as the International Roughness Index (IRI). Pavement indexes have been developed based on the aggregation of several distress types in order to measure the overall condition of the pavement, agency-specific pavement condition data collection procedures and distress rating protocols [8]. For example, the Federal Highway Administration (FHWA) road inventory program for the National Park Service (NPS) uses the Pavement Condition Rating (PCR), a combination of pavement surface distresses and pavement roughness, as a weighted combination of the contribution of both components [9]. Nevertheless, the pavement structural condition affects the pavement performance and the knowledge of the structural condition is vital for pavement management at both the network level and the project level [10]. The pavement structural capacity is typically obtained by using non-destructive techniques based on surface deflection measurements, such as the Falling Weight Deflectometer (FWD), Rolling Weight Deflectometer (RWD) and Traffic Speed Deflectometer (TSD); or based on destructive techniques that rely on the extraction of material in situ (coring) and the testing of extracted materials [11–14].
FWD is the most widely non-destructive testing device accepted for the structural evaluation of pavements based on their deflection responses [15]. The FWD test is performed by dropping a weight on the pavement, creating a load pulse that simulates the load produced by a rolling vehicle wheel. Deflection sensors (geophones) are mounted radially from the center of the load point (plate) to measure the deflection response of the pavement. FWD data collection technologies are usually independent of any surface distress data collection, and the sampling data is obtained at individual points. According to Kansas DOT studies, FWD tests on 20% mileage appear to be a valid statistical choice, and three tests per mile are the minimum test frequency required at the network level [16].
The use of FWD measurements at the network level was enhanced by simplifying the determination of the pavement Structural Number (SN) [17] from FWD measurements, without performing a back calculation analysis, using the Rohde [18] method. Consequently, USDOTs
Sustainability2019,11, 901 3 of 16
developed pavement structural conditions based on deflection measurements, and the Texas DOT developed the Structural Condition Index (SCI), which is the ratio between the effective (SNeff) and required (SNreq) SN [19]. This approach was adopted by the Virginia DOT at the network-level, who used it as a screening tool. SCI discriminates between pavements that needs structural reinforcement (SCI< 1) and those that are in sound structural condition (SCI> 1), giving a measure of the degree of structural deficiency [20]. Therefore, the remaining pavement structural capacity and service life can be calculated with this information for network-level decisions. Thus, the road agencies may adopt cost-effective methods for rehabilitating roads using the evaluation of long-term properties of new rehabilitation techniques [21].
Previous studies in this field have examined network level PMS programs with the objective of recommending network maintenance treatments based on: overall pavement surface conditions, traffic data, structural conditions, and other performance indicators [22]. Those programs include spatial geodatabases and visualization tools [23] for defining homogeneous sections and segments, based on: the remaining pavement life [24], predefined variable jumps in a dynamic way [25], logistic regression analyses using candidate project selections [26], and ranking algorithms [27].
Nonetheless, network level PMS programs utilize a high quantity of data coming from a large variety of sources, containing: pavement inventory data, results from pavement surveys, budgeting, and investment business information. However, the high amount of data stored in PMS databases can make it difficult to extract information from the data. Therefore, to aid the decision-making process and to improve the quality of the information retrieved, useful data visualization tools and data mining applications need to be implemented in the PMS. To this end, USDOTs use spatial referencing systems in conjunction with LRS to integrate PMS data retrieved from different sources, providing consistent references that can be used to report PMS analyses [28,29].
In Kazakhstan, the Road Assets Management System (RAMS, see [30]) is in the early stages of implementation. The RAMS will be managed by the Committee for Roads under the Ministry of Industry and Infrastructure Development of the Republic of Kazakhstan. The scope of the RAMS is to monitor the pavement conditions of the main road network (Republican Road Network) through the use of multi-function devices (mobile laboratories). The data collected is stored in the RAMS database and can be further used for additional processing purposes, as an input to calibrate the Highway Development and Management Model (HDM-4) for Central Asia conditions.
The HDM-4 model is a software system, developed by the World Bank, for evaluating road transport infrastructures’ different investment options in economic terms [31]. The use of HDM-4 should in any case be limited to the strategic and network levels only, providing a tool to identify the best strategies to optimize the allocation of funding (through a HDM-4 economic analysis model), considering also how each strategy results in terms of the pavement quality (through the indicators evaluated by the HDM-4 engineering analysis model).
The methodology presented in this paper is focused on the development of a set of procedures for a survey data analysis with the aim of implementing a national pavement management program in Kazakhstan. The developed methodology successfully integrates functional survey data (cracking, roughness, rutting, and texture) and structural performance measurements (deflection data using FWD), into a decision-making process that ensures cost-effective maintenance strategies.
3. Methodology 3.1. Overview
Figure 1 shows the core of the maintenance strategy tools developed to support the implementation of performance-based maintenance contracts in developing countries. This methodology involves:
• the integration of collected survey data, and their relation to the inventory data available through the application of an LRS;
• the analysis of survey data using the PCR, the study of deflection tests using the SCI and the definition of criteria for the definition of homogeneous sections of study;
• the interpretation of rules to design maintenance and rehabilitation strategies for the homogeneous sections of the analysis; and
• the development of procedures to report the results of the analysis using Geographic Information System tools and exporting the data into the RAMS to perform a strategic analysis.
Sustainability 2019, 11, x FOR PEER REVIEW 4 of 17
the development of procedures to report the results of the analysis using Geographic Information System tools and exporting the data into the RAMS to perform a strategic analysis.
Figure 1. Framework of the proposed methodology.
3.2. Data Collection
This research was conducted using data collected in the Republic Road Network of Kazakhstan for Asphalt Concrete (AC) pavements in the region of Kostanay Oblast of Kazakhstan, where 1514 km of republican roads (highways) were surveyed. The pavement surface distress data were collected and processed using continuous digital imaging, and automated cracking detection techniques of pavement surface distress for straight and reverse traveling directions, (see Figure 1a). The distress type, severity, and extension of the surveyed distresses (alligator cracking, longitudinal and transverse cracking, block cracking, raveling, and patching) were measured with the Pavemetrics® Laser Crack Measurement System (LCMS), [32] on a continuous basis. Simultaneously, longitudinal and transverse profile measurements such as the roughness measured using the Class I profilometer (ASTM E 950‐94, [33]) transverse profile (for measuring the transverse evenness using the measurements of sensors of a profilometric bar mounted on a surveying integrated vehicle traveling at highway speed), and the surface texture measurement, were surveyed for straight and reverse directions. The profiling data were provided continuously each 100 m from the available pavement survey data. For ease of interpretation, the surface distress data was summarized each 100 m. Furthermore, the pavement deflection data were collected using a Dynatest FWD device. The deflection sensors (geophones) were mounted radially at 0, 200, 300, 450, 600, 900, 1200, 1500, and 1800 mm from the center of the load point (plate) to measure the deflection response of the pavement. FWD tests were performed on a regular basis at each kilometer. The pavement structural thickness and material data were taken from the available road inventory data (passport data), as they are necessary to perform the FWD deflection bowl or deflection basin analysis (see Figure 2b).
Figure 1.Framework of the proposed methodology.
3.2. Data Collection
This research was conducted using data collected in the Republic Road Network of Kazakhstan for Asphalt Concrete (AC) pavements in the region of Kostanay Oblast of Kazakhstan, where 1514 km of republican roads (highways) were surveyed. The pavement surface distress data were collected and processed using continuous digital imaging, and automated cracking detection techniques of pavement surface distress for straight and reverse traveling directions, (see Figure2a). The distress type, severity, and extension of the surveyed distresses (alligator cracking, longitudinal and transverse cracking, block cracking, raveling, and patching) were measured with the Pavemetrics®Laser Crack Measurement System (LCMS), [32] on a continuous basis. Simultaneously, longitudinal and transverse profile measurements such as the roughness measured using the Class I profilometer (ASTM E 950-94, [33]) transverse profile (for measuring the transverse evenness using the measurements of sensors of a profilometric bar mounted on a surveying integrated vehicle traveling at highway speed), and the surface texture measurement, were surveyed for straight and reverse directions. The profiling data were provided continuously each 100 m from the available pavement survey data. For ease of interpretation, the surface distress data was summarized each 100 m. Furthermore, the pavement deflection data were collected using a Dynatest FWD device. The deflection sensors (geophones) were mounted radially at 0, 200, 300, 450, 600, 900, 1200, 1500, and 1800 mm from the center of the load point (plate) to measure the deflection response of the pavement. FWD tests were performed on a regular basis at each kilometer. The pavement structural thickness and material data were taken from the available road inventory data (passport data), as they are necessary to perform the FWD deflection bowl or deflection basin analysis (see Figure2b).
SustainabilitySustainability2019 2019,,11, 901 11, x FOR PEER REVIEW 5 of 17 5 of 16 (a) (b)
Figure 1. Pavement survey equipment. (a) Profiling and cracks survey vehicle; (b) Dynatest© FWD
Testing. Source (a) and (b): SPT Srl– Studi e Pianificazione del Territorio.
3.3. Data Processing: Linear Referencing System and Spatial Positioning Merging Procedures
The objective of the LRS is to define locations in space and within the pavement network (spatial referencing), to establish the connectivity between system assets and specific referenced segments that support planning scenarios, in order to allow for a comparison between different temporal versions of the spatial and attribute data [28]. LRS allows for the localization o pavement survey data, along with pavement inventory data, via the use of LRS road names and mile/kilometer posts that are physically distributed along the road as a reference to survey data events (i.e., cracks data, roughness data, rutting data and deflection data) that are involved in the next steps of the analysis. The main advantage of this approach is that PMS inspected features can be geolocated and integrated into a PMS database, providing a consistent and reliable reference for their management and representation using GIS and web‐based applications to enhance the decision‐making process [23,34,35].
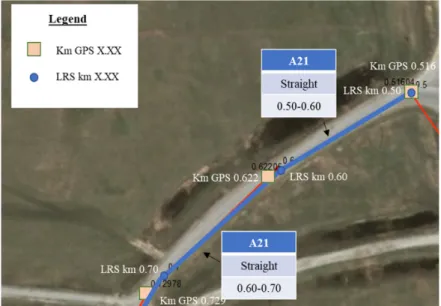
The matching of the spatial procedures was accomplished using the feature coordinates of the adopted LRS and Geographical Positioning Systems (GPS) locations, which were recorded from event features (latitude and longitude) derived from the surveyed data within the managed network. Therefore, the surveyed events can be referenced to the known distance of the LRS using the GPS coordinates of the events and the linear or offset from the milepost measured by the survey vehicle. As a result, the implementation of LRS provides a base reference of the road profile and allows a resampling of the profile with a predetermined spatial base according to the purpose of the analysis (100 m base length for rutting, IRI‐roughness, macro‐roughness and cracking data, and 1 km base length for deflection data, see Figure 2).
Figure 2.Pavement survey equipment. (a) Profiling and cracks survey vehicle; (b) Dynatest© FWD
Testing. Source (a) and (b): SPT Srl– Studi e Pianificazione del Territorio.
3.3. Data Processing: Linear Referencing System and Spatial Positioning Merging Procedures
The objective of the LRS is to define locations in space and within the pavement network (spatial referencing), to establish the connectivity between system assets and specific referenced segments that support planning scenarios, in order to allow for a comparison between different temporal versions of the spatial and attribute data [28]. LRS allows for the localization o pavement survey data, along with pavement inventory data, via the use of LRS road names and mile/kilometer posts that are physically distributed along the road as a reference to survey data events (i.e., cracks data, roughness data, rutting data and deflection data) that are involved in the next steps of the analysis. The main advantage of this approach is that PMS inspected features can be geolocated and integrated into a PMS database, providing a consistent and reliable reference for their management and representation using GIS and web-based applications to enhance the decision-making process [23,34,35].
The matching of the spatial procedures was accomplished using the feature coordinates of the adopted LRS and Geographical Positioning Systems (GPS) locations, which were recorded from event features (latitude and longitude) derived from the surveyed data within the managed network. Therefore, the surveyed events can be referenced to the known distance of the LRS using the GPS coordinates of the events and the linear or offset from the milepost measured by the survey vehicle. As a result, the implementation of LRS provides a base reference of the road profile and allows a resampling of the profile with a predetermined spatial base according to the purpose of the analysis (100 m base length for rutting, IRI-roughness, macro-roughness and cracking data, and 1 km base length for deflection data, see Figure3).
Sustainability 2019, 11, x FOR PEER REVIEW 6 of 17
Figure 2. Implementation of LRS and GPS matching procedures at the network level.
3.4. Data Analysis: Pavement Functional Evaluation
The pavement survey data were analyzed using a dual approach which consists of integrating the pavement functional condition and structural evaluation to ensure a cost‐effective mid‐term maintenance treatment strategy.
The PCR [9], the overall global functional condition indicator, has been proposed to combine the surface distress effectively into a composite index (1) – cracks collected, rutting data, and the Roughness Condition Index (RCI). The main advantage of the use of the PCR is that provides a quantitative evaluation of the section maintenance needs and the suggested maintenance activities within a rating scale.
𝑃𝐶𝑅 0.6 ∙ 𝑃𝐶𝐼 0.4 ∙ 𝑅𝐶𝐼
(1)
𝑅𝐶𝐼 253.67 ∙ 𝑒 . ∙ (2)
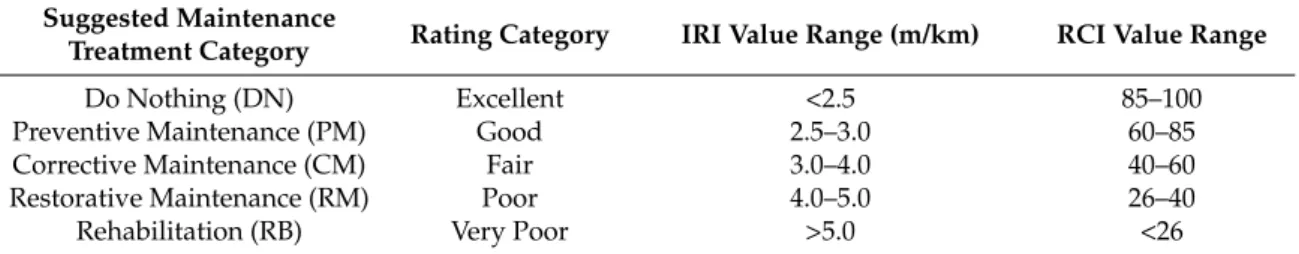
where PCI is the standardized ASTM D6433 PCI [4], and RCI (2) is a roughness indicator ranging from 0 (failed pavement) to 100 (perfect pavement) with the aim to adopt a similar scale to the PCI calculated using the roughness data expressed in the IRI [36]. Table 1 describes the correspondence between the IRI and RCI rating scales. To allow the computerization of the RCI calculation, (2) an exponential regression equation was defined to calculate the RCI starting from IRI, imposing an upper limit of 100 and lower limit of 0, respectively.
The use of PCR as the combination of the two indexes depends on the fact that the PCI was conducted based on the available distress type and severity recorded from the automatic identification of distresses using continuous imaging. Consequently, some of the distress types associated with the ride quality were not measured.
However, the use of RCI makes it possible to adequately consider their effects regarding the ride quality. The rutting data and cracking distress data (distress severity, type, and quantity) were summarized every 100 m, which was assumed as a sampling interval; the PCI was calculated using the Visual Basic for Application (VBA) procedure developed by Loprencipe and Pantuso [37,38].
Table 1. Correspondence between the IRI and RCI rating scales.
Suggested Maintenance
Treatment Category Rating Category IRI Value Range (m/km) RCI Value Range
3.4. Data Analysis: Pavement Functional Evaluation
The pavement survey data were analyzed using a dual approach which consists of integrating the pavement functional condition and structural evaluation to ensure a cost-effective mid-term maintenance treatment strategy.
The PCR [9], the overall global functional condition indicator, has been proposed to combine the surface distress effectively into a composite index (1)–cracks collected, rutting data, and the Roughness Condition Index (RCI). The main advantage of the use of the PCR is that provides a quantitative evaluation of the section maintenance needs and the suggested maintenance activities within a rating scale.
PCR=0.6·PCI+0.4·RCI (1)
RCI=253.67·e−0.459·IRI (2)
where PCI is the standardized ASTM D6433 PCI [4], and RCI (2) is a roughness indicator ranging from 0 (failed pavement) to 100 (perfect pavement) with the aim to adopt a similar scale to the PCI calculated using the roughness data expressed in the IRI [36]. Table1describes the correspondence between the IRI and RCI rating scales. To allow the computerization of the RCI calculation, (2) an exponential regression equation was defined to calculate the RCI starting from IRI, imposing an upper limit of 100 and lower limit of 0, respectively.
The use of PCR as the combination of the two indexes depends on the fact that the PCI was conducted based on the available distress type and severity recorded from the automatic identification of distresses using continuous imaging. Consequently, some of the distress types associated with the ride quality were not measured.
However, the use of RCI makes it possible to adequately consider their effects regarding the ride quality. The rutting data and cracking distress data (distress severity, type, and quantity) were summarized every 100 m, which was assumed as a sampling interval; the PCI was calculated using the Visual Basic for Application (VBA) procedure developed by_ENREF_10 Loprencipe and Pantuso [37,38].
Table 1.Correspondence between the IRI and RCI rating scales.
Suggested Maintenance
Treatment Category Rating Category IRI Value Range (m/km) RCI Value Range
Do Nothing (DN) Excellent <2.5 85–100
Preventive Maintenance (PM) Good 2.5–3.0 60–85
Corrective Maintenance (CM) Fair 3.0–4.0 40–60
Restorative Maintenance (RM) Poor 4.0–5.0 26–40
Rehabilitation (RB) Very Poor >5.0 <26
3.5. Data Analysis: Traffic Data
The traffic data effects on the pavement performance can be estimated using the Equivalent Axle Load Application (ESAL), a concept developed by the AASHTO Road Test [17] to establish a damaged relationship for comparing the effect of axles with different loads.
The damage effects of the full traffic spectrum of axle loading (different axle loads, and axle configurations predicted over the design period) are estimated using an equivalent number of single axle load applications summed up over that period. The Design Equivalent Standard Axle Load Applications (ESALd) is a cumulative traffic load summary statistic that simulates the effect of the traffic during the design period [39].ESALdcan be calculated using Equations (3) and (4):
ESALd= Nd
∑
i " N k∑
k Avk·ESALk ! ·Gf·Df # (3)Sustainability2019,11, 901 7 of 16 ESALk= Nk
∑
i Pki 100· AXLkij SAXLj !4 (4) whereESALd= Cumulated Equivalent Standard Axle Load Applications over the design period; Avk= average number of vehicles for each traffic category groupk;ESALk= Equivalent Axle Load factor based on the equivalency exponent of 4.0 for the vehicle groupk, in the Equivalent Standard Axle Load per vehicle;Gf= growth factor;Df= distribution factor;AXLkij= the average load on axlej of the load range of the vehicle groupk;SAXLj= standard single axle load of the axle group type,j; 6.60 t for a single-wheel single axle, 8.16 t for a dual-wheel single axle, 7.55 t for a dual-wheel tandem axle, 7.63 t for a dual-wheel triple axle.This research involves the study of Kazakhstan’s traffic spectrum, and the calculation of the ESAL per vehicle category has been calculated based on vehicle counts for each category (Table2).
Table 2. Equivalent Standard Axle Load ESAL per vehicle category group Kazakhstan full
traffic spectrum.
Vehicle Category GCM Axles Axle 1 Axle 2 Axle 3 Axle 4 Axle 5 Axle 6 ESALF
Light loads and minibuses <3.5 t 2 S * S * - - - - 0.0013
Bus medium, 20–40 seats 8 t 2 S 2.4 D 5.6 - - - - 0.239
Bus heavy, more than
40 seats 15 t 2 S 4.5 D 10.5 - - - - 2.958
Single trucks, less than 2 t 2 t 2 S 0.6 S 1.4 - - - - 0.002
Single trucks, from 2 to 5 t 5 t 2 S 1.5 S 3.5 - - - - 0.037
Single trucks, from 5 to 10 t 10 t 2 S 3.0 D 7.0 - - - - 0.584
Single trucks, from 5 to 10 t 10 t 3 S 2.6 TN 3.7 TN 3.7 - - - 0.139
Single trucks, from 10 to 20 t 20 t 4 S 4.2 S 5.0 TN 5.4 TN 5.4 - - 1.017
Road-trains with trailer,
type 1 25 t 4 S 5.25 S 6.25 TN 6.75 TN 6.75 - - 2.482 Road-trains with trailer,
type 2 25 t 5 S 4.0 S 5.25 S 5.25 TN 5.25 TN 5.25 - 1.403 Road-trains with trailer,
type 3 25 t 5 S 4.0 S 5.25 D 5.25 TN 5.25 TN 5.25 - 1.174 Road-trains with trailer,
type 4 25 t 6 S 3.0 D 4.75 D 4.75 S 3.0 D 4.75 D 4.75 0.712 Truck tractors with
semitrailer, type 1 14 t 3 S 4.2 S 4.2 D 5.6 - - - 0.550 Truck tractors with
semitrailer, type 2 20 t 4 S 4.2 D 5.0 TN 5.4 TN 5.4 - - 0.828 Truck tractors with
semitrailer, type 3 30 t 5 S 4.2 D 6.6 TR 6.4 TR 6.4 TR 6.4 - 2.077 Truck tractors with
semitrailer, type 4 38 t 4 S 7.22 D 10.26 D 10.26 TN
10.26 - - 10.752
Truck tractors with a
semitrailer, type 5 38 t 5 S 6.84 TN 7.79 TN 7.79 TN 7.79 TN 7.79 - 5.687 Truck tractors with a
semitrailer, 123 38 t 6 S 4.94 TN 6.94 TN 6.94 TR 6.46 TR 6.46 TR 6.46 3.203 Tractors, Light loads with
trailer type 1 3 t 3 S 0.7 S 1.3 S 1.0 - - - 0.002
Tractors, Heavy with trailer
type 2 10 t 4 S 1.0 S 2.0 TN 3.5 TN 3.5 - - 0.101
Notes: * Axle loads are different for each vehicle category; ESALFof this class is the average of all ESALFvehicles considered; GCM = Gross Combination Mass; Axle configuration types: S = Single-Wheel Single Axle; D = Dual-Wheel Single Axle; TN = Tandem-Wheel Tandem Axle; TR = Dual-Wheel Triple Axle; In this table, the vehicle category axle composition and weight-per-axle are defined as follows: Axle Type (S, D, TN, TR) numeric weight in ton.
3.6. Data Analysis: Deflection Data
The pavement deflection data were merged with inventory data (pavement thickness and materials) to analyze the deflection bowl or deflection basin obtained from the FWD test. The pavement thickness and materials, and the traffic counts in the inventory data were used to calculate the effective Structural Number (SN) of the existing pavement, (SNeff) [17], the strength index which provides
a measure of the existing pavement structural condition. On the other hand, the requiredSNreq(5) indicates the total thickness required for a given pavement thickness as a function of the accumulated traffic values over a design period expressed inESALs: ESAL20(3). For this study, the design period has been defined as 20 years, in accordance with the definition of the AASHTO Guide and PSI serviceability rating:
log(ESAL20) = (ZR·S0) +9.36·log SNreq+1 −0.2+ log ∆PSI 4.2−1.5 0.4+ 1094 (SNreq+1)5.19 +2.32·log(MR)−8.07 (5)
where SNreq = Required Structural Number; MR = resilient modulus of the subgrade; ESAL20 = Predicted number of Equivalent Axle Load Applications (ESALs) that will result in a change in serviceability of∆PSI; ZRis the standard deviation, andS0(0.5) is the combined standard error of the traffic prediction and performance prediction; usually the level of reliability considered can be at 95 %. For this, the logarithm ofESALswill be decreased by (1.645·0.40). For the calculation of the design period, an average growth factor (Gf) of 1.04 and a directional distribution factor of 0.55 (Df) will be used.
The objective of this research is to use FWD deflection measurements to decide between M, R&R at the network level. With this aim, the authors defined the required overlay parameter (d) in Equation (6), which gives information about the maintenance treatment thickness that is needed to ensure the structural pavement life over the design period and, consequently, the design rehabilitation treatment that would improve the pavement structural capacity:
d= SNreq−SNe f f
0.44·(1−C) (6)
whered= the required overlay in inches,SNreqandSNeffare the required and effectiveSN, respectively; C is a factor based on the condition of the pavement [40]; the Cfactor represents the percent of the contributing structure that remains in the removed layer of asphalt; for the extent of this study, the valueC= 0.35 would be used. This relationship based on a relationship proposed by Bryce, Flintsch, Katicha and Diefenderfer [20] assumes that the asphalt has an equivalent structural coefficient of 0.44 per in., and that the thickness of the design rehabilitation treatment that is associated with the contribution of the pavement overlay thickness will increase the current structural capacity in order to support the predicted accumulated traffic over the design period.
For the extent of this study, a simplified method based on Rohde [18], for the determination of the pavement SN from falling weight surface deflections was used, without performing a back calculation analysis. This method assumed that the pavement structure was a two-layered structure: a top Hot Mix Asphalt (HMA) concrete layer ofHPtotal thickness and a subgrade layer at the bottom modeled as a semi-infinite space. Based on that, the subgrade support (resilient modulus,MR) (6) was estimated with the outer FWD deflection (considered as almost entirely controlled by the subgrade) using Boussinesq Equations (7).
MR= P· 1−µ 2
π·Dr·r (7)
whereMR= elastic modulus of the subgrade (resilient modulus);Dr = deflection measured by the geophone at positionrexpressed in mm; P = FWD peak load expressed in N;µ = Poisson ratio
(considered as 0.35);r= distance of the outer geophone expressed in mm (in this testr= 1800 mm). Accordingly,SNeffwas calculated as follows:
1. Normalize pavement FWD deflection data to standard 40 kN load deflections, (8): Dk40kN= L40kN
LP
Sustainability2019,11, 901 9 of 16
whereDka= deflections at the fixed sensors at a 40 kN standard load;L40kN= stress in the plate for the standard load;Lp= measured stress in the plate for the tested peak load.
2. Determine the deflection at an offset of 1.5·HPfrom the FWD load application; this required the interpolation among the deflection that was measured at the fixed sensors positions (9):
Dx= (Rx−RB)·(Rx−RC) (RA−RB)·(RA−RC)·DA+ (Rx−RA)·(Rx−RC) (RB−RA)·(RB−RC)·DB+ (Rx−RA)·(Rx−RB) (RC−RA)·(RC−RB)·DC (9)
whereDx= Deflection atRx;DA,DB,DC= deflections at the closest fixed sensor position;RA,RB, RC= offsets of the closest sensors to Pointx;x= point for which the deflection is determined.HP = pavement depth–the thickness of all layers above the subgrade.
3. Determine the structural indexSIPof the pavement as follows (10):
SIP=D0−D1.5·HP (10)
where: SIP= Structural Index of the Pavement defined according to Rohde [18],D0 = peak deflection under the standard 40-KN (9000-lb.) FWD (microns), and D1.5Hp = deflection at 1.5 times the pavement total depthHP(microns).
4. Determine the existingSNeff, as in Equation (11):
SNe f f =k1·SIPk2·HkP3 (11) where: SNeff = effective structural number expressed in inches (in.); for asphalt pavements k1= 0.4728;k2=−0.4810; andk3= 0.7581;SIP= Structural Index of the Pavement in microns; andHP= total pavement thickness (mm).
The elastic modulus at the asphalt temperature measured during the testing,ETm
p , is obtained as an estimate of theSNeffusing Equation (12):
ETm P = SNTm e f f 0.0045·HP 3 (12)
The back-calculated asphalt moduli can be adjusted to the reference temperature (68◦F–21◦C) using the relationship proposed by Lukanen, et al. [41] for the Long-Term Pavement Performance (LTPP), as in Equation (13). Therefore, the corrected asphalt concrete elastic modulusETr
p is obtained through Equation (14): ATAF=10−0.021·(Tr−Tm) (13) ETr P =ATAF·E Tm P (14)
where:ATAF= Asphalt Temperature Adjustment Factors;Tm= Measured temperature (◦C); andTr= Reference temperature 20◦C (º68 F);
Therefore, the rehabilitation design treatment to restore the pavement structural capacity can be calculated as a function ofd, and the remaining service life (RL) can be calculated as the time until the cumulated number ofESALswould reach theESALeff, calculated from Equation (15):
logESALe f f = (ZR·S0) +9.36·log SNe f f+1 −0.2+ log( ∆ PSI 4.2−1.5) 0.4+ 1094 (SNe f f+1)5.19 +2.32·log(MR)−8.07 (15)
4. Results
4.1. Definition of Pavement Homogeneous Section Criteria
As a result, the pavement surface distress data, roughness, and rutting data expressed through PCR (1), and the pavement deflection data summarized by the required overlay parameter (d), are used simultaneously to determine the section maintenance needs and to define the suggested maintenance repair treatments.
This dual approach is essential because PCR provides a general idea about the current pavement condition. Nonetheless, pavement surface distresses would not always be able to reflect structural deficiencies in the examinated pavement sections, which are revealed only when certain distress types visually appear in the pavements. Consequently, cost-effective decision-making maintenance strategies are required to perform pavement structural evaluations that would be incorporated into the decision-making process through the parameterd. Practically,dis used to design M, R&R treatments and, in conjunction with the PCR, roadway managers would get involved in the final suggested maintenance treatment.
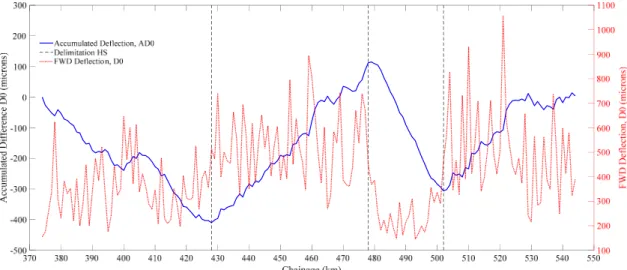
However, once pavement indicators have been defined, this research defines criteria to divide network routes into homogeneous sections. For this purpose, the FWD deflection data can be analyzed and processed to get the center deflection data normalized to the 40 kN-standard load (8). The accumulated differences of the center deflections are used to divide the length of the road into homogeneous sections, as in Equation (16):
AD0=
∑
δi−µ·i (16)whereAD0= Accumulated difference at the ith station;∑δi= sum of deflections from the first station to theith station inclusively;i= station number fromδ1toδi; andµ= mean deflection tested on the road.
According to this approach, a section will be considered homogeneous when the cumulative differences follow the same upward or downward trend (Figure4).
Sustainability 2019, 11, x FOR PEER REVIEW 11 of 17
treatments and, in conjunction with the PCR, roadway managers would get involved in the final suggested maintenance treatment.
However, once pavement indicators have been defined, this research defines criteria to divide network routes into homogeneous sections. For this purpose, the FWD deflection data can be analyzed and processed to get the center deflection data normalized to the 40 kN‐standard load (8). The accumulated differences of the center deflections are used to divide the length of the road into homogeneous sections, as in Equation (16):
𝐴𝐷
𝛿
𝜇 ∙ 𝑖
(16)where AD0 = Accumulated difference at the ith station; ∑δi = sum of deflections from the first station to the ith station inclusively; i = station number from δ1 to δi; and μ = mean deflection tested on the road.
According to this approach, a section will be considered homogeneous when the cumulative differences follow the same upward or downward trend (Figure 3).
Figure 3. Accumulated Difference Centered Deflection along road chainage.
In the same way, the PCR values that are classified by maintenance categories can be used to delimitate homogeneous sections. Due to the high variability of the PCR values in consecutive 100 m length segments, a smoothing process was applied to the PCR signal, as shown in Figure 4a. Compared with the PCR rating scale, the processed PCR values define the most proper maintenance activities for each analyzed section, as shown in Figure 5b. The final sectioning of the road is obtained with a combination of both methodologies.
Figure 4.Accumulated Difference Centered Deflection along road chainage.
In the same way, the PCR values that are classified by maintenance categories can be used to delimitate homogeneous sections. Due to the high variability of the PCR values in consecutive 100 m length segments, a smoothing process was applied to the PCR signal, as shown in Figure5a. Compared with the PCR rating scale, the processed PCR values define the most proper maintenance activities for each analyzed section, as shown in Figure5b. The final sectioning of the road is obtained with a combination of both methodologies.
Sustainability2019,11, 901 11 of 16 Sustainability 2019, 11, x FOR PEER REVIEW 12 of 17
(a)
(b)
Figure 4. Pavement Condition Rating obtained from the survey along road chainage. (a) PCR
indicator smoothed; (b) PCR maintenance categories.
4.2. Decision‐making Process
The application of the decision‐making process has been made based on the use of PCR values to trigger the suggested maintenance category. Table 2 summarizes the pavement maintenance activities considered by the extent of this study, which is aligned with the implemented Kazakhstan road agency maintenance standards.
Table 2. Pavement Maintenance Activities under Different Categories.
Cat. Pavement Treatment Category PCR Rating Scale Values d (cm) Rating Scale Values Pavement Condition Indicators Pavement Maintenance Category Treatment Description DN Do Nothing (DN) 85–100 ≤3 Pavement surface is in excellent condition and only minor distresses are
detected. Do Nothing PM Preventive Maintenance (PM) 60–85 4–7
The shape of the pavement is OK but may
be suffering from minor cracking and crazing on
the surface and occasional patch repairs.
Preventive Maintenance Surface
Treatment (Chip Seal, Slurry Seal, Micro‐surfacing)
Figure 5.Pavement Condition Rating obtained from the survey along road chainage. (a) PCR indicator
smoothed; (b) PCR maintenance categories. 4.2. Decision-Making Process
The application of the decision-making process has been made based on the use ofPCRvalues to trigger the suggested maintenance category. Table3summarizes the pavement maintenance activities considered by the extent of this study, which is aligned with the implemented Kazakhstan road agency maintenance standards.
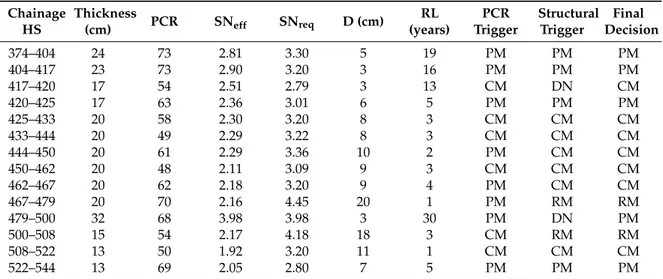
Specifically, the deflection measurements are used to definedand the remaining service life (RL) that reflects the homogeneous sections maintenance needs regarding the structural capacity (see Table4).
In fact, the use of the PCR rating as the only decision treatment may lead to a suboptimal decision. For example, the PCR rating suggests PM maintenance treatments for almost all of the length of the road but, looking at the structural indicators (RL and d) of the pavement, some sections have severe structural deficiencies that require CM and RM maintenance treatments to guarantee that the pavement lasts over the design period. The thickness of the maintenance treatment is designed using the parameter d. In addition, the RL parameter provides useful information to the road manager about the current pavement structural condition.
Table 3.Pavement Maintenance Activities under Different Categories. Cat. Pavement Treatment Category PCR Rating Scale Values d(cm) Rating Scale Values Pavement Condition Indicators Pavement Maintenance Category Treatment Description DN Do Nothing (DN) 85–100 ≤3 Pavement surface is in excellent condition and only minor distresses are detected.
Do Nothing PM Preventive Maintenance (PM) 60–85 4–7
The shape of the pavement is OK but may be suffering from minor cracking and crazing on the surface and occasional
patch repairs.
Preventive Maintenance Surface Treatment (Chip Seal,
Slurry Seal, Micro-surfacing) CM Corrective Maintenance (CM) 40–60 8–13
The pavement is sound but needs to be re-profiled, with a strengthening of the surfacing layers. The surface may be cracked and crazed in limited
locations.
Mill and AC Overlay (5 cm) RM Restorative Maintenance (RM) 26–40 13–20
Failure of the pavement top layers - not deep-seated but may include some local surface failures and a few isolated deep-seated failures.
Full depth recycling of 20 cm with the addition of new material (50% of crushed stone, 7% of bitumen); with AC overlay RB Rehabilitation (RB) <26 >20
Deep-seated failure of the pavement as evidenced by extensive cracking, shoving
and rutting of the surface.
Reconstruction. Mill, Break, compaction of the subgrade, and Seat and AC Overlay
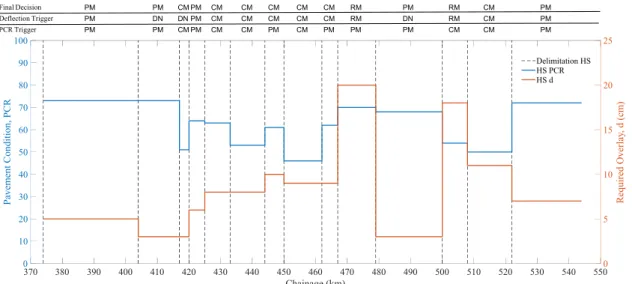
Table 4.Maintenance Decisions for the homogeneous sections along the road chainage.
Chainage HS Thickness (cm) PCR SNeff SNreq D (cm) RL (years) PCR Trigger Structural Trigger Final Decision 374–404 24 73 2.81 3.30 5 19 PM PM PM 404–417 23 73 2.90 3.20 3 16 PM PM PM 417–420 17 54 2.51 2.79 3 13 CM DN CM 420–425 17 63 2.36 3.01 6 5 PM PM PM 425–433 20 58 2.30 3.20 8 3 CM CM CM 433–444 20 49 2.29 3.22 8 3 CM CM CM 444–450 20 61 2.29 3.36 10 2 PM CM CM 450–462 20 48 2.11 3.09 9 3 CM CM CM 462–467 20 62 2.18 3.20 9 4 PM CM CM 467–479 20 70 2.16 4.45 20 1 PM RM RM 479–500 32 68 3.98 3.98 3 30 PM DN PM 500–508 15 54 2.17 4.18 18 3 CM RM RM 508–522 13 50 1.92 3.20 11 1 CM CM CM 522–544 13 69 2.05 2.80 7 5 PM PM PM
Figure6summarizes the averaged PCR and the parameter (d) for homogenous pavement sections along the road. It also includes the suggested maintenance treatment category, where the final decision is obtained from the most conservative maintenance treatment. As can be observed, the use of structural indicators is useful in deciding which pavement section requires full depth maintenance (RM) or rehabilitation (RB) treatments. Besides, it should be noted that the criteria in defining homogeneous sections according to central deflection (D0) are useful in determining the areas in terms of structural capacity.
Sustainability2019,11, 901 13 of 16 Sustainability 2019, 11, x FOR PEER REVIEW 14 of 17
defining homogeneous sections according to central deflection (D0) are useful in determining the areas in terms of structural capacity.
Figure 5. Pavement Condition Rating and required overlay for Homogeneous Sections along Road
Chainage.
5. Conclusions
This paper presents a methodology for the implementation of a network level pavement management program in Kazakhstan. This research was tested for priority roads in Kostanay (one region in Kazakhstan). Based on the analysis of the results we have obtained; the following remarks can be highlighted: The pavement survey at the network level involves a high quantity of data. The use of the data for cost‐effective PMS strategies requires specific procedures and rules to integrate them into a structured database. LRS and GPS merging data procedures are essential for further analyses. The use of the PCR, to give an overall score of the pavement functional condition, would be valid for deciding pavement needs at the network level, and it can be used as a first screening tool for identifying the most suitable pavement maintenance treatment in pavement sections. However, deflection measurements at the network level enhance pavement decision‐making because they can help discriminate, among the pavement sections that the PCR states are in good condition, those in need of structural maintenance treatments.
The definition of rules for the designing of maintenance and rehabilitation strategies for the homogeneous sections would support the decision‐making process at the network level. The proposed approach through pavement condition indicators provides information for the prediction of the maintenance and rehabilitation strategies of road segments. The indicators can estimate the expected benefits of maintenance treatments that are to be performed on the network.
The proposed approach leads to the implementation of a PMS for the national network of Kazakhstan, but it is still an early project that would evolve with further pavement inspections on the network. At the moment, it provides a glimpse of the current state of the network, which needs to be calibrated to the country’s local conditions (construction practices and procurement contracting). Even though the methodology developed in this study is based on the data available from the surveys performed in Kostanay over a single year, the availability of additional data may allow the forecasting of future pavement conditions. In any case, it is possible to extend this method to the other regions of Kazakhstan and, beyond that, it is possible to perform an economic evaluation involving stakeholders at the strategic level. 370 380 390 400 410 420 430 440 450 460 470 480 490 500 510 520 530 540 550 Chainage (km) 0 10 20 30 40 50 60 70 80 90 100 Pa ve m ent Condition, PCR 0 5 10 15 20 25 Re quire d O ve rla y, d (c m ) PCR Trigger Deflection Trigger Final Decision PM PM CM PM CM CM PM CM PM PM PM CM CM PM PM DN DN PM CM CM CM CM CM RM DN RM CM PM PM PM CM PM CM CM CM CM CM RM PM RM CM PM Delimitation HS HS PCR HS d
Figure 6. Pavement Condition Rating and required overlay for Homogeneous Sections along
Road Chainage. 5. Conclusions
This paper presents a methodology for the implementation of a network level pavement management program in Kazakhstan. This research was tested for priority roads in Kostanay (one region in Kazakhstan). Based on the analysis of the results we have obtained; the following remarks can be highlighted:
• The pavement survey at the network level involves a high quantity of data. The use of the data for cost-effective PMS strategies requires specific procedures and rules to integrate them into a structured database. LRS and GPS merging data procedures are essential for further analyses.
• The use of the PCR, to give an overall score of the pavement functional condition, would be valid for deciding pavement needs at the network level, and it can be used as a first screening tool for identifying the most suitable pavement maintenance treatment in pavement sections. However, deflection measurements at the network level enhance pavement decision-making because they can help discriminate, among the pavement sections that the PCR states are in good condition, those in need of structural maintenance treatments.
• The definition of rules for the designing of maintenance and rehabilitation strategies for the homogeneous sections would support the decision-making process at the network level. The proposed approach through pavement condition indicators provides information for the prediction of the maintenance and rehabilitation strategies of road segments. The indicators can estimate the expected benefits of maintenance treatments that are to be performed on the network.
• The proposed approach leads to the implementation of a PMS for the national network of Kazakhstan, but it is still an early project that would evolve with further pavement inspections on the network. At the moment, it provides a glimpse of the current state of the network, which needs to be calibrated to the country’s local conditions (construction practices and procurement contracting).
Even though the methodology developed in this study is based on the data available from the surveys performed in Kostanay over a single year, the availability of additional data may allow the forecasting of future pavement conditions. In any case, it is possible to extend this method to the other regions of Kazakhstan and, beyond that, it is possible to perform an economic evaluation involving stakeholders at the strategic level.
Nevertheless, the proposed methodology can be used for survey data analyses in other countries and networks, since it is based on pavement data collected using survey methodologies and pavement condition indicators widely recognized and accepted worldwide, such as the PCI and IRI.
Author Contributions: A.P. and G.L. conceived the original idea. A.P. developed the model and performed the computations. G.L. and G.B. verified the analytical methods and supervised the findings of this work. G.B. contributed towards the implementation of the model to Kazakhstan local conditions. B.T. provides valuable feedback to apply the analysis aligned with National Standards. All authors contributed to the final version of the manuscript.
Funding: This paper was done within the technical services rendered in the Asian Development Bank
Project TA-9134 KAZ—Consulting Services for Road Data Collection Surveys and Analysis for Maintenance Planning—Consulting Services for Road Data Collection Surveys and Analysis for Maintenance Planning (48399-003).
Acknowledgments: The Authors acknowledge the members of the Project Preparatory Technical Assistance
(PPTA) supervision team (Robert Fergerstrom, Samuel McCurdy and Aslan Sembayev) for the very useful discussions and suggestions, which helped the definition of the methodology and the practical outcomes. The Authors also acknowledge all the staff from the Kazakh Road Research Institute (KazDorNII) and in particular Erbol Aitbaev and Azamat Zhaisambaev, for their invaluable technical and institutional support, that was a key element to communicate and apply the procedures in compliance with the Country’s standards and stakeholder’s organization.
Disclaimer:The contents of this paper reflect the views of the author(s), who is responsible for the facts and the
accuracy of the data presented herein. The contents do not necessarily reflect the official views or policies of the Asian Development Bank.
Conflicts of Interest:The authors declare no conflict of interest.
References
1. Maˇciulis, A.; Vasiliauskas, A.V.; Jakubauskas, G. The impact of transport on the competitiveness of national economy.Transport2009,24, 93–99. [CrossRef]
2. Flintsch, G.W.; McGhee, K.K.Quality Management of Pavement Condition Data Collection; National Academies Press: Washington, DC, USA, 2009; Synthesis 401.
3. Shahin, M.Y. Pavement Management for Airports, Roads, and Parking Lots, 2nd ed.; Springer Publishing
Company: New York, NY, USA, 2005.
4. ASTM.ASTM D6433-18, Standard Practice for Roads and Parking Lots Pavement Condition Index Surveys; ASTM
International: West Conshohocken, PA, USA, 2018.
5. Papagiannakis, A.; Gharaibeh, N.; Weissmann, J.; Wimsatt, A. Pavement Scores Synthesis. College Station, TX: Texas Transportation Institute. 2009. Available online:https://static.tti.tamu.edu/tti.tamu.edu/documents/ 0-6386-1.pdf(accessed on 19 May 2018).
6. Wolters, A.S.; Zimmerman, K.A. Research of Current Practices in Pavement Performance Modeling;
FHWA-PA-2010-007-080307; Pennsylvania Department of Transportation: Harrisburg, PA, USA, 2010. Available online:https://trid.trb.org/view/919191(accessed on 19 May 2018).
7. Vavrik, W.R.; Evans, L.D.; Stefanski, J.A.; Sargand, S. PCR Evaluation–Considering Transition from Manual to Semi-Automated Pavement Distress Collection and Analysis. 2013. Available online:https://trid.trb.org/ view/1260427(accessed on 19 May 2018).
8. Pierce, L.M.; McGovern, G.; Zimmerman, K.A. Practical Guide for Quality Management of Pavement
Condition Data Collection. 2013. Available online: https://trid.trb.org/view/1265581 (accessed on
19 May 2018).
9. FHWA.Pavement Distress Identification Manual for the National Park Service Road Inventory Program; United States. Federal Highway Administration. Office of Infrastructure Research and Development: McLean, VA,
USA, 2009. Available online:http://www.wistrans.org//mrutc/files/Distress-ID-Manual.pdf(accessed on
19 May 2018).
10. Flora, W.F.Development of a Structural Index for Pavement Management: An Exploratory Analysis; Purdue
University: West Lafayette, IN, USA, 2009.
11. Bryce, J.M.; Flintsch, G.W.; Katicha, S.W.; Diefenderfer, B.K.; Sarant, A.Development of Pavement Structural Capacity Requirements for Innovative Pavement Decision-Making and Contracting: Phase II; Virginia Transportation
Research Council: Charlottesville, VA, USA, 2016; Available online: http://www.virginiadot.org/vtrc/
Sustainability2019,11, 901 15 of 16
12. Katicha, S.W.; Ercisli, S.; Flintsch, G.W.; Bryce, J.M.; Diefenderfer, B.K.Development of Enhanced Pavement Deterioration Curves; VTRC 17-R7; Virginia Transportation Research Council Charlottesville: Virginia, VA, USA, 2016.
13. Katicha, S.W.; Flintsch, G.W.; Shrestha, S.; Thyagarajan, S. Demonstration of Network Level Structural
Evaluation with Traffic Speed Deflectometer. InFinal Report. Prepared for the Federal Highway Administration; USDOT: Blacksburg, VA, USA, 2017.
14. Shrestha, S.; Katicha, S.W.; Flintsch, G.W.; Thyagarajan, S. Application of Traffic Speed Deflectometer for Network-Level Pavement Management.Transp. Res. Rec.2018. [CrossRef]
15. Rada, G.R.; Nazarian, S.; Visintine, B.A.; Siddharthan, R.; Thyagarajan, S. Pavement Structural Evaluation
at the Network Level. 2016. Available online: https://www.fhwa.dot.gov/publications/research/
infrastructure/pavements/15074/15074.pdf(accessed on 19 May 2018).
16. Hossain, M.; Chowdhury, T.; Chitrapu, S.; Gisi, A.J. Network-level pavement deflection testing and structural evaluation.J. Test. Eval.2000,28, 199–206.
17. AASHTO.AASHTO Guide for Design of Pavement Structures; AASHTO: Washington, DC, USA, 1993; Volume 1.
18. Rohde, G.T. Determining Pavement Structural Number from FWD Testing.Transportation Research Record
1994. Available online:https://trid.trb.org/view/415076(accessed on 19 May 2018).
19. Zhang, Z.; Claros, G.; Manuel, L.; Damnjanovic, I. Evaluation of the pavement structural condition at
network level using Falling Weight Deflectometer (FWD) data. In Proceedings of the 82nd Transportation Research Board meeting, Washington, DC, USA, 12–16 January 2003.
20. Bryce, J.M.; Flintsch, G.W.; Katicha, S.W.; Diefenderfer, B.K. Developing a network-level structural capacity index for asphalt pavements.J. Transp. Eng.2012,139, 123–129. [CrossRef]
21. Zhang, Z.; Manuel, L.; Damnjanovic, I.; Li, Z. Development of a New Methodology for Characterizing
Pavement Structural Condition for Network-level Applications.Texas Dept. of Transportation, Austin, TX
2003. Available online:https://pdfs.semanticscholar.org/6f91/8ac20e5a7f99dca2d50b12eab6a3e750f363.pdf
(accessed on 19 May 2018).
22. Gerber, A.D.; Miller, T.D.; Richardson, M.J.Implementation and Calibration of a Laser Crack Measurement System for the Delaware Department of Transportation’s Pavement Management Program. 2018. Available online: https://trid.trb.org/view/1496710(accessed on 19 May 2018).
23. Rydholm, T.C.; Luhr, D.R. Visualizing pavement management data at the project level. In Proceedings
of the 9th international conference on managing pavement assets (ICMPA9), Washington, DC, USA, 18–21 May 2015.
24. Maser, K.; Schmalzer, P.; Shaw, W.; Carmichael, A. Integration of Traffic Speed Deflectometer and
Ground-Penetrating Radar for Network-Level Roadway Structure Evaluation.Transp. Res. Rec. J. Transp.
Res. Board2017, 55–63. [CrossRef]
25. Tsunokawa, K.; Ul-Islam, R. Pitfalls of HDM-4 strategy analysis. Intern. J. Pavement Eng. 2007,8, 67–77. [CrossRef]
26. Kim, D.Y.; Chi, S.; Kim, J. Selecting Network-Level Project Sections for Sustainable Pavement Management in Texas.Sustainability2018,10, 686. [CrossRef]
27. Chi, S.; Hwang, J.; Arellano, M.; Zhang, Z.; Murphy, M. Development of network-level project screening
methods supporting the 4-year pavement management plan in Texas. J. Manag. Eng. 2012,29, 482–494.
[CrossRef]
28. FHWA.Transportation Asset Management Case Studies; Data Integration: The Virginia Experience; FHWA:
Washington, DC, USA, 2005.
29. Bennett, C.R.; De Solminihac, H.; Chamorro, A.; Flintsch, G.W. Data Collection Technologies for Road
Management. 2006. Available online: https://openknowledge.worldbank.org/handle/10986/11776
(accessed on 19 May 2018).
30. Bonin, G.; Folino, N.; Loprencipe, G.; Oliverio Rossi, G.; Polizzotti, S.; Teltayev, B. Development of a Road Asset Management System in Kazakhstan. In Proceedings of the TIS 2017 International Congress on Transport Infrastructure and Systems, Rome, Italy, 10–12 April 2017; pp. 10–12.
31. Archondo-Callao, R. Applying the HDM-4 Model to Strategic Planning of Road Works. 2008. Available
online:https://openknowledge.worldbank.org/handle/10986/17419(accessed on 19 May 2018).
32. Pavemetrics. Available online:
33. ASTM.ASTM E950/E950M-09, Standard Test Method for Measuring the Longitudinal Profile of Traveled Surfaces with an Accelerometer-Established Inertial Profiling Reference; ASTM International: West Conshohocken, PA, USA, 2018.
34. Zhou, G.; Wang, L.; Wang, D.; Reichle, S. Integration of GIS and data mining technology to enhance the
pavement management decision making.J. Transp. Eng.2009,136, 332–341. [CrossRef]
35. Flintsch, G.W.; Dymond, R.; Collura, J.Pavement Management Applications using Geographic Information Systems; National Academies Press: Washington, DC, USA, 2004; Synthesis 335.
36. ASTM.ASTM E1926-08, Standard Practice for Computing International Roughness Index of Roads from Longitudinal Profile Measurements; ASTM International: West Conshohocken, PA, USA, 2015.
37. Loprencipe, G.; Pantuso, A. A Specified Procedure for Distress Identification and Assessment for Urban
Road Surfaces Based on PCI.Coatings2017,7, 65. [CrossRef]
38. Loprencipe, G.; Pantuso, A.; Mascio, P.D. Sustainable Pavement Management System in Urban Areas
Considering the Vehicle Operating Costs.Sustainability2017,9, 453. [CrossRef]
39. Watanatada, T.The Highway Design and Maintenance Standards Model: User’s Manual for the HDM-III Model;
Johns Hopkins University Press: Baltimore, MD, USA, 1987; Volume 2.
40. Huang, Y.H. Pavement Analysis and Design. 2004. Available online:
https://www.amazon.com/Pavement-Analysis-Design-Yang-Huang/dp/0131424734(accessed on 19 May 2018).
41. Lukanen, E.O.; Stubstad, R.; Briggs, R.Temperature Predictions and Adjustment Factors for Asphalt Pavements; FHWA: Washington, DC, USA, 2000.
© 2019 by the authors. Licensee MDPI, Basel, Switzerland. This article is an open access article distributed under the terms and conditions of the Creative Commons Attribution (CC BY) license (http://creativecommons.org/licenses/by/4.0/).