1
Comparison of The Profitability Performance of BIST Corporate
Governance Index Companies In Turkey
Bengü Vuran
1*, Burcu Adiloğlu
21. Associate Prof., Istanbul University, Avcılar Campus, Faculty of Business Administration, Finance Department, Istanbul, TURKEY.
2. Associate Prof., Istanbul University, Avcılar Campus, Faculty of Business Administration, Accounting Department, Istanbul, TURKEY.
* E-mail of the corresponding author: benguv@istanbul.edu.tr
This work was supported by Scientific Research Projects Coordination Unit of Istanbul University. Project number was 23580.
Abstract
Corporate governance is the system of rules, practices and processes by which a company is directed and controlled. Through appropriate implementation of the principles of corporate governance a company can enhance its financial performance, improve its competitiveness, appreciate its credibility and reputation and increase relations with key stakeholders. Borsa Istanbul (BIST) Corporate Governance Index (XKURY) is composed of listed companies who accomplished a certain level of Corporate Governance Principles. This study investigates the links between profitability performance and good corporate governance practices. It aims to test empirically that if there is a significant difference between the profitability performance of two group of non-financial companies listed in Borsa Istanbul 100 index. Level of performance is assessed by determining the net profit margin, gross profit margin, return on asset, return on equity, return on sales and return on invested capital for the sample of companies. Data are taken from annual reports of the companies in the 2015 and based on a sample of 25 XKURY companies 47 non-XKURY companies listed in Borsa Istanbul 100 index. As a result, the companies who comply better with the corporate governance principles are found to have better profitability performance against the others. It is observed that good corporate governance practices positively influence the efficiency and financial results of business operations.
Key Words: Corporate Governance Index, Borsa Istanbul, Corporate Profitability, Corporate Governance Practices.
1. Introduction
Corporate Governance refers to the structure and processes for the navigation of companies. Good corporate governance contributes to sustainable economic development by enhancing the performance of companies and increasing their access to outside capital. It makes companies more accountable and transparent to investors and gives them the tool to respond to stakeholder concerns. Through appropriate application of the principles of corporate governance a company can have increased access to financing, higher firm valuation, better operational performance, reduced financial risk and better relations with other stakeholders.
The universal principles of corporate governance are fairness, accountability, transparency and responsibility. The principles consist of four main sections namely shareholders, disclosure and transparency, stakeholders and board of directors. Corporate Governance Rating is a score on relative standing of an entity with regard to adoption of corporate governance practices also provides information to stakeholders about the level of corporate governance practices of the entity.
Turkish companies have been appraising its corporate governance system; fairness, efficiency, transparency and accountability for several years. In Borsa Istanbul, Corporate Governance Index (XKURY) have been launched in
2
August 2007 and the index is composed of listed companies who accomplished a certain level of Corporate Governance Principles. XKURY aims to measure the price and return performances of companies traded in BIST Markets. The level of implementation of corporate governance is expected to be higher for the companies listed in corporate governance index. In this study, the positive relationship between better compliance with corporate governance principles and corporate profitability has been analyzed by comparing the corporate profitability ratios of Corporate Governance Index (XKURY) and BIST 100 Index companies. And also the relationship between corporate governance rating score and firm profitability of XKURY index companies is tested for the year 2015.
The paper is organized as follows: In the next section a review of literature will be presented. Section III explains the research objectives, data and methodology. Section IV gives the results of the study and section V concludes.
2. Literature
A large number of studies have examined the relationship between corporate governance and corporate financial performance.
Reddy et al. (2008) examine the effect of corporate governance practices on financial performances of small cap companies. The data for 71 small cap companies listed in New Zealand over a five-year period from 2001 to 2005 is analyzed. Pooled data, OLS and 2SLS regression techniques are used and Tobin’s Q, ROA and Operating Income are used as the dependent variables. The findings support the hypothesis that the existence of board independence and audit committee has enhanced firm financial performance.
Gürbüz et al. (2010) perform a study to investigate whether firms’ corporate governance practices lead to better financial performance in Turkey. The findings of the study support the argument that corporate governance practices enhance firm financial performance. The second aim of their study is to determine whether companies engaging in corporate governance practices outperform others. They conclude that companies listed on the Corporate Governance Index outperform those not listed in 2007. However, for the years 2005 and 2006, noncorporate governance index companies are the outperformers.
Al- Haddad et al. (2011) investigate the relationship between corporate governance and firm performance of Jordanian industrial companies listed in Amman Stock Exchange. They find that there is a direct positive relationship between profitability -measured either by Earnings per share (EPS) or Return on assets (ROA) - and corporate governance, and a positive direct relationship between each of liquidity, dividend per share, and the size of the company with corporate governance, also they ascertain a positive direct relationship between corporate governance and corporate performance.
Aggarwal (2013) performs a research on 50 Indian companies listed on S&P CNX Nifty 50 Index to study the relationship between corporate governance and corporate profitability. It is interpreted that governance rating has a positive but insignificant impact on corporate profitability and also corporate profitability has an insignificant positive impact on governance ratings of firm.
Todorović (2013) assesses the level of implementation of corporate governance in companies which are listed on Banja Luka Stock Exchange and Vienna Stock Exchange. The level of performance is determined by net profit margin and earnings per share variables. It is concluded that companies which are listed in Banja Luka Stock Exchange have lower level of implementation and compliance with principles of corporate governance, lower net profit margin and earnings per share than companies from Vienna Stock Exchange.
Amba (2014) examines the impact of corporate governance variables on financial performance of companies listed in Bahrain Stock Exchange. Multiple regression analysis is employed to test the relationship between financial performance measure. ROA is served as a proxy for firms’ financial performance. CEO duality, proportion of non-executive directors and leverage are found to be negative but board member as chair of audit committee, proportion of institutional ownership are found to be positive influence on financial performance of firms.
Adekunle and Aghedo (2014) examine the relationship between corporate governance and financial performance of randomly selected quoted firms in Nigeria. They investigate corporate governance variables (composition of board member, board size, CEO status and ownership concentration) and analyses whether they impact on firm performance as measured by return on asset and profit margin. Findings of the study reveal that there is positive and significant relationship between composition of board member and board size as independent variables and
3
firm performance. CEO status also has positive relationship with firm performance but insignificant. However, ownership concentration has negative relationships with return on asset but positive relationship with profit margin.
Ararat et al. (2016) study the corporate governance practices of Turkish public firms from 2006 to 2012 covering the vast majority of listed firms. They construct a broad Turkey Corporate Governance Index (TCGI) which is composed of subindices for board structure, board procedure, disclosure, ownership, and shareholder rights. TCGI predicts higher market value and higher firm-level profitability with firm random effects. Their findings reveal that a strong association between governance and firm market value in a comprehensive sample of Turkish listed firms.
3.Research Objectives, Data and Methodology
This study has two objectives. The first objective is to investigate whether the companies listed in corporate governance index (which are properly implementing corporate governance principles) make difference in terms of profitability performance as compared to BIST 100 companies for the year 2015. To analyze this, following hypotheses are formed:
H0: There is no significant difference between the means of profitability ratios of two groups 1 = 2
H1: There is significant difference between the means of profitability ratios of two groups
The second objective is to assess the impact of corporate profitability on the governance rating of the firm. In order to test this relationship, the regression equation formed for corporate governance index companies is as follows:
GOVi = a + b1.ROAi +b2.ROEi + b3. ROSi + b4. ROICi + b5. NPMi + b6. GPMi
Thus, the dependent variable of the model is governance rating of company (GOV) and corporate profitability measures - Return on Asset (ROA), Return on Equity (ROE), Return on Sales (ROS), Return on Invested Capital (ROIC), Gross Profit Margin (GPM) and Net Profit Margin (NPM) are used as independent variables of the model. The calculation of the variables are given in Table 1.
Table 1: Calculation of Variables
ROA ROE ROS ROIC GPM NPM
The corporate profitability data is calculated using the financial statements of companies. Financial statements are gatheredfrom “www.kap.gov.tr” website. The governance ratings are obtained from the companies corporate governance rating reports which are available in their websites. The overall corporate governance rating is calculated to evaluate and rate the companies' compliance with the corporate governance principles of Turkey. BIST 100 index is used as a main indicator of the national market. BIST 100 index constitutes 100 mostly traded companies with the highest market capitilization in Borsa Istanbul. XUKRY index has 50 companies and those companies are also listed in BIST 100 index. Financial companies are excluded from the sample size. Outliers (unusually high or low values) are also eliminated and finally the sample size constitutes of 25 companies for XUKRY and 47 for BIST 100 index.
4
4. Results
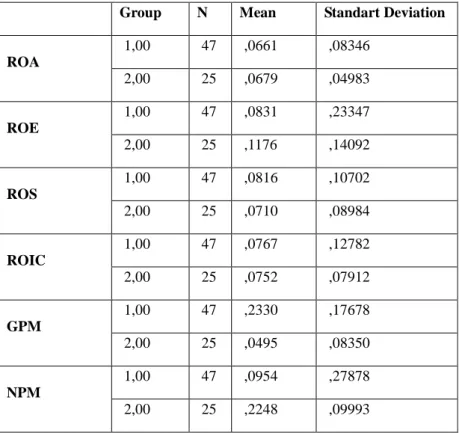
The descriptive statistics for the variables of two groups are given in Table 2. Group 1 and Group 2 represent BIST 100 and XUKRY companies respectively.
Table 2: Group Descriptive Statistics
Group N Mean Standart Deviation
ROA 1,00 47 ,0661 ,08346 2,00 25 ,0679 ,04983 ROE 1,00 47 ,0831 ,23347 2,00 25 ,1176 ,14092 ROS 1,00 47 ,0816 ,10702 2,00 25 ,0710 ,08984 ROIC 1,00 47 ,0767 ,12782 2,00 25 ,0752 ,07912 GPM 1,00 47 ,2330 ,17678 2,00 25 ,0495 ,08350 NPM 1,00 47 ,0954 ,27878 2,00 25 ,2248 ,09993
In order to test the first objective; independent sample t-test is applied using SPSS 21. The results of this test is given in Table 2. First of all, the assumption of homogenity of variances has been investigated. The hypotheses formed to test the homogenity of variances are given below.
Ho: σ12 = σ22
H1 : σ12 ≠ σ22
As seen in Table 3, according to result of Levene Test, p value greater than 5 % indicates the validity of the assumption meaning that group variances are equal thus,
conducting the parametri c analysis is appropriate.
Then t-test for equality of means is applied. The hypo theses formed are given below. Ho: μ1 = μ2
5
Table 3: Results of Independent Sample Test
Levene's Test for Equality of
Variances t-test for Equality of Means F Sig. t df Sig. ( 2 tailed ) Mean Difference Std. Error Difference ROA Equal variances assumed 2,530 ,116 -,102 70 ,919 -,00186 ,01824 Equal variances not assumed -,118 68,958 ,906 -,00186 ,01573 ROE Equal variances assumed 1,670 ,201 -,674 70 ,503 -,03445 ,05111 Equal variances not assumed -,779 68,763 ,438 -,03445 ,04421 ROS Equal variances assumed 1,873 ,176 ,422 70 ,674 ,01060 ,02511 Equal variances not assumed ,445 56,970 ,658 ,01060 ,02380 ROIC Equal variances assumed 2,040 ,158 ,054 70 ,957 ,00150 ,02810 Equal variances not assumed ,062 68,256 ,951 ,00150 ,02445 GPM Equal variances assumed 2,962 ,090 4,894 70 ,000 ,18342 ,03748 Equal variances not assumed 5,970 69,310 ,000 ,18342 ,03072 NPM Equal variances assumed 1,822 ,181 -2,239 70 ,028 -,12938 ,05779 Equal variances not assumed -2,855 63,776 ,006 -,12938 ,04531
According to t-test results; H0 is accepted for ROA, ROE, ROS and ROIC variables meaning that; there is no
significant difference between the mean values of two groups, whereas H0 is rejected for GPM and NPM
variables implying that significant difference is observed between the mean of the two groups.
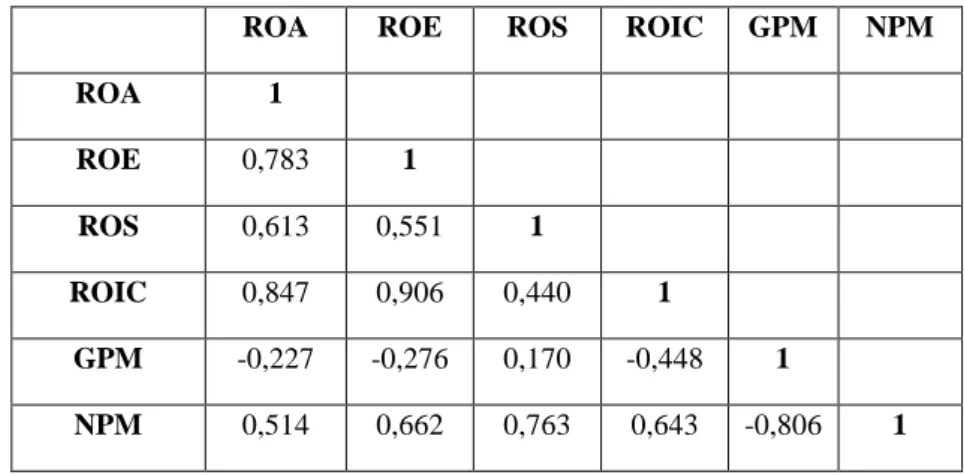
For the second objective; regression analysis is conducted to test the relationship between corporate governance rating score and firm profitability in Turkey for the year 2015. The correlation coefficients calculated are presented in Table 4.
6
Table 4: The correlation matrix for the variables of XKRUY Companies
ROA ROE ROS ROIC GPM NPM
ROA 1 ROE 0,783 1 ROS 0,613 0,551 1 ROIC 0,847 0,906 0,440 1 GPM -0,227 -0,276 0,170 -0,448 1 NPM 0,514 0,662 0,763 0,643 -0,806 1
As seen in Table 4, since most of the variables are highly correlated, in order to eliminate the multicollinearity stepwise regression is applied. SPSS generates three tables of output for linear regression. The results of the regression analysis are given in Table 5,6 and 7.
Table 5: Model Summary
Model R R Square Adjusted R Square Std. Error of the Estimate
1 0,676 0,457 0,433 0,23442
Table 5 provides the R and R2 values. The R value represents the simple correlation and is 0,676 which indicates a high degree of correlation. The R2 value indicates how much of the total variation in the dependent variable, can be explained by the independent variable. The next table is the ANOVA table, which reports how well the regression equation fits the data and is shown in Table 6. The linear regression's F -test has the null hypothesis that there is no linear relationship betw een the variables. The F -test is highl y significant (p < 0.05) and indicates that the regression model statistically significantly predicts the outcome variable.
Table 6: Anova Results
Sum of Squares df Mean Square F Sig.
Model Regression 1,062 1 1,062 19,333 0,000
1 Residual 1,264 23 0,055
Total 2,326 24
Table 7: Stepwise Regression Results
Model Unstandardized Coefficients Standardized Coefficients
t Sig.
B Std. Error
1 Constant 9,072 0,060 150,614 0,000
7
Table 7 shows the multiple linear regression estimates including the intercept and the significance levels. According to regression results, the regression equation can be formed as below:
GOVi = 9,072 + 2,342 ROSi
5.Conclusions
The objective of this paper is to investigate the relationship between the implementation of corporate governance practices and corporate profitability. This paper constitutes two empirical models. First one is used to question that whether firms engaging corporate governance implementations, those listed in XUKRY index, have higher profitability performance in Turkey. On behalf of this purpose t-test for independent samples which helps to compare whether two groups have statistically different mean values has been applied. Results indicate that companies engaging in corporate governance practices outperform those non-listed in terms of profitability in the year 2015.
The second model has been designed to analyze the impact of corporate profitability on the corporate governance rating of the company. The sample of the study only incorporates the companies which are listed in corporate governance index. Six measures of corporate profitability have been employed: Return on Assets (ROA), Return on Equity (ROE), Return on Invested Capital (ROIC), Return on Sales (ROS), Net Profit Margin (NPM) and Gross Profit Margin(GPM). Regression analysis results reveal that ROS ratio is found to be significant explanatory variable and 45.7 % of variability in corporate governance rating is explained by the linear relationship of ROS ratio of the company.
This study provides empirical evidence that the companies with higher level of implementation of corporate governance practices have better profitability performance for the year 2015 in Turkey.
The results also provide some support for motivation for the implementation of good governance practices, and provide explicit evidence that the measure of gross and net profit performance of corporate governance index companies outperform those not listed in governance index.
For further research, the number of years observed can be increased and this enables to apply panel data model in which the performance of entities are observed across time and which extends the research to longer periods.
References
Adekunle, S.A., Aghedo,E. M., (2014). Corporate Governance and Financial Performance of Selected Quoted Companies in Nigeria. European Journal of Business and Management, Vol.6, No.9,53-60, ISSN 2222-1905
(Paper) ISSN 2222-2839 (Online). Aggarwal, P.,(2013).Corporate Governance and Corporate Profitability: Are They Related?- A Study in Indian
Context. International Journal of Scientific and Research Publications, Vol.3, Issue 12, 1-8. ISSN 2250-3153 Amba, Sekhar, M. (2014). Corporate Governance and Firms’ Financial Performance. Bahrain, Journal of Academic and Business Ethics, Vol.8, July,1-11.
Al-Haddad, M., W. Y., Alzurqan, S.T., Al Sufy,J.F. (2011).The Effect of Corporate Governance on the Performance of Jordanian Industrial Companies: An empirical study on Amman Stock Exchange. International Journal of Humanities and Social Science, Vol.1 No.4.,55-69.
Ararat,M., Black,B., Yurtoğlu, B.B. (2013). The Effect of Corporate Governance on Firm Value and Profitability: Time-Series Evidence from Turkey.ECGI - Finance Working Paper,Northwestern Law & Econ Research Paper
No. 13-19. https://papers.ssrn.com/sol3/papers.cfm?abstract_id=2703715
Gürbüz A. O., Aybars, A., Kutlu, Ö. (2010), “Corporate Governance and Financial Performance with a Perspective on Institutional Ownership: Empirical Evidence from Turkey”, Journal of Applied Management Accounting Research, Vol. 8 No 2, 21-37.
Reddy, K., Locke, S., Scrimgeour, F., Gunasekarage, A., (2008). Corporate governance practices of small cap companies and their financial performance: An empirical study in New Zealand. International Journal of Business Governance and Ethics, Vol 4, No:1, 51–77.
Todorović, I. (2013). Impact of Corporate Governance on Performance of Companies, Montenegrin Journal of Economics, Vol 9, No.2, Special Issue, May 2013, 47-53.