KATHOLIEKE UNIVERSITEIT LEUVEN
OEPARTEMENT TOEGEPASTE
ECONOMISCHE WETENSCHAPPEN
RESEARCH REPORT 0240EVIDENCE ON (THE LACK OF) AUDIT -QUALITY DIFFERENTIATION IN THE PRIVATE CLIENT SEGMENT OF THE BELGIAN AUDIT MARKET
by
H. VANDER BAUWHEDE M. WILLE KENS
Evidence on (the lack of) audit-quality differentiation in the private client segment of the Belgian audit market
Heidi VanderBauwhede Catholic University of Leuven heidi.vanderbauwhede@econ.kuleuven.ac.be
and
Marleen Willekensn Catholic University of Leuven marleen.willekens@econ.kuleuven.ac.be
Version August 2002
We gratefully acknowledge the comments of the following persons on previous versions of this paper: Jere Francis, Ann Gaeremynck, Parveen Gupta, Axel Haller, Claus Holm, Christopher Humphrey, Niclas Hellman, Robert Knechel, Piet Sercu, Martina Vandebroek, Staf Van Herck, Laurence van Lent, Stefan Sundgren, participants at the 2001 congress of the European Accounting Association in Athens (Greece), participants at the 2001 Workshop on the Future of Audit Assurance and the Profession in Copenhagen (Denmark) and participants at the 2001 Euroconference on Financial Reporting and Regulatory Practices in Europe in Palermo (Italy). Any remaining imperfections remain the full responsibility of the authors.
n Heidi VanderBauwhede is postdoctoral researcher and Marleen Willekens is associate professor of Accounting, both at the Catholic University of Leuven. The authors are listed alphabethically.
Evidence on (the lack of) aUdit-quality differentiation in the private client segment of the Belgian audit market
ABSTRACT
This paper contributes to the empirical audit-quality literature and provides evidence on (the lack of) audit-quality differentiation in the private client segment of the Belgian audit market. Auditor size is used as audit-quality proxy. Prior evidence on audit-quality differentiation between big Sand non-big S auditors in the private client segment of the Belgian audit market is mixed. In this paper we investigate whether these mixed results stem from the inability of the dichotomous BigS/non-BigS variable to capture auditor-size differences in a less concentrated audit market. To that end we examine whether alternative continuous measures of audit-firm size (i.e. auditor market share, number of audit-firm clients, number of partners in the audit firm, total assets and operating profit of the audit firm) have a constraining impact on earnings management in a large sample of privately held Belgian companies (n = 1302). Overall, we do not find evidence that is supportive of quality differentiation in the private client segment of the Belgian audit market.
1. Introduction
DeAngelo (1981) argues that audit quality can be proxied by audit-firm size. Her argument can be summarized as follows. Auditors suffer reputational damage if supply of below-standard audit services is revealed. As this may lead to the loss of clients and/or reduced future audit fees, auditors will want to avoid bad publicity regarding their services. The larger an audit firm, the more it has at stake when its reputation is impaired. Consequently larger audit firms have a greater incentive to maintain a certain level of audit quality as compared to smaller audit firms. Following this size argument, prior studies have used the dichotomous Big6 (now Big41) / non-Big6 variable as a proxy for audit-firm size and thus audit quality, and as such provide evidence of product differentiation in various national audit markets. Where such an approach may be appropriate in environments where audit supply concentration is huge, it may be inappropriate in less concentrated markets. In this paper, we test alternative continuous auditor size variables as proxies for audit quality instead of focusing on the dichotomous big6/non-big 6 variable. We adopt this research design to test whether there is quality-differentiation in the private client segment of the Belgian audit market where audit supply concentration is far less pronounced than in Anglo-American economies. As listed companies are far less dominant (both in number and in size) in various continental European economies, further investigation of the audit-quality issue in the private client segment of the audit market is warranted.
Most Anglo-American studies of audit-quality differentiation were performed on samples of publicly held companies, and indeed report quality differences between Big 6 and non-Big 6 firms. For example, Big 6 firms charge higher fees (see for example, Simunic 1980; Francis and Simon 1987; Craswell et al. 1995), are more likely to issue non-clean audit opinions (see for example, Mutchler et al. 1996) and constrain earnings management more than non-big 6 firms (Francis et al. 1999, Becker et al. 1998). However, evidence of audit-quality differentiation between Big6 and non-Big6 auditors on samples of privately held Belgian firm data is mixed. First, as to audit pricing, Willekens and Achmadi (2002) report fee premia for Big 6 auditors. This could point in the direction of quality differences. They further report a significant decrease of these premia during the 1990s. Second, Gaeremynck and Willekens (2002) find that there are
no
differences as to audit reporting between big 6 and non-big 6 audit firms when problems in client firms are very obvious, but do find more stringent reporting by big 6 auditors when the problems in client firms are more subtle. Finally, the evidence from Belgian earnings management studies is little supportive of quality differences between big 6 and non-Big 6 firms. Based on a sample of individual financial statements2 issued by privately held Belgian firms, Sercu, Vander Bauwhede and Willekens (2002) do not find that Big 6 auditors constrain earnings management more than non-Big 6 auditors. Based on a sample of1 We continue to use the Big6/ non-Big6 terminology throughout this paper because our
empirical data relate to the time period before the merger between Price Waterhouse and Coopers and Lybrand in 1997, and the collapse of Andersen in 2002.
2 Individual financial statements are typically tax driven in Belgium, as taxes are raised on the individual company level, but no separate set of (non-consolidated) financial statements are issued for tax purposes.
consolidated financial statements3 issued by the largest private Belgian companies, VanderBauwhede, Willekens and Gaeremynck (2001) find that big 6 auditors constrain income-decreasing earnings management more than non-big 6 auditors, but they do not find evidence that they constrain income-increasing earnings management more.
In this paper we contribute to the empirical audit-quality literature in at least two ways. First, we test whether there is audit-quality differentiation in the private client segment of the Belgian audit market. We do not find corroborative evidence of quality differentiation based on auditor-size differences. Second, we investigate whether the prior mixed results on quality differentiation between auditors in Belgium stem from the inability of the dichotomous Big6/non-Big6 variable to capture auditor-size differences (and thus quality differences, DeAngelo 1981) in the Belgian audit market. The alternative proxies for audit-firm size tested in this study include audit-firm market share, number of clients, number of audit-firm partners, total audit-firm assets and operating profit. Finally we also contribute to the earnings management literature as we use the extent of discretionary accruals management as the dependent variable in our analyses.
The remainder of the paper is organized as follows. In the next section we briefly discuss the Belgian audit environment. We develop our research questions in Section 3, and introduce our empirical model in Section 4. In section 5 we present our sample and data and discuss the descriptive
3 Consolidated financial statements are supposed not to be tax driven, as it is required by
Belgian Law to undo accounting choices that are tax driven in individual financial statements when the statements are consolidated.
statistics on various audit-firm size measures. We present our results in section 6. We conclude with a summary and discussion.
2. The Belgian Audit Environment
The vast majority of Belgian companies are privately held and family-owned. Less than 150 companies are listed relative to about a quarter of a million Belgian companies that file financial statements with the Belgian National Bank. The number of Belgian listed companies per one million inhabitants amounts to 15.5 as compared to 35.6 in the UK and 30.1 in the US, and the ratio of market capitalization to GOP is only 38 percent in Belgium as compared to 123 percent in the UK and 82 percent in the US.
Both publicly held as well as privately held companies that meet certain legal form and size criteria are mandated to file financial statements with the Belgian National Bank. Belgian companies only submit one set of individual accounts for both financial reporting and tax purposes. As taxes are raised on the individual company level, but no separate set of (non-consolidated) financial statements are issued for tax purposes in Belgium, the accounting choices in individual company accounts are typically tax driven.
External auditing is mandatory for all large (publicly held and privately held) companies in Belgium4 • The regulator's motivation for such a
4 Large companies are companies which meet at least two of the following criteria: Total assets> 3,125,000 Euro; Turnover> 6,250,000 Euro, number of employees> 50. Companies with more than 100 employees are always classified as a large company irrespective of their total assets or turnover and hence always have to appoint an independent auditor.
widespread mandatory audit requirement is protection of a/l stakeholders of a company. Stakeholders other than investors, such as bankers, suppliers, employees and tax authorities, are indeed the main users of financial statements issued by privately held Belgian companies. As to the audit environment, a notable difference with Anglo-Saxon environments is the lack of auditor litigation in Belgium. In litigious environments the threat of litigation works as a deterrent against below-standard audit quality. When such a threat is absent the auditor may feel tempted to keep a friendly relationship with his client in order to safeguard the appointment, and thus be tempted not to constrain earnings management and/or issue a qualified opinion when necessary.
Big4/6 market concentration is quite low in Belgium compared to Anglo-Saxon and other European countries (see Willekens and Achmadi 2002, Weets and Jegers 1997, Schaen and Maijoor 1997). For example, in the public client segment of the Anglo-Saxon audit market Big 4/6 audit firms typically have about 90-95% (or more) of the market share, whereas Big 4/6 audit firms only have about 50% of the market share in Belgium. In the private client segment of the Belgian audit market this is even lower, namely one third (VanderBauwhede and Willekens 2001).
3. Research Questions
R01: Is there audit-quality differentiation in the private client segment of the Belgian audit market?
We follow DeAngelo's (1981) argument that audit quality can be proxied by audit-firm size. As argued in the introduction, the underlying rationale is that larger auditors have more to lose if an audit failure is detected, and therefore have incentives to supply higher audit quality. However, the probability that an audit failure is detected is much lower when privately held Belgian firms are audited. First, the financial statements of privately held firms are not scrutinized by investors, financial analysts and market regulators (such as the Commission for Banking and Finance in Belgium or the Securities and Exchange Commission in the US), as they are only used and scrutinized by other stakeholders such as bankers, suppliers, employees and tax authorities. Second, there is almost no litigation against auditors in Belgium. Note that there have only been eight court cases against auditors since the foundation of the Belgian Kingdom in 1831 (Aerts 2002). In Anglo-Saxon environments litigation is a mechanism to enforce compliance with auditing standards and regulations (see also section 2). However, there exist various alternative quality enforcement mechanisms, including the three-year auditor tenure rules, disciplinary sanctions imposed by the Belgian Institute of Auditors after violation of the Ethical code7, directed investigations and peer reviews organized by the Belgian Institute of Auditors.
Note that the lack of incentives to supply higher quality-services may also stem from the lack of demand for quality-differentiated audits in a
6 In Belgium, auditors are tenured for periods of three years; this requirement is set to
promote auditor independence as the opportunity for firms to dismiss their auditor after a non-clean audit opinion is reduced.
privately held firm context.s In a typical publicly held firm context, economic demand for quality-differentiated audit services is mainly attributable to agency and information asymmetry problems caused by the separation between ownership and control. However, those agency and information asymmetry problems are less pronounced in a privately held firm context, where the owner is often the manager. Given the discussion above, it is ex ante not clear whether audit-quality differences are to be expected in the private client segment of the Belgian audit market.
RQ2: Are continuous measures of audit-firm size better proxies of audit quality in the private client segment of the Belgian audit market, as compared to the dichotomous Big61 non-Big6 variable?
Current Belgian evidence on audit-quality differentiation in the private client segment of the audit market is mixed (see section 1). While this may be attributable to institutional characteristics (as discussed in the above paragraphs), it may also be that the size proxy used to capture audit-quality differences in prior studies is not suitable in the context of Belgian privately held audit clients. Indeed, the dichotomous BigS/non-BigS variable used in all prior Belgian studies may not be appropriate as non-Big6 auditors are important players in the Belgian audit market. Note that the market share of the Big6 in the private client segment of the Belgian audit market is only about 37 percent (VanderBauwhede and Willekens 2001), and that non-Big6
7 During the period 1990-1999 126 disciplinary cases against auditors were initiated relative
to an average number of certified auditors of 800 in that period. In about 66 percent of those cases auditors were indeed sanctioned.
auditors are in the top 6 of largest audit firms in Belgium. As a consequence it may well be that quality differences between larger and smaller auditors may not be captured by using the dichotomous Big6/ non-Big6 variable. Such a classification would put a large (and potentially higher-quality) but non-big6 auditor in the same group as small (and hypothesized lower quality) auditors. It is therefore appropriate to test alternative
continuous
measures of audit-firm size as they may be better proxies of size and hence audit-quality differences in the private client segment of the Belgian audit market.4. Model Specification and Variable Measurement
We estimated the following multiple regression model (using OLS) to examine our research questions:
Where:
IDACit! = the absolute value of estimated (cf. Infra) discretionary accruals scaled by lagged total assets for firm i in year t; AUDITORit = a measure of audit-firm size of firm i in year t;
(1) ,
FDEBTTAit = ratio of total financial debt over total assets for firm i in year t;
DFDEBTit = a dummy variable that takes value 1 if there is an increase in financial debt for firm i in year t in the year after the year under study, 0 otherwise;
CDEBTTAit = ratio of accounts payable over total assets for firm i in year t; = extent to which firm i depends on implicit contracts with employees, measured by a dummy that takes 1 if firm has more than 100 employees and 0 otherwise;
TAXit
=
a dummy variable that indicates whether firm i has tax-loss carry-forwards in year t10 or not;ABOCFit = absolute value of cash flow from operations scaled by lagged total assets for firm i in year t;
A measure of earnings management, in particular a measure of discretionary accruals, is the dependent variable in our model. We chose this variable for our study as prior earnings management studies (Francis et al. 1999, Becker et al. 1998) have shown that auditor-size (and hence quality) differences indeed affect the level of discretionary accruals (by listed American firms). In particular, big 6 auditors seem to constrain earnings management more than non-big 6 auditors, and therefore are deemed to provide higher quality. The independent variables in our model are then a proxy for audit-firm size (the test variable AUDITORit) and various proxies for the incentives for earnings management by privately held Belgian companies (the control variables).
10 Whether a firm actually has tax-loss carry-forwards is not observable. We proxy the
existence of tax-loss carry-forwards by whether firms paid taxes in the prior year (that is, no tax-loss carry-forwards) or not (that is, tax-loss carry-forwards).
4.1 Discretionary accruals
We measure earnings management through discretionary accruals. We estimated discretionary accruals by using the discretionary accruals model of Sercu, VanderBauwhede and Willekens (2002):
TACSijt = ~Ojt+ ~1jtGPPESjt + ~2jt ADJREVSjt + ~3jt DOCFSijt
Where: TACSijt
+ ~4jt LAGT ACSijt + Ejt (2)
= total accruals (computed as working capital accruals minus depreciation) scaled by lagged total assets for firm i in industry j
and year t;
GPPESijt = gross property plant and equipment scaled by lagged total assets for firm i in industry j in year t;
ADJREVSijt = change in revenues minus change in receivables scaled by lagged total assets for firm i in industry j in year t;
DOCFSijt
=
change in operating cash flow scaled by lagged total assets for firm i in industry j in year t;LAGTACSijt = lagged total accruals scaled by lagged total assets for firm i in industry j in year t.
We first obtained industry- and year-specific regression coefficients by using industry- and year-specific estimation portfolios of firm-years that are not included in our random sample of privately held companies. We then use the
estimated coefficients to derive non-discretionary accruals for our random sample of companies. Discretionary accruals are then computed by deducting estimated non-discretionary accruals from the total accruals reported by those companies. Following Reynolds and Francis (2001), we use the absolute value of discretionary accruals as our measure of the extent of earnings management, because this measure allows us to examine the impact of audit quality on both income-increasing (positive discretionary accruals) as well as income-decreasing (negative discretionary accruals) earnings management. Both types of earnings management can be detrimental to stakeholders.
4.2 Test variables
Table 1 gives an overview of the explanatory variables in our multiple regression models. AUDITORIt is the test variable and we proxy it by various measures of audit-firm size (DeAngelo 1981). We first introduce the popular dichotomous Big6/non-Big6 variable (BIG61t), but rather focus on the following alternative continuous measures of audit-firm size, i.e. auditor market share, number of clients, number of partners in the audit firm, total assets of the audit firm, and operating profit of the audit firm. The measurement of the alternative variables of audit-firm size is as follows:
Auditor market share (SHARElt). Auditor market shares were based on the
percentage of assignments" of an auditor in our sample. We preferred the number of assignments to alternative size measures, such as total client assets or sales, because our measure is based on a random sample of client firms. Therefore, any use of a weighted measure of auditor market share (for example market shares based on total client assets or client sales) may be biased when the largest clients are not included in our sample. Also using the number of assignments is supported by the fact that the expertise and competence acquainted during audits may rather depend on the number of different clients audited, than the size of those clients (in terms of total assets, or sales). Note also that Weets and Jegers (1997) found a high Spearman rank correlation between concentration ratios based on the number of clients on the one hand, and based on clients' sales and client total assets on the other hand.
Number of clients (NUMlt). This is the number of all assignments for the
auditors in our sample.
Number of partners (PARTNERSlt). As the number of partners may increase
in the audit firm's market share, we use it as an alternative measures of audit-firm size. We counted the number of partners of each audit audit-firm as reported in the Membership List of the Belgian Institute of Auditors (I.B.R.) for the year 1995. We then extrapolated these findings for to the years 1994 and 1996,
since we do not expect drastic changes in the number partners of an audit firm in adjacent years.
Total assets (LNTAIt) and total operating profit (LNOPIt). Total assets and
sales are frequently used measures of firm size in empirical research. As sales (audit fees received) are not reported by most audit firms and clients are not mandated to report fees paid to their auditors either, we used firm operating profit. Note that we include the natura/logarithm of the audit-firm total assets and operating profit in our model, as our model was otherwise not estimable due to linear dependence in the explanatory variables.
We estimate six different models, namely the models A through F. Those models only differ in the proxy for audit-firm size. Should higher-quality (larger) auditors constrain the extent of earnings management in client financial statements more, as is the case in a public-firmlAnglo-Saxon context, a significant negative coefficient on our various audit-firm size variables is to be found (research question 1). If the coefficients on our continuous measures of audit-firm size are more significant than the coefficient on the dichotomous variable Big6/non-Big6 auditor, our evidence supports the second research question.
4.3 Control variables
We also need to control for incentives for and additional constraints on earnings management. In privately held firms, incentives for and constraints
on earnings management mainly stem from their relations with stakeholders other than investors, namely bankers, suppliers, employees and tax authorities (VanderBauwhede and Willekens 2001)12 Bank financing and trade credit are important sources of external financing for privately held companies which have by definition no access to public equity financing. We therefore include the ratio of financial debt to total assets (FDEBTTA) and a dummy for whether there was an ex post increase in debt financing (DFDEBT) as proxies for the extent to which privately held Belgian firms rely on debt financing. We include the ratio of trade credit to total assets (CDEBTTA) as a measure of a company's relationship with trade creditors. Further, Belgian firms that have more than 100 employees are obliged to submit economic and financial information to a works council. Auditors are required to explain this information to the works council. In companies with a works council, employees are important users of the financial statements (Lefebvre et al. 1995). We therefore include a dichotomous variable (EMPL) which takes the value of one (EMPL=1) if the firms has more than 100 employees (and so is mandated to install a works council) and zero otherwise (EMPL=O). Note that we follow Sercu et al.'s (2002) argument that it is an empirical question whether relations with banks, trade creditors and employees work as an incentive or rather as a constraint on earnings management.
12 Results of the Vander Bauwhede and Willekens (2001) show that tax is only one of the incentives for earnings management in individual financial statements by privately held firms, in addition to incentives provided by other stakeholders such as external financiers. We do not expect an impact of tax incentives on earnings management in consolidated financial statements since Belgian consolidation law requires that any tax-induced accounting choice in individual financial statements be reversed in consolidated financial statements.
Also, in Belgium the reported earnings in individual financial statements are used for tax assessment. Hence, privately held Belgian companies have strong incentives to manage the earnings number in individual financial statements for tax reasons. We proxy a firm's incentive to manage earnings in individual financial statements for tax reasons by whether a firm has tax-loss carry-forwards or not. Since it is not publicly observable whether a firm has tax-loss carry-forwards or not, we proxied the existence of such tax-loss carry-forwards by whether a firm paid taxes in the prior year (no tax-loss carry-forwards - TAX=1) or not (tax-loss carry-forwards - TAX=O). Finally, we include the absolute value of cash flow from operations to control for potential misspecification that may occur in tests of earnings management for firms with extreme financial performance (Dechow et al.
1995).
5. Sample and Descriptive Statistics
We used the random sample (n = 1302) of privately held Belgian industrial and commercial companies as described in Sercu, VanderBauwhede and Willekens (2002). We collected additional data on the size of the 146 different audit firms that audited the client companies in this sample. These data came from 1) the Membership List of the Belgian Institute of Auditors (number of partners), 2) the audit firms' financial statements which are available from the Belfirst CD-Rom13 (total assets and operating profit), and 3) the CD-Rom of the National Bank of Belgium14 (total number of clients).
13 The Belfirst is a CD-Rom issued by Bureau van Dijck and contains the financial statements
Table 2, panel A presents the descriptive statistics of our continuous measures of audit-firm size and shows that our sample firm years are audited by 146 different auditors. Since the number of client firms in our sample is not constant across sample years, the number of audit firms differs across years too. All Big6 audit firms are included in 1994, 1995 and 1996 and thus the difference in the number of auditors across sample years is due to differences in the number of non-Big6 auditors. This leads to higher ratios of non-Big6 auditors in years with more audit firms. In addition, the audit-firm characteristics are highly skewed, with greater values for the Big6. A consequence is that the mean and median values of our audit-firm characteristics are smaller in years with more auditors in our sample.
We further observe from Table 2, panel A that over 95 percent of the audit firms have market shares of less than 1 percent. The largest audit firm has a market share of about 10 percent. Thus, no single auditor seems to dominate the Belgian audit market. The number of clients per audit firm ranges from 1 to 1263, 1307 and 957 for the years 1994, 1995 and 1996 respectivel/5 • The median number of partners per audit firm is 1, and 95
submit their financial statements with the National Bank. The financial statements are subject to various arithmetical and logical controls.
14 The CD-Rom issued by the National Bank is similar to the Belfirst CD-Rom. In contrast to the Belfirst CD-Rom, it also contains information on the number of clients of audit firms over the years 1 994-1996.
15 Data based on all firms that submitted financial statements with the Belgian National Bank. Note that the number of mandates per auditors is generally lower for 1996. This is likely due to the fact that not all firms already submitted their financial statements with the National Bank at the date the 1996 CD-Rom was made. The figures give though an indication of the ranking of the major audit firms, under the assumption that the firms that submit their financial statements later than the the moment at which the CD-Rom was made, are randomly distributed across audit firms.
percent of the audit firms have less than three partners. One audit firm has as much as 49 partners. The total assets of the audit firms range from 1.3, 1.8 and 1.7 million BEF to 0.9, 0.8 and 0.9 billion BEF for the years 1994, 1995 and 1996 respectively. The audit firms' operating income range from operating losses of 0.9, 1.9 and 2.5 million BEF to operating profits of 0.2; 0.16 and 0.13 billion BEF for the years 1994, 1995 and 1996 respectively.
Table 3 shows that our measures of audit firm size are highly and significantly correlated. Pearson correlation coefficients range from 0.54 to 0.96 with p-values smaller than 0.0001.
[Insert Table 2 about here]
[Insert Table 3 about here]
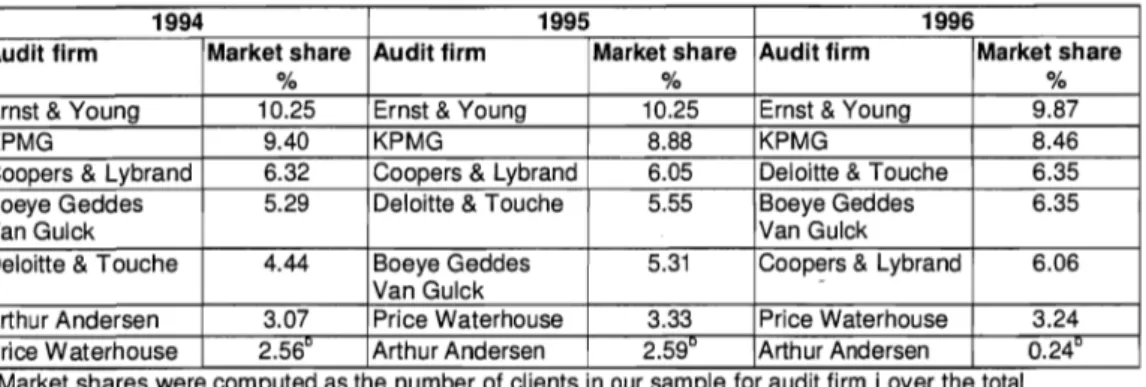
Tables 4 - 8 give a ranking of the audit firms in our sample based on each of the alternative continuous measures of audit-firm size. Five of the six tables (Tables 4, 5, 6, 8) indicate that a non-Big6 auditor(s) enters the Top6 of the largest audit firms. Only the ranking on audit firm total assets (see Table 7) identifies the Big6 as the largest six auditors in Belgium. Our evidence is generally supportive of our concern that Big6 auditors are not necessarily the largest audit firms in the Belgian audit market16 .
16 Our data cover the years 1994 - 1996. The ranking of the largest audit firms has changed since, due to the merger of Price Waterhouse and Coopers and Lybrand in 1997. Our Tables 4-8 show that before the merger of Price Waterhouse and Coopers and Lybrand, Price Waterhouse was typically one of the smallest Big6 audit firms in Belgium. Now, PriceWaterhouseCoopers is the largest audit firm in the Belgian audit market.
[Insert Table 4 about here]
[Insert Table 5 about here]
[Insert Table 6 about here]
[Insert Table 7 about here]
[Insert Table 8 about here]
6. Empirical Results Audit Quality
Table 9 reports the results of the OLS estimation of our regression model of the absolute value of discretionary accruals on a proxy for audit quality and various control variables. The F-value and adjusted R-squared of the Models A - F indicate that the models are successful in explaining (some of) the variance in discretionary accruals. Further, the correlation matrix (see Table 10) and the variance inflation factors (not reported) do not indicate multicollinearity problems.
[Insert Table 9 about here]
Table 9, Model A shows that the extent of earnings management is not smaller for clients audited by Big6 auditors than for clients audited by non-Big6 auditors. Nor do we find that the extent of earnings management decreases in any of our continuous measures of audit-firm size (see Models B-F). We find thus no evidence supportive of a relationship between the quality of the external auditor and the extent of discretionary accruals management. The coefficients on the continuous measures of audit-firm size variables are not more significant than the coefficient on the dichotomous variable Big6/ non-Big6 auditor. There is thus no evidence supportive of our argument that the use of continuous measures of audit-firm size (instead of the dichotomous variable Big6/ non-Big6 auditor) increases the power of tests of quality differentiation between auditors.
As discussed in section 3, lack of evidence of audit-quality differentiation in the private client segment of the Belgian audit market may be a consequence of the lack of demand for quality-differentiated services or the lower probability of detection of an audit failure in privately held Belgian companies. The lower probability of detection of an audit failure may be caused by the relative absence of litigation in the Belgian audit environment or by the absence of scrutiny of privately held firm's financial statements by financial analysts, investors, and market regulators. Another potential explanation was the inappropriateness of the use of the dichotomous measure Big6/ non-Big6 auditor as a size proxy in the Belgian audit market. However, since we do not find evidence supportive of continuous measures of audit-firm size being better proxies to capture quality differences between auditors, the former
explanations seem the more plausible ones. Our results thus suggest that the existing enforcement and monitoring mechanisms do not induce quality differences between auditors in the private client segment of the Belgian audit market.
Control variables
Signs on the coefficients of FDEBTTA, DFDEBT and CDEBTTA are negative, which suggests that monitoring by bankers and suppliers constrains the level to which privately held companies manage earnings. The coefficient on TAX is negative and significant, and is mainly driven by significantly lower levels of income-increasing earnings management. This result is in line with Sercu, VanderBauwhede and Willekens (2002) and is consistent with companies reducing earnings for tax reasons. The coefficient on ABOCF is significant and positive, which is consistent with the observation that extreme levels of cash flow are related to extreme levels of discretionary accruals (Dechow et al. 1995).
Sensitivity checks
We checked the sensitivity of our results to alternative measures of earnings management as well as of audit-firm size. First, we checked the sensitivity of the results to our choice of earnings management measure in equation 1. For that purpose, we reran the model in equation 1 in two different ways. First, we used an alternative specification of discretionary accruals as dependent variable, namely the widely-adopted modified Jones model (Dechow et al. 1995). Second, we used total accruals as the dependent variable. Results of both regressions show that the audit-firm size proxies are not significant, which is consistent with the results reported in Table 9.
Next, we checked the sensitivity of the results to the use of the absolute value of discretionary accruals as a measure of earnings management. By using the absolute value of discretionary accruals as our measure of earnings management, we implicitly examine the impact of auditor size (as a proxy for audit quality) on both income-increasing earnings management (positive discretionary accruals) as well as income-decreasing earnings management (negative discretionary accruals). To make this issue more explicit, we reran our regressions on the sub-samples of positive and negative discretionary accruals. Results of these analyses (not reported) are consistent with those reported in the body of the text.
Third, we tried to increase the power of our tests by increasing the size-difference of auditors in our sample. We therefore ranked the observations on each of the five continuous audit-firm size proxies, and each
time deleted the middle 50 percent of observations. We also created a dummy variable that indicates whether an observation belongs to the first or fourth quartile. Observations in the first quartile are audited by the largest auditors in our sample. Observations in the fourth quartile are audited by the smallest auditors in our sample. We then replaced our audit-firm size proxy in equation 1 by one of those dummy-variables. The results of those regressions on the reduced samples indicate that the dummy variable is never significant, which corroborates the results reported earlier.
7. Conclusion
In this paper we provide more evidence on the lack of audit-quality differentiation in the private client segment of the Belgian audit market and use auditor size as our audit-quality proxy. Prior evidence on audit-quality differentiation in the private client segment of the Belgian audit market is mixed, but uses the big 6/non-big 6 variable as auditor-size proxy. In this paper we investigate whether these mixed results stem from the inability of this dichotomous variable to capture auditor-size differences in a less concentrated audit market. Therefore, we test various
continuous
measures of audit-firm size, namely audit-firm market share, number of clients, number of partners of the audit firm, audit-firm total assets and audit-firm operating profit. We argue that the lack of quality differences between auditors may be the result of a lack of demand for quality-differentiated services by privately held Belgian companies or may be the result of the low probability of detection of an audit failure in those firms. Note that our results do not necessarily imply that the existing structures in Belgium are unable to imposea socially acceptable level of audit quality. Our results only suggest that smaller and larger auditors do not differ systematically as to constraining discretionary accruals management in privately held companies. Both smaller and larger auditors may still provide socially acceptable levels of audit quality, for example the minimum level of audit quality that results from performing an audit according to the Generally Accepted Auditing Standards (GAAS).
Finally, we like to emphasize that our evidence as to the lack of audit-quality differentiation in the private client segment of the Belgian audit market is based on one specific proxy of quality differentiation, namely audit-firm size and its impact on one specific dependent variable, namely discretionary accruals management. Further tests of quality differentiation between auditors that make use of these continuous measures of audit-firm size but test it on alternative dependent variables, or even use other audit quality proxies are necessary to corroborate our findings and are a worthwhile avenue for future research.
References
Aerts, K. (2002). Taken en aansprakelijkheden van commissarissen en bedrijfservisoren. Larcier.
Becker, C. L., DeFond, M. L., Jiambalvo, J. and Subramanyam, K. R. (1998). The Effect of Audit Quality on Earnings Management, Contemporary Accounting Research 14: 1-24.
Citron, D. B. and Taffler, R. J. (1992). The Audit Report under Going Concern Uncertainties: An Empirical Analysis, Accounting and Business Research 22,337-345.
Craswell, A., Francis, J. and Taylor, S. (1995). Auditor brand name reputations and industry specializations, Journal of Accounting and Economics 20,297-322.
DeAngelo, L.E .. (1981). Auditor size and audit quality, Journal of Accounting and Economics 3: 183-199.
Dechow, P.M., Sloan, R.G. and Sweeney, A.P. (1995). Detecting Earnings Management, The Accounting Review 70, 193-225.
DeFond, M. and Subramanyam, K.R. (1998). Auditors Changes and Discretionary Accruals, Journal of Accounting and Economics 25: 35-68.
DeFond, M. (1992). The Association between Changes in Client Firm Agency Costs and Auditor Switching, Auditing: A Journal of Practice and Theory: 16-31.
Francis, J. R., Maydew, E. L. and Sparks, H. C. (1999). The role of Big Six Auditors in the Credible Reporting of Accruals, Auditing: A Journal of Practice & Theory 18: 17-34.
Francis, J.R. and Simon, D.T. (1987). A Test of Audit Pricing in the Small Client Segment of the U.S. Audit Market, The Accounting Review LXII: 145-157.
Francis, J.R. and Wilson (1988). Auditor Changes: A Joint test of theories relating to Agency Costs and Auditor Differentiation, The Accounting Review LXIII: 663-682.
Gaeremynck, A. and Willekens, M. (2002). The Endogenous Relationship between Audit-Report Type and Business termination: Evidence on Private Firms in a Non-Litigious Environment, forthcoming in: Accounting and Business Research.
Lefebvre,C., Lin, L. and Van Nuffel, L. (1995). Financial and economic information for industrial relations councils. The case of Belgium, The European Accounting Review. 555-569.
Mutchler, J. F., Hopwood, W, and McKeow, J. C. (1996). 'An explanatory model of audit opinion decisions on bankrupt companies'. Working paper .
Palmrose, Z.-V. (1986a). Audit Fees and Auditor Size: Further Evidence,
Journal of Accounting Research 24: 97-110.
Palmrose, Z.-V. (1986b). The Effect of Non-Audit Services on the Pricing of Audit Services: Further Evidence, Journal of Accounting Research 24:
405-411.
Palmrose, Z.-V. (1988). An Analysis of Auditor Litigation and Audit Service Quality, The Accounting Review 63: 55-73.
Reynolds, J. K. and Francis, J.R. (2001). Does size matter? The influence of large clients on office-level auditor reporting decisions, Journal of Accounting and Economics 30: 375-401.
Schaen, M. and Maijoor, S. (1997). The structure of the Belgian audit market: the effects of client concentration and capital market activity,
International Journal of Auditing 1: 151-162.
Simunic, D. (1980). The Pricing of Audit Services: Theory and Evidence,
Journal of Accounting Research 18: 119-134.
VanderBauwhede, H., Willekens, M. and Gaeremynck, A. (2001). Audit
Quality, Public Ownership and Firm's discretionary Accruals
Management, Research report No. 0053, KULeuven.
VanderBauwhede, H. and M. Willekens. (2001). Earnings quality in privately held Firms: the roles of audits, stakeholders and governance
mechanisms, Working paper, KULeuven.
Weets, V. and Jegers, M. (1997). Are The 'Big Six' 'Big' in Belgium?, The European Accounting Review, (VoI.6/4): 773-789
Willekens, M. and Achmadi, C. (2002). Pricing and Supplier Concentration in the Private Client Segment of the Audit Market: Market Power or Competition?,Forthcoming in: International Journal of Accounting ..
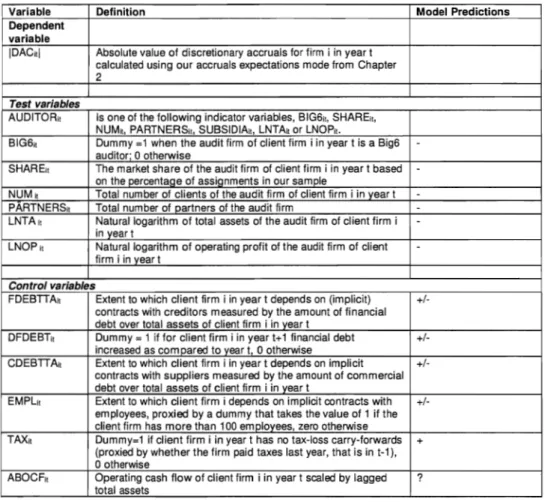
Table 1 Model specification and variable measurement
Variable Definition Model Predictions
Dependent variable
IDACiti Absolute value of discretionary accruals for firm i in year t calculated using our accruals expectations mode from Chapter 2
Test variables
AUDITORIt Is one of the following indicator variables, BIG611, SHAREit,
NUM~, PARTNERSlt, SUBSIDIAlt, LNTAit or LNOPlt.
BIG6it Dummy =1 when the audit firm of client firm i in year t is a Big6 -auditor· 0 otherwise
SHAREit The market share of the audit firm of client firm i in year t based
-on the percentage of assignments in our sampleNUMlt Total number of clients of the audit firm of client firm i in year t -PARTNERSlt Total number of partners of the audit firm -LNTAlt Natural logarithm of total assets of the audit firm of client firm i
-in year t
LNOPlt Natural logarithm of operating profit of the audit firm of client
-firm i in year tControl variables
FDEBTTAit Extent to which client firm i in year t depends on (implicit) +/-contracts with creditors measured by the amount of financial debt over total assets of client firm i in year t
DFDEBTit Dummy = 1 if for client firm i in year t+ 1 financial debt +/-increased as com pared to year t 0 otherwise
CDEBTTAit Extent to which client firm i in year t depends on implicit +/-contracts with suppliers measured by the amount of commercial debt over total assets of client firm i in year t
EMPLlt Extent to which client firm i depends on implicit contracts with +/-employees, proxied by a dummy that takes the value of 1 if the client firm has more than 100 employees, zero otherwise
TAXit Dummy=1 if client firm i in year t has no tax-loss carry-forwards + (proxied by whether the firm paid taxes last year, that is in t-1),
o
otherwiseABOCFit Operating cash flow of client firm i in year t scaled by lagged ?
Table 2 Descriptive statistics on the variables of our explanatory model"
Panel A: Test variables - Audit firm characteristics (per audit firm)
Variable N Mean SI.Oev. Min. Q1 Median Q3 Max
SHARE 1994 107 0.0097 0.0174 0.0017 0.0017 0.0034 0.0085 0.1025 1995 133 0.0068 0.0144 0.0012 0.0012 0.0024 0.0062 0.1025 1996 120 0.0074 0.0152 0.0012 0.0014 0.0028 0.007 0.0987 NUMc 1994 106" 123.6604 257.0284 1 13 34.5 93 1263 1995 132" 89.1288 216.0632 1 11.5 28 59.5 1307 1996 1190 67.1596 161.6235 1 6 18 43 957 PARTNERS 1995 146 2.5734 4.9488 1 1 1 3 49 AUTA 1994 77" 87506.53 211557.1 1258 6754 16083 31404 937689 1995 94" 49869.02 139203.9 1839 6267 12455.5 22541 844615 1996 91" 53468.96 148089 1721 6768 12237 26574 901656 AUOP 1994 77" 8240.94 26267.2 -926 452 1624 4026 203929 1995 94 5054.96 18121.6 -1912 462 1217.5 2977 160183 1996 91 5764.67 18385.4 -2460 286 1343 2619 130894
Panel B: Dependent variable and control variables (across firm-year observations)
Variable N Mean 51.Dev. Min. Q1 Median Q3 Max IDACI 1302 0.0496 0.0553 0.00002 0.0142565 0.0319518 0.066678 0.57126 BIGS 1302 0.3725 0.4637 0 0 0 1 1 SHARE 1302 0.0339 0.0356 0.0012 0.0049 0.0148 0.0606 0.1025 NUM 1299 429.0238 470.2442 0 38 126 933 1307 PARTNERS 1296 9.8643 12.0444 1 2 5 14 49 LNTA 1156" 11.3043 1.6363 7.1373 9.7923 10.9188 13.3408 13.7512 AUTA 1156" 283404 335447.5 1258 17895 55205 622062 937689 LNOP 1117" 6.8725 2.1266 2.1972 7.3258 8.4027 10.7622 12.2255 AUOP 1117" 35592 53764.11 9 1519 4459 47204 203929 FDEBTTA 1302 0.1732 0.1916 0 0.0010 0.1025 0.3060 0.9203 DFDEBT 1302 0.4646 0.5 0 0 0 1 1 CDEBTTA 1302 0.2827 0.2055 0 0.1327 0.2424 0.3611 0.9682 EMPL 1302 0.2796 0.4490 0 0 0 1 1 TAX 1302 0.7135 0.4523 0 0 1 1 1 ABOCF 1302 0.1446 0.1545 0.0001 0.0476 0.0976 0.1902 2.06
.
..
For variable definitions see Table 1, AUTA = total assets of the audit firm In thousands of Belgian francs; AUOP
=
operating profit of the audit firm in thousands of Belgian francs.b Number of observations reduced due to some missing values for the particular variable. Missing values
for AUTA and AUOP due to the fact that sole practitioners do not submit financial statements with the Belgian National Bank.
e Data based on all firms that submitted financial statements with the Belgian National Bank. Note that
the number of assignments per auditors is generally lower for 1996. This is likely due to the fact that not all firms already submitted their financial statements with the National Bank at the date the 1996 CD-Rom was made. The figures give though an indication of the ranking of the major audit firms, under the assumption that the firms that submit their financial statements later than the the moment at which the CD-Rom was made, are randomly distributed across audit firms.
Table 3 Pearson correlation coefficients between the alternative measures of audit firm size
BIGb SHARE NUM PARTNERS LNTA LNOP
BIG6 1
SHARE uo~66g~ 1
NUM Uo~666~ Uo:66~i l
PARTNERS Uo~6~bi
°o~g~6i
°o~6~6i
1LNTA
°o~g66~
°o~gggi
°o~6bgi
uo~g6~i
J.LNOP
Table 4 Market shares for the seven largest audit firms across the years 1994,1995 and 19968
1994 1995 1996
Audit firm Market share Audit firm Market share Audit firm Market share
% %
Ernst & Young 10.25 Ernst & Young 10.25 Ernst & Young
KPMG 9.40 KPMG 8.88 KPMG
Coopers & Lybrand 6.32 Coopers & Lybrand 6.05 Deloitte & Touche
Boeye Geddes 5.29 Deloitle & Touche 5.55 Boeye Geddes
Van Gulck Van Gulck
Deloitte & Touche 4.44 Boeye Geddes 5.31 Coopers & Lybrand
Van Gulck
Arthur Andersen 3.07 Price Waterhouse 3.33 Price Waterhouse
Price Waterhouse 2.56" Arthur Andersen 2.59" Arthur Andersen
Market shares were computed as the number of clients In our sample for audit firm lover the total number of clients in our sample.
b All subsequent audit firms have a market share of less than 2 percent.
% 9.87 8.46 6.35 6.35 6.06 3.24 0.24"
Table 5 Ranking of largest audit firms based on the total number of assignments8
1994 1995 1996
Audit firm Number of Audit firm Number of Audit firm Number of
assignments assignments assignments
Ernst & Young 1263 Ernst & Young 1307 Ernst & Young
KPMG 1192 KPMG 1303 KPMG
Coopers and & 1016 Coopers & Lybrand 1088 Deloitte & Touche Deloitte & Touche 934 Deloitte & Touche 1023 Coopers & Lybrand
Boeye Geddes 612 Boeye Geddes 652 Arthur Andersen
Van Gulck Van Gulck
Arthur Andersen 571 Arthur Andersen 607 Boeye Geddes
Van Gulck
Price Waterhouse 4700 Price Waterhouse 495c Price Waterhouse
Data based on all firms that submitted financial statements with the Belgian National Bank. Note that the number of assignments per auditors is generally lower for 1996. This is likely due to the fact that not all firms already submitted their financial statements with the National Bank at the date the 1996 CD-Rom was made. The figures give though an indication of the ranking of the major audit firms, under the assumption that the firms that submit their financial statements later than the the moment at which the CD-Rom was made, are randomly distributed across audit firms. Note as well that the top 7 of the largest audit firms is consistent across years.
bThe next largest auditor is Delvaux, Fronville, Hoste with 218 assignments.
cThe next largest auditor is BOO with 248 assignments. dThe next largest auditor is BOO with 186 assignments.
957 933 747 712 453 422 3730
Table 6 Ranking of audit firms based on the number of partners of the audit firm for the year 1995
Audit firm Number of partners
Deloitte & Touche 49
KPMG 45
Ernst & Young 27
Coopers & Lybrand 15
Bosye Geddes Van Gulck 14
Price Waterhouse 12
BDO Bedrijfsrevisoren 10
Peeters, Dupont & Partners 8
Arthur Andersen 8
Hermant, Dodemont & Co 7
Toelen, Cats Morlie & Co 7
Table 7 Ranking of largest audit firms based on total assets of the audit firm
1994 1995 1996
Ernst & Young Coopers & Lybrand Coopers & Lybrand Coopers & Lybrand Ernst & Young Ernst & Young
KPMG KPMG KPMG
Price Waterhouse Price Waterhouse Deloitte & Touche
Arthur Andersen Deloitte & Touche Arthur Andersen
Deloitte & Touche Arthur Andersen Price Waterhouse
Delvaux Fronville Hoste Delvaux Fronville Servais and Delvaux Fronville Servais and
Co Co
Table 8 Ranking of largest audit firms based on operating profit of the audit firm
1994 1995 1996
Ernst & Young Ernst & Young Ernst & Young
KPMG KPMG KPMG
Coopers & Lybrand Coopers & Lybrand Coopers & Lybrand Deloitte & Touche Deloitte & Touche Deloitte & Touche
Arthur Andersen Van Geet Derick and Co Arthur Andersen
Delvaux Fronville en Hoste Arthur Andersen Van Geet Derick and Co
Peeters Dupont and Partners· Peeters Dupont and Partners Price Waterhouse • Price Waterhouse is number 8
Table 9 Results of the OLS estimation of the absolute value of discretionary accruals
on proxies of audit firms size and control variables
Variable" Model A Model B Model C Model D Model E Model F
BIG6 SHARE NUM PARTNERS LNTA LNOP
Coefficient Coefficient Coefficient Coefficient Coefficient Coefficient estimateb estimateb estimateb estimateb estimateb estimateb
Intercept 0.05357'" 0.05501 **' 0.05420'" 0.05385'" 0.03692'" 0.04676"* AUDITOR 0.00384 -0.01216 0.0000015 0.00007 0.00140 0.000803 FDEBTTA -0.01297 -0.01229 -0.01276 -0.01271 -0.01223 -0.01413 DFDEBT -0.00569' -0.00529' -0.00567* -0.00582' -0.00493 -0.00505 CDEBTIA -0.01093 -0.01013 -0.01065 -0.01026 -0.00907 -0.00882 EMPL 0.00115 0.00124 0.00133 0.00132 0.00242 0.00249 TAX -0.01408'" -0.01419'*' -0.01426'" -0.01398'" -0.01323'" -0.01838*** ABOCF 0.08773*** 0.08864'** 0.08793**' 0.08917*" 0.08825*** 0.08858*" F-value 15.81 15.59 15.58 15.72 14.45 13.87 P-value of F- 0.0001 0.0001 0.0001 0.0001 0.0001 0.0001 value Adjusted R' 0.0738 0.0728 0.0729 0.0736 0.0754 0.0747 N 1302 1302 1299 1296 1156 1117" . ..
For variable definitIOns see Table 1 .
b.,. significant at the 0.01 level;" significant at the 0.05 level; , significant at the 0.10 level, results are based on two-tailed tests.
C Number of observations reduced due to misSing values for this audit firm characteristic or negative operating profit (in
Model F).
Table 10 Pearson correlation coefficients between the various proxies of audit firm size and the control variables.
BIG6 SHARE NUM PARTNERS LNTA LNOP FDEBITA DFDEBT COEBITA EMPL TAX ABOCF
BIG6 1
SHARE uo~g~g~ 1
NUM
46~666~
U6~66bi
1PARTNERS
°o~6g6i °o~gg6i
O. 6~~~1 1 0.0001LNTA
°o~g6~~
°o~gggi°o~66g1 °o~g~M
1LNOP u6~5g&I U6~66M U6~&56~ u6~6ggi U6~6b6i
1-FDEBITA
Uci~i~~6 Uci~~~~;
Uci~~~~~
°ci~~~~~
U.O~~13 -Uci~~~~~ 1 0.7824DFDEBT -Uo~i:~~ -uci~6g~~ uci~gg~ Uci~%~~ -uci~g~~~
-Uci~6H~
Uci~&gg~ 1CDEBITA
Uci~6~n
uci~gi;~Uci~6~6~
uci~~g~ uci~6g~~°ci~gji~
-Uci~66M -Uci~~~~~ 1EMPL Uo~H~~ Uo~H~~ Uo~HH -Uo~~~H Uci~~~~~ Uo~~§H Uci~t~80
-Uci~~~~~
-°ci~6~~~
1TAX -uci~H~g -Uci~~~~~ -Uci~~~~~
o~ci~~j~ -°ci~~~~~ -°ci~i%i -°ci~~6~i
-oo~i~g°o~~~~~ °o~g~~~
1 ABOCFUci~6~H
°ci~6igg
°ci~g~~~ °ci~~~~~
uci~gg~~ uci~g~~i -uci~g~~~ -Uci~~~~~Uci~~~~~
Uci~iHi uci~g~M1--