I Graduanda, Departamento de Engenharia Civil, Universidade Estadual Paulista - UNESP, Ilha Solteira, SP, Brasil. raissa_ppivetta@hotmail.com
II Mestrandas, Departamento de Engenharia Civil, Universidade Estadual Paulista - UNESP, Ilha Solteira, SP, Brasil. analaurasolercunha@gmail.com
III Mestrandas, Departamento de Engenharia Civil, Universidade Estadual Paulista - UNESP, Ilha Solteira, SP, Brasil. estefanisugahara@hotmail.com
REGET, Santa Maria v.23, Ed. Especial, e10, 2019 DOI: https://doi.org/10.5902/2236117038533 ISSN 2179-460X
Measures for reduction of the water losses in the distribution
network: a case study on the municipality of Altônia/PR
Medidas para redução das perdas de água na rede de distribuição: um
estudo de caso no município de Altônia/PR
Vitor Alécio Sevilha GorzoniI Priscila Pini PereiraII Sandro Lautenschlager III Cristhiane Michiko Passos OkawaIV
Abstract
The water losses management provides cost reduction for sanitation companies and, thus, for the treated and distributed water’s final users. In the face of the recent episodes of hydric crisis in the state of São Paulo, it is essential to have a good water supply management system, which includes controlling the water loss volume in the system. The easiest way to manage this control is based on the water balance, in other words, calculating the difference between the distributed volume and the volume measured in the consumption units. This work presents one case study at the municipality of Altônia, in Paraná, where the continuous expansion of the water supply system has led to the increase of the water loss volume on the distribution process. The municipality has chosen procedures as the appropriate and periodic maintenance of the network, installation of new water meters and pressure reduction valves and the monitoring of leakages with mechanical tools. Thus, it was possible to reduce the water loss volume by half.
Keywords: Water Supply; Losses in the water network; Losses management in the water system
Resumo
O controle de perdas de água gera redução de custos para as companhias de saneamento e, consequentemente, para os usuários finais da água tratada e distribuída. Frente aos episódios recentes de crise hídrica no estado de São Paulo, é imprescindível um bom gerenciamento do sistema de abastecimento de água, o que inclui controlar o volume de água perdido no sistema. A forma mais simples de exercer esse controle se baseia no balanço hídrico, ou seja, calcular a diferença entre o volume distribuído e o volume medido nas unidades consumidoras. Este trabalho apresenta um estudo de caso no município de Altônia, no Paraná, onde a contínua ampliação do sistema de
abastecimento de água acarretou em aumento no volume de água perdida durante a distribuição. O município adotou procedimentos como a manutenção adequada e periódica da rede, instalação de novos hidrômetros e válvulas redutoras de pressão e monitoramento dos vazamentos com aparelhos mecânicos. Desta forma, foi possível reduzir à metade o volume de água perdido.
Palavras-chave: Abastecimento de água; Perdas na rede de água; Controle de perdas no sistema de água
1 Introduction
Among the biggest challenges in a water supply system (WSS) is the specific work of water losses management in public water supply network. According to The International Benchmarking Network for Water and Sanitation Utilities (IBNET, 2015), the average water losses index in the WSS is 39,1% in Brazil, far above from the top rated in the rank, as Australia and United States, who had losses of 7% and 13% respectively. Even some underdeveloped countries, such as Tonga in the African continent and Vietnam in Asia, has shown loss rates lower than the Brazilian, equal to 7% and 13% respectively. In the face of these results, it is required to improve the water distribution systems and, above all, the management and the losses control.
A program for water losses controls aims to identify real or physical losses of water in the system, as well as the apparent losses. The real losses, also known as physical losses, occur because of failures in the distribution system, such as leakages in the network or on its connections and water overflow in the tank. The apparent or commercial losses occur when the volume of consumed water doesn’t generate profit, due to the unauthorized actions as the installation of illegal connections in the water intake, or miscalculation, with inaccurate readings or billings of the water consume (Lambert and McKenzie, 2012).
The losses management on a WSS can bring or reduce the resources to be spent or invested in a given system, especially in the water intake. All of the captured, treated, distributed and unmeasured water volume causes financial losses to the water and wastewater companies, due to the energy and the chemical products used for treating the water that is not going to be accounted for the company’s income. That fact can affect the fee or the billing of the services, which may also decrease the investment capacity.
Once it has been identified any kind of loss in a system, the implementation of a control program can reduce the need for new investments for the increase of the capability of the system, due to the population growth or to the water demand.
Programs for water loss reduction are, generally, the cheapest solution to increase water availability, especially in short term (EPA, 2014).
However, the water distribution networks are parts of an infrastructure where a direct inspection is hard in most of the times, thus the detection of its deficiencies isn’t easily detectable. Thus emerge the need for supportive instruments based on the modeling and analyses.
Coelho et al. (2006) suggest that all of the water supply systems must be simulated in appropriate computer programs. The simulation models have multiple uses, by which the authors highlight: system sizing; critical scenarios simulation, for instance, emergency situations or failures in the pumping system; control of the water quality parameters, as an example, the maintenance of a proper residual chlorine among the whole system; and the water losses control, for instance, through the reduction of the service pressure.
Piechnicki et al. (2011) mention that the most common problem in a WSS, which presents losses to the system are: no measurement or inappropriate measurement of the water meter; the lack of maintenance in the supply network or the use of old networks for the distribution; correlated problems in the system’s operation; and accounting problems.
Lambert and McKenzie (2002) mention that there are four basic methods for the real losses management: control of the network pressure; continuous control of the leakage; speed and quality of the repairs; and inappropriate selection of the pipe’s materials, as well as its installation, maintenance and substitution when required.
Coelho et al., (2006) still mention zoning of a network as a useful tool for the calculation of the water volumes lost. According to the same authors, the modern strategies for loses control advise the division of the distribution networks to measurement and control zones (MCZ) having no more than 3.000 consumer units, or about to 7.000 inhabitants.
The guarantee of a great pressure in the network ensure the ideal water supply to the customers, in addition to eliminate problems with hydraulic transient and premature wear of the in the plant. The pressure management includes controlling
the pumps, tanks levels, as well as the pressure reduction valves (Karadirek et al., 2012).
In this context, the objective of the current article was to quantitatively evaluate the water losses in the WSS from the municipality of Altônia, in Paraná. There were also analysed the usual routines for losses reduction in the municipality, as well as the obtained results. Thus the losses rates were evaluated in the system in the period between 2006 and 2014, knowing that the changes in the supply system started in the year of 2007.
2 Methods and materials
For the analysis of the water losses in the network of the municipality of Altônia, the data collected from the Companhia de Saneamento do Paraná (Sanepar) has demonstrated the evolution of the water losses rates in the municipality between the period of 2006 and 2014.
It was aimed to analyse the rates based on the information that was also provided by Sanepar regarding the improvements made in the local water supply system in the same period. The company has also provided information about the water supply system of the municipality.
2.1 Characterization of the study area
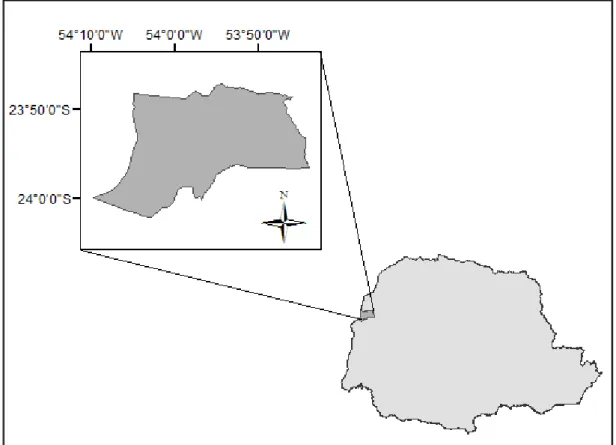
The municipality of Altônia is located in the Northwest region of Paraná, 640 km away from the state capital Curitiba. The municipality has an area of 661.56 km², by which 5.54 km² is classified as urban area. The last census made in 2010 by the IBGE has evidenced a population of 20,516 inhabitants. Nowadays the estimated population is of 21,744 inhabitants (IBGE, 2015).
The figure 1 presents the location of the municipality in the state and the figure 2, the municipal boundaries.
Figure 1 – Location of the municipality of Altônia in the state of Paraná
Source: Adapted from IBGE (2015)
Figure 2 – Municipal boundaries of Altônia - PR
The municipality of Altônia has 107,433 meters of water distribution network and 6,789 water service connections. The existing network is divided between high and low zones, accordingly to the elevation of the terrain. The low zones are highlighted in the figure 3, inside the urban boundaries of the municipality.
Figure 3 – Urban perimeter of Altônia – PR, with the indication of the low zones
Source: Google Earth (2015)
The WSS of Altônia has six deep wells that collect together a flow of 45.05 m³.h-1 of water. Each well has one independent pipe of raw water that reaches until the supported tank (ST), which has a volume of 750 m³. This tank is located in the topographic elevation of 358 meters and, it isn’t possible to perform the supply from him due to its location. It is used as a contact chamber and suction tank for the pumping station.
The water distribution is performed in march and the surplus goes to the elevated tank (ET), which contains 150 m³. As the tank’s volume is small in terms of
demand, the pumping station works 16 hours a day, having a manometric height of 59 metre of water column (MWC).
There is a room on the ET area for the construction of another ST, which could supply a great part of the city by gravity, where the rest of the city would be supplied by the ET.
There were implemented a pumping station, the distribution rings and a treated water pipe from the 750 m³ ST to the new tank.
2.2 Water losses measurement
The parameters utilized by the Companhia de Saneamento do Paraná for the measurement of losses in the water supply system (WSS) are presented in the Chart 1.
Chart 1 – Parameters utilized by the Sanepar for water losses measurement
Parameter Abbreviation
Produced volume Pv
Consumed volume Cv
Active water connections Awc
Number of days Nd
Total losses rate TLR
Losses rate per connections LRC
The produced volume (Pv) corresponds to the total water volume captured, including underground or surface water, which can be measured in m³ or in litres. The consumed volume (Cv) is defined as the treated and distributed volume and can also be measured in m³ and litres.
In accordance with Sanepar, the active water connections (Awc) are connections that are in active process of consumption and billing. The number of days (Nd) corresponds to the total number of days utilized for the calculation of total, billed, consumed or produced volumes.
The total losses rate (TLR) states the correlation between the unbilled volume and the produced volume. The equation 1 is widely used in water and wastewater management (Santos and Montenegro, 2014).
(1)
The losses rate per connections (LRC) can be calculated in accordance with the equation 2.
(2)
On the original conception of the WSS project in Altônia, the city should be completely supplied in the high zones, while the low zones of the city (Figure 3) would be ignored once they were not occupied. Due to the territorial expansion of Altônia, the city’s low zones were occupied and the system was readjusted. The water distribution that once was wholly performed by the elevated tank started to be performed by the treated water’s pumping station.
One of the effects of this modification in the supply was the increase of the water volume lost in the supply system. Once the increase of the water volume lost through the distribution was stated, implementations have been done in the network.
2.3 Actions for the losses control
Among the continuous actions of the losses management, it can be highlighted the constant control and simulation of the system, maintenance and leakage control (through the geophoning), pressure control and water meter improvements, as shown in the figure 4.
Figure 4 – Management of losses control
Source: Authors
The integration of the actions presented in the figure 4 is essential for the losses control. The simulation of the system allows it to verify the possible weaknesses points, as well as the flow, minimum and maximum pressure along the supply system. Thus it is possible to predict ways to control the pressure in the system, through the installation and monitoring of the pressure reducing valves (PRV).
Another important item for losses control is the continuous maintenance of the system, substituting pipes and old parts. The control and detection of the leakages are facilitated by the use of equipment such as the geophone.
The water metering or measurement of various water consumption points exerts a fundamental role in measurement of the concessionaire’s billed volume. The measurement equipment also has to be constantly measured and replaced in a way that his age won’t exceed five years so that their results would be more precise.
The integration of the four actions mentioned in the figure 4 has also made that the WSS of Altônia to present significant reductions of the water losses rates.
Lambert and McKenzie (2002) quote that the pressure management is of the most effective ways to control the leakages, especially in a system with an already damaged infrastructure. The authors add that the presence of waves with elevated pressure in the flow influences the rate at which new leakages occur and accelerate
the premature wear of the facilities. It has also demonstrated a reduction of the pressure optimizes the water consumption, preventing wastage.
As the system in the present municipality has a small size, there was installed pressure reducing valves (PRV) in places where the system’s simulations have found pressures above 35 mwc. The ABNT NBR 12.218 from 1994 demands the PRV to be installed when pressures are above 35 mwc. In Altônia, they were installed in places with pressure above 35 mwc, in order to increase the lifetime of the pipes and to reduce the water wastage.
Two PRV were installed in the system just after the exit of the Low Zones and the tank, which allowed the system to present pressures under the appropriate range of 10 to 35 mwc.
There are teams who walk-through the supply network in a daily basis to evaluate the pressures in the site and to regulate the PRV when required. The PRV acts directly to the system, which doesn’t have an integrated control, thus the verification has to be done in loco through the pressure devices.
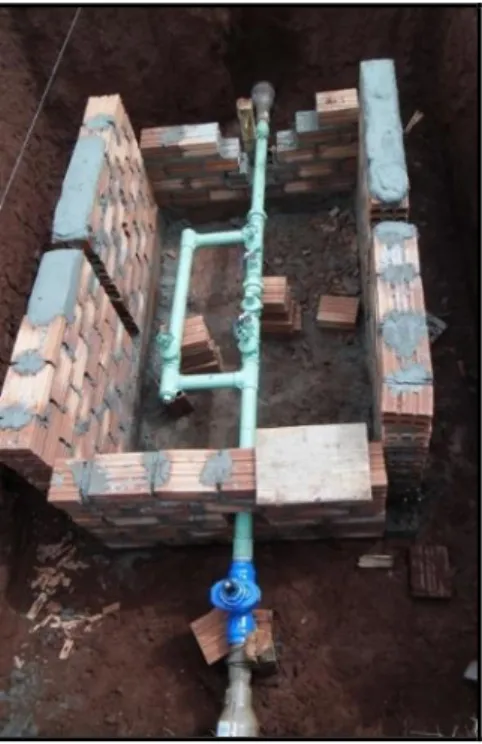
The installation procedure of a PRV is shown in the figure 5, having an appropriate shelter for its inspection.
Figure 5 – Shelter for the installation of a direct acting PRV
With regard to the leakage control, the Sanepar has well-trained teams who follow specific standards of non-destructive experiments and internal standards. The equipment utilized for the leakages detection is known as geophone.
In accordance with the ABNT NBR 15.183 from 2013, the geophone is an equipment which works as an acoustic electronic detector of leakages. The friction of the water flow going through the rupture points of the pipes emits a characteristic noise, identified by the listening rods of the device. Thus, it is possible to detect leakages without the need of breaking the sidewalk or the road.
The work with the geophone is made in predetermined period. In the Altônia’s system, there were implemented PRVs where there were leakages history and the distribution network had their conditions verified before and after the implementation of the PRVs.
The maintenance team is contacted after the detection of the leakage or after complains have been done to the customer services. The certified team has a deadline of 24 hours to solve the problem and the company has been fulfilling these deadlines regularly.
The figure 6 shows the operator using the geophone to detect leakages.
Figure 6 – Detection of leakages with the aid of the geophone
The water consumption measurement system or water metering is one of the essential elements for the calculation of the water balance between the distributed and the consumed water in the consumer units. The decree 246 from INMETRO (2000) recommends the water meters to be tested within a maximum period of five years for the measurements to be highly reliable and to avoid distortion of the readings.
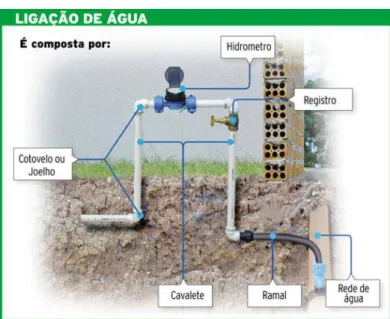
The figure 7 shows the water meter utilized by Sanepar for the control of water entrance in the consumer unit. The figure 8 demonstrated the Sanepar’s standard for the cold water consumer connection which has two elbows or knees, the own pipe also known as cavalete, the gauge, gate valve and the water service lines.
Figure 7 – Sanepar’s standard water meter
Source: Sanepar (2015)
Figure 8 – Cold water internal connection pipes
3 Results and Discussion
3.1 Losses rate per connection (LRC)
The registry of the Losses Rate per Connection on the water supply system of Altônia was collected from the period between 2006 and 2014. The table 2 presents the annual average and the rates per month during the analysed period. It is
possible to notice that after 2007 the losses rates have dropped due to the improvements that began to be implemented in the WSS.
Table 2 - Losses rate per connection (LRC) in the municipality of Altônia from 2006 to 2014 Month LRC (L.connections -1.day-1) 2006 2007 2008 2009 2010 2011 2012 2013 2014 JAN 233.5 261.4 191.5 110.7 75.7 110.8 91.8 129.6 87.1 FEB 191.4 204.4 201.2 107.4 96.7 67.6 57.0 79.0 61.2 MAR 203.1 135.4 105.2 114.2 84.9 84.5 79.5 150.6 126.4 APR 199.4 152.6 131.4 120.8 87.3 69.2 87.2 100.0 96.2 MAY 174.5 153.6 156.7 135.7 79.2 109.6 91.4 105.5 83.3 JUN 205.4 155.7 151.7 136.1 74.0 76.6 106.7 117.3 107.4 JUL 203.9 152.5 127.9 68.6 101.9 117.8 116.6 125.2 109.9 AUG 195.0 191.9 135.4 88.7 87.7 123.8 116.5 138.3 168.9 SEP 230.2 212.3 158.1 66.1 118.9 100.7 78.1 102.6 100.0 OCT 179.7 123.1 135.0 82.7 97.7 97.4 119.6 89.9 95.0 NOV 212.8 129.8 132.7 73.2 66.2 102.0 91.0 71.8 100.0 DEC 220.9 150.5 118.0 83.4 64.7 152.4 158.7 154.4 110.0 Average (LRC) 204.1 168.6 145.4 99.0 85.9 101.0 99.5 113.7 103.8 Total Losses (%) 33.1 29.4 27.2 19.5 17.5 20.2 19.8 22.2 20.9 Source: Sanepar (2015)
It can be noticed that the months with the highest loss in the system are January, July and December. They are months where most of the workers are on vacation, thus the municipality serves more people, which is called fluctuating population.
The table 3 shows the water loss rates of eight cities from different regions of Brazil, dated from 2013. It can be noticed that the municipality of Altônia presents lower rates than the others municipalities.
Table 3 – Losses rates in some Brazilian municipalities on 2013
City TLR (%) LRC (L.connection-1.day-1)
Altônia – PR ** 22.27 113.70 Ananindeua – PA * 51.84 572.46 Bauru – SP * 46.15 456.61 Foz do Iguaçu – PR * 37.01 318.05 Gravataí – RS * 59.44 656.86 Juazeiro do Norte – PE * 46.86 335.98 Maringá – PR * 22.53 152.84 Volta Redonda – RJ * 40.86 524.56
Sources: * Instituto Trata Brasil (2015) e ** Sanepar (2015)
It can be visualized in the figure 9 that the losses rates have dropped in the municipality of Altônia, with the lowest LRC on 2010, equal to 85.9 L.connection-1.day -1.
In order to determine the total losses rate, the produced or captured volume of water (Pv) was quantified along the whole year and the consumed volume (Cv), provided by the gauges from the same period between 2006 and 2014, where the equation 1 was applied.
Figure 9 - Losses rates per connection in Altônia from 2006 to 2007 204,149 168,599 145,388 98,974 85,910 101,038 99,512 113,684 103,767 0,00 50,00 100,00 150,00 200,00 250,00 2006 2007 2008 2009 2010 2011 2012 2013 2014
ANNUAL LRC AVERAGE ( L.connection-1.day-1)
In the figure 10, it is possible to visualize the percent of losses per connection in the same period. The years that had the lowest rates were 2009, 2010 and 2011. As of 2012 and 2013 the LRC has slightly increased, which it is believed to be due to the expansion of new lots and to new modifications in the supply system.
Figure 10 – LRC Percentage in Altônia from 2006 to 2007
33,1 29,4 27,2 19,5 17,5 20,2 19,8 22,2 20,9 0,0 5,0 10,0 15,0 20,0 25,0 30,0 35,0 2006 2007 2008 2009 2010 2011 2012 2013 2014 (% L o s s e s p e r c o n n e c tio n ) Year ANNUAL LRC AVERAGE (%)
The equation 2 was applied to determinate the losses rate per connection, along with the mentioned data, the quantity of active connections (Al) and the annual period of 365 days (Nd).
The analysis of the figures 9 and 10 has shown that the rate became steady at around 20% or 100L.connection-1.day-1. The value is considerably lower than the national average released by the IBNET (2015), which is equal to 39.1%.
3.2 Water Metering System
In Altônia, the water metering system has been constantly updated. According to the technical area of Sanepar, the water meter can present significant differences in the measurement of consumed volumes after five years of usage.
Since 2008, the water meters have been exchanged in a higher periodicity in the municipality, as it can be seen in the Table 4. From 5,450 installed water meters, 4,155 (76.2%) have five years or less of usage, which allowed a better measurement and billing in the system. Yet, 4% of the water meters (229) have ten or more years of usage. Therefore, the replacement of the water meters continues to be done, until the whole WSS has water meters whose usage time is equal or inferior to five years.
Table 4 – Age of the water meters by consumption range
Consumption
Range (unit) Age (Years)
From To 0 1 2 3 4 5 6 7 8 9 10 >10 Total 0 5 152 94 149 203 81 90 67 46 32 10 9 74 1,007 6 10 132 160 429 396 167 200 182 109 75 11 14 134 2,009 11 15 150 112 349 241 104 176 148 94 33 1 3 15 1,426 16 20 61 58 166 69 33 63 84 50 9 1 0 4 598 21 25 18 16 40 21 18 32 27 17 1 0 0 2 192 26 30 17 14 22 10 8 17 19 5 2 0 0 0 114 31 40 11 10 12 1 3 13 5 6 1 0 0 0 62 41 50 2 4 6 1 1 3 1 1 0 0 0 0 19 Continue...
51 60 0 0 2 0 0 0 0 1 0 0 0 0 3 61 70 1 2 2 0 0 1 1 0 0 0 0 0 7 71 80 0 0 2 0 0 0 1 0 0 0 0 0 3 91 100 0 1 0 0 0 0 0 0 0 0 0 0 1 101 200 2 2 3 0 1 0 0 0 0 0 0 0 8 301 400 1 0 0 0 0 0 0 0 0 0 0 0 1 TOTAL 547 473 1182 942 416 595 535 329 153 23 26 229 5,450 Source: Sanepar (2015) 3.3 Pressures Control
The control of the pressure reduction valve (PRV) is accomplished manually every fifteen days. The Sanepar’s technicians use the control sheet where the pressures values in the entrance of the PRVs have to be inserted in the system, where the entrance values are up to 40 mwc, and the output values ranges from 15 to 20 mwc.
The figure 11 presents the model of one control sheet used by Sanepar.
Figure 11 – Sheet used for the regulation of the pressure in the PRVs
Control of PRVs – Water network of Altônia
Local Diameter (PRV)
Pressure (mwc)
Time Note Entrance Regulated Output Output Higher Level Lower Level
Date Hour Resp. reading Approval
4 Conclusions
The water losses in Altônia in 2006 were 204 L.connection-1.day-1 and in 2014 they were 100 L.connection-1.day-1. This reduction by more than half of the initial losses occurred due to a set of procedures adopted by the local sanitation company, among them, the use of pressure reduction valves, reducing pressures of 40 mwc, to 15 to 20 mwc in the zones that allowed such intervention, causing gains in relation to the reduction of leaks and consequently contributing to reducing water losses in the system. Another improvement in the system that led to identifying points where the pressure needed to be adjusted was the hydraulic simulation of distribution network.
From the 5,450 hydrometers installed in the city, 4,155 are under the age of 5 years, which represents 76.0% of the total. Only 229 equipment aged over 10 years which represents 4.2% of the hydrometers installed.
The improvements that were implemented after 2007 in the WSS of Altônia have demonstrated to be efficient in the reduction of the water losses volume in the system, which led to a saving for Sanepar and to an increase of service life of the system. The reduction of expenses in the maintenance of the system happened especially due to the decrease of ruptures and leakages in the network and improves reliability in the residentials hydrometers.
Acknowledgements
To the Companhia de Saneamento do Paraná for providing the data, especially to the Engineer Rodolpho Tanaka Savelli.
References
ASSOCIAÇÃO BRASILEIRA DE NORMAS TÉCNICAS. NBR 12.218: Projeto de rede de distribuição de água para abastecimento público – Procedimento. Rio de Janeiro, 1994.
ASSOCIAÇÃO BRASILEIRA DE NORMAS TÉCNICAS. NBR 15.183: Ensaios não destrutivos - Estanqueidade para saneamento básico - Procedimento para tubulações pressurizadas. Rio de Janeiro, 2013.
COELHO, S. T., LOUREIRO, D., ALEGRE, H.. Modelação e Análise de Sistemas de Abastecimento de Água. Laboratório Nacional de Engenharia civil, Lisboa. 2006
EPA. United States Environmental Protection Agency. Water Loss Control Webcast.
2014. Available from:
https://www3.epa.gov/region9/waterinfrastructure/waterlosscontrol/index.html.
IBGE. Instituto Brasileiro de Geografia e Estatística. Available from http://www.cidades.ibge.gov.br.
IBNET. The international Bencharking Network for water and Sanitation Utilities. Available from: https://www.ib-net.org.
INMETRO. Portaria 246: Metrologia de hidrômetros de água fria. Ministério do Desenvolvimento da Industria e Comercio Exterior. Brasília, out. 2000.
INSTITUTO TRATA BRASIL. Saneamento no Brasil. Available from: http://www.tratabrasil.org.br.
KARADIREK, I.E.; KARA, S.; YILMAZ, G.; MUHAMMETOGLU, A.; MUHAMMETOGLU, H. Implementation of Hydraulic Modelling for Water-Loss Reduction Through Pressure Management. Water Resources Management, V26(1), p.2555-2568, 2012.
LAMBERT, A. O.; MCKENZIE, R. D. Practical experience in using the Infrastructure Leakage Index. In: Proceedings of IWA Conference–Leakage Management: A Practical Approach. Lemesos, Cyprus. 2002.
PIECHNICKI, A. S.; KAVALESKI, J. L.; SOUZA, M. V.; PIECHNICKI, F.; BARAN, L. R. Utilização da metodologia de análise e solução de problemas na redução de perdas de água: um estudo de caso na SANEPAR. Revista de Engenharia e Tecnologia, V3(2), p. 90-99, 2011.
SANTOS, D. D., MONTENEGRO, S. M. G. L. Avaliação da Metodologia para controle de perdas de água em rede de distribuição no Recife – PE. Revista DAE, V 197(1), p. 56-80, 2014.