AS 663
ASL R3153
2017
Millionaire Model Dairy Farm Performance in Iowa, 2015
Millionaire Model Dairy Farm Performance in Iowa, 2015
Larry Tranel
Iowa State University, tranel@iastate.edu
Follow this and additional works at: https://lib.dr.iastate.edu/ans_air
Part of the Dairy Science Commons
Recommended Citation
Recommended Citation
Tranel, Larry (2017) "Millionaire Model Dairy Farm Performance in Iowa, 2015," Animal Industry Report: AS 663, ASL R3153.
DOI: https://doi.org/10.31274/ans_air-180814-340
Available at: https://lib.dr.iastate.edu/ans_air/vol663/iss1/26
This Dairy is brought to you for free and open access by the Animal Science Research Reports at Iowa State University Digital Repository. It has been accepted for inclusion in Animal Industry Report by an authorized editor of Iowa State University Digital Repository. For more information, please contact digirep@iastate.edu.
Millionaire Model Dairy Farm Performance in Iowa, 2015
A.S. Leaflet R3153
Dr. Larry Tranel, ISUEO Extension Dairy Specialist Summary and Implications
A Millionaire Model Dairy Farm (MMDF) project was created by this author in the 1990’s. Its goal was to show beginning and transitioning dairy producers how to become “millionaires” by practicing a hybrid grazing and
confinement operation within 25 years of a dairy career. It has been a very successful Extension program. In 2012, organic dairy producers were added and in 2015,
conventional dairy producers were added to the data. Note the small number of herds in each data set may or may not be representative of an average of those types of farms Thanks to a Risk Management Education (RME) Competitive Grant, ISU Extension and Outreach has created a 2015 comparative analysis of the following three MMDF systems:
1) 5 Conventional Dairy Farms—milking an
average of 276 cows and operating 640 acres. 2) 5 Hybrid Grazing Dairy Farms—milking an
average of 185 cows and operating 294 acres. 3) 11 Organic Grazing Dairy Farms—milking an
average of 80 cows and operating 289 acres. Profitability was determined based on a combination of the following measures:
1) return to unpaid labor per hour
2) cost of milk production per cwt equivalent (cwt eq) 3) rate of return on assets
For each of the MMDF systems, the data was analyzed into three sets: 1) Average 2) Higher Profit and 3) Lower Profit. The Averages of each MMDF system are displayed in Table 1 (page 4) while the Higher Profit farms for each MMDF system are displayed in Table 2 (page 5).
Bottom line is that all three systems studied can be profitable. It is the opinion of this author that, in all of the systems, the labor efficiency is key to profit success, even more so than milk production per cow.
It is hoped this study will assist current and aspiring dairy producers, in any of the systems, to analyze and benchmark their dairy operations to better plan for future profits
Introduction
There is great interest in beginning and young (and even experienced) dairy producers in different dairy systems, with particular interests in evaluating dairy farm profitability. The objective of this work is a continuation of the Millionaire Model Dairy Farms project with focus to
generate individual and comparative farm financial analyses across different dairy systems.
Materials and Methods
Thanks to a Risk Management Education (RME) Competitive Grant, ISU Extension and Outreach has created a 2015 comparative analysis of the following three MMDF systems:
1) 5 Conventional Dairy Farms—milking an
average of 276 cows and operating 640 acres. 2) 5 Hybrid Grazing Dairy Farms—milking an
average of 185 cows and operating 294 acres. 3) 11 Organic Grazing Dairy Farms—milking an
average of 80 cows and operating 289 acres. Each farm’s data was entered into the Dairy TRANS Financial Analysis program to analyze profitability. Profitability was determined based on a combination of the following measures:
1) return to unpaid labor per hour
2) cost of milk production per cwt equivalent (cwt eq)
3) rate of return on assets
For each of the MMDF systems, the data was analyzed into three sets: 1) Average 2) Higher Profit and 3) Lower Profit.
Results and Discussion
Comparison Highlights from Average of the Farms
Conventional dairy farms tend to house cows in a confined, freestall facility. These farms tend to have larger herd sizes and more milk production per cow but also the lowest milk price. In 2015, all these statements were true. The average of the Conventional farms sold 25,877 lbs. of milk per cow compared to 17,420 for the average Hybrid Grazing farm and 11,611 for the average Organic farm. Please note that four of the organic farms are “no grain” farms and three of those farms received a $5 premium for the “no grain” feeding practice and earned their way into the Higher Profit group.
The average of the Conventional farms received $16.82/cwt. for their milk in 2015 compared to $17.94/cwt. for the Hybrid Grazing farms and $36.80 for the Organic farms. The average Organic milk price was $35.19/cwt. on the eight Organic farms, not receiving the “no grain” premium. Either way, the Organic milk price was
approximately double the conventional milk price in 2015. The Conventional farms had a cash income of $5,503 per cow with the Hybrid Grazing farms at $3,807 per cow and the Organic farms at $5,179. Conventional farms had 45% higher cash incomes per cow than the Hybrid Grazing farms and 6% higher than Organic farms. However, on average, the conventional farms earned the least return per cow, per labor hour, per dollar of assets and per cwt
equivalent of milk sold. The Conventional farms had a cash income advantage per cow, better than the Organic farms with twice the milk price. It is on the expense side of the equation where the Hybrid Grazing and Organic farms made up the profit difference.
Conventional farms averaged $4,495 of total cash expense per cow compared to the Hybrid Grazing farms at $2,890 and the Organic farms at $2,859 per cow. Net cash income per cow was $1,008 for the Conventional farms; $918 for the Hybrid Grazing farms; and $2,320 for the Organic farms. After inventory changes the Conventional farms earned $955 netfarm income per cow compared to the Hybrid Grazing farms at $1,088 per and the Organic farms at $1,881.
More importantly, after accounting for an equity charge of 4% across all assets (whether monies owned or
borrowed), the Conventional farms had a return to labor of $508 per cow on average relative to the Hybrid Grazing farms at $627 per cow and the Organic farms at $1,173 or approximately double the average of the non-organic farms.
Still, this doesn’t tell the whole story. From a return to unpaid labor hour standpoint, the Conventional farms earned $21.65 per hour; the Hybrid Grazing farms earned $30.89 per hour and the Organic farms earned $23.55 per hour. This number can be compared to earnings from outside (off-farm) labor markets.
From a cost of production standpoint, the
Conventional farms had a milk price of $16.82/cwt of milk sold with a cost of $16.18/cwt eq for a net income of $0.63/cwt eq. The Hybrid Grazing farms had a milk price of $17.94/cwt with a cost of $16.16/cwt eq for a net income of $1.78/cwt eq. The Organic farms had a milk price of $36.80/cwt with a cost of $32.13/cwt eq for a net income of $4.67/cwt eq.
From the other profit measure standpoint, return to assets, which is an all-inclusive measure that marries the net worth statement and the net farm income statement giving a percent return that can be compared to the outside financial markets, shows Conventional farms receiving a 5.89% return to assets; the Hybrid Grazing farms receiving a 6.98% return to assets; and the Organic farms receiving a 7.34% return to assets.
Again, be cautioned this is a small data set. Also realize these were relatively low conventional milk prices and high organic milk prices in 2015. But, the bottom line is both the Hybrid Grazing and Organic farms had a significant profit advantage in 2015 in respect to the return to unpaid labor hours; the net income per cwt eq; net income per cow; and return to assets.
Comparison Highlights from the Higher Profit Farms
The “best of the best” farms were also studied with the understanding that all the farms participating in the study were hand selected as good “Model” farms. The top three Conventional, the top three Hybrid Grazing, and the top six
Organic farms were analyzed with each group representing the top 55-60% of the farms in terms of profitability.
Bottom line with the Higher Profit farms is that all the trends and profit measures, though better, were relatively similar to each other in the same ways as the Average data set, except the Higher Profit Conventional farms were more similar to the Higher Profit Organic farms in terms of return to unpaid labor. The Higher Profit Conventional farms earned $26.00 per unpaid labor hour compared to the Hybrid Grazing farms at $35.47 and the Organic farms at $26.21.
The Higher Profit Conventional farms received $16.56/cwt for their milk with a cost of $15.74/cwt eq for a net income of $0.83/cwt eq; the Hybrid Grazing farms received $17.40/cwt for their milk with a cost of $15.20/cwt eq for a net income of $2.20/cwt eq; the Organic farms received $38.50/cwt for their milk with a cost of $31.82/cwt eq for a net income of $6.68/cwt eq. The Conventional farms had a return to assets of 6.53% compared to the Hybrid Grazing farms at 8.13% and the Organic farms at 8.6%. Depending how one best measures profit, the Hybrid Grazing and Organic farms held on to their profit advantage among the Higher Profit farms.
Other Financial and Production Highlights
This is yet another data set that shows the “system of
milk production” is more important than production per cow. Even comparing just the Conventional farms, the Higher Profit farms had 3% lower milk production than the Average farms. For the Hybrid Grazing farms, the Higher Profit farms had 2.5% less milk per cow. For the Organic herds, the Higher Profit farms had 16% less milk per cow, but this Organic difference is mainly due to the three “no grain” farms with 8,398 lbs. of milk sold per cow in the Higher Profit group.
Labor efficiency seems to be the biggest driver of profits in this data set as well as others done by this author. Capital efficiency and per crop acre efficiencies also seem to play an added part. The returns to unpaid labor hour were highest for the Hybrid Grazing farms, with milk sold per full time equivalent (FTE) laborer at 1,186,200 lbs competitive with the Conventional farms but 3-4 times higher than the Organic farms per FTE laborer. Hybrid Grazing farms milked 68 cows per FTE versus 48 for the Conventional farms and 39 for the Organic farms. Hybrid Grazing farms had total labor costs per cow at $618 versus $833 for the Conventional farms and $1,376 for the Organic farms.
The Hybrid Grazing farms also had a capital efficiency advantage with a capital cost (depreciation and interest) of $813 per cow versus $1,076 for the Conventional farms and $1,376 for the Organic farms. In a relative sense, these items were pretty similar in both the Average (Table 1) and Higher Profit (Table 2) data sets.
So, What’s the Most Profitable Way to Milk Cows?
Bottom line is that all three systems studied can be profitable. Higher conventional milk prices in the $18-$22/cwt. range as we’ve seen in certain years, can make Conventional farms much more competitive over a period of time. Organic milk production has proven its point over the past years as being able to be highly profitable. And, “no grain” milk or Grass Milk® with the $5 premium, even though it may not be the most profitable method to milk cows, is proving itself to be profitable enough to be competitive, if receiving the premium.
The system that seems to show the most consistent profits over time is the Hybrid Grazing group, especially relative to return per unpaid labor hour. Even in 2009, this group showed profits with the very low milk prices so are pretty resilient to risk with conventional milk prices. The Organic producers also have a lower risk system, as long as the organic milk market holds. The Hybrid Grazing system has also proven itself to be a very cost effective and profitable way to allow beginning producers to enter the business with more limited financial and farm facility resources.
It is the opinion of this author that, in all of the systems, the labor efficiency is key to profit success, even more so than milk production per cow. Most of the more profitable farms are milking in a Low Cost TRANS Iowa parlor or similar type.
And, it is believed the higher returns per unpaid labor hour of the Hybrid Grazing farms relative to the Organic farms is due mainly because of economies of herd size (178 vs 73). However, there are many advantages of the practice of rotational grazing that are often dismissed by industry professionals due to the lower production per cow usually associated with grazing versus a confinement type system. So, whether grazing conventionally or with organic systems, the practice of rotational grazing is worth a more serious look by industry professionals and conventional dairy producers.
It is hoped this study will assist current and aspiring dairy producers, in any of the systems, to analyze and benchmark their dairy operations to better plan for future profits.
Note: The “average” is calculated as the sum of the
individual farms for each item, not a previous item’s sum divided by another item’s sum, which yields slightly different results. Thanks to the many dairy producers who so graciously shared their financial data for others to learn from. Thanks to the ISU Extension and Outreach Dairy Team for their review and assistance with this project. For more information visit the ISU Dairy Team at:
www.extension.iastate.edu/dairyteam
Funding for this project was provided by the North Central Extension Risk Management Education Center, the USDA National Institute of Food and Agriculture Award Number 25-6324-0119-302
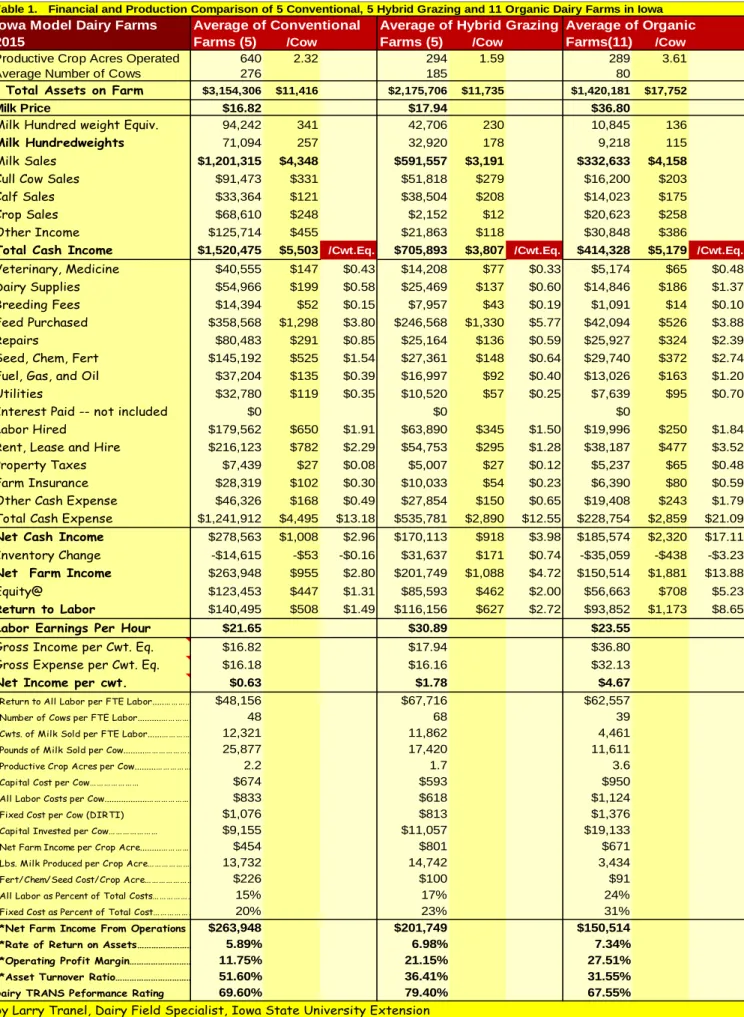
Table 1. Financial and Production Comparison of 5 Conventional, 5 Hybrid Grazing and 11 Organic Dairy Farms in Iowa
Iowa Model Dairy Farms Average of Conventional Average of Hybrid Grazing Average of Organic
2015 Farms (5) /Cow Farms (5) /Cow Farms(11) /Cow
Productive Crop Acres Operated 640 2.32 294 1.59 289 3.61
Average Number of Cows 276 185 80
Total Assets on Farm $3,154,306 $11,416 $2,175,706 $11,735 $1,420,181 $17,752
Milk Price $16.82 $17.94 $36.80
Milk Hundred weight Equiv. 94,242 341 42,706 230 10,845 136
Milk Hundredweights 71,094 257 32,920 178 9,218 115
Milk Sales $1,201,315 $4,348 $591,557 $3,191 $332,633 $4,158
Cull Cow Sales $91,473 $331 $51,818 $279 $16,200 $203
Calf Sales $33,364 $121 $38,504 $208 $14,023 $175
Crop Sales $68,610 $248 $2,152 $12 $20,623 $258
Other Income $125,714 $455 $21,863 $118 $30,848 $386
Total Cash Income $1,520,475 $5,503 /Cwt.Eq. $705,893 $3,807 /Cwt.Eq. $414,328 $5,179 /Cwt.Eq.
Veterinary, Medicine $40,555 $147 $0.43 $14,208 $77 $0.33 $5,174 $65 $0.48
Dairy Supplies $54,966 $199 $0.58 $25,469 $137 $0.60 $14,846 $186 $1.37
Breeding Fees $14,394 $52 $0.15 $7,957 $43 $0.19 $1,091 $14 $0.10
Feed Purchased $358,568 $1,298 $3.80 $246,568 $1,330 $5.77 $42,094 $526 $3.88
Repairs $80,483 $291 $0.85 $25,164 $136 $0.59 $25,927 $324 $2.39
Seed, Chem, Fert $145,192 $525 $1.54 $27,361 $148 $0.64 $29,740 $372 $2.74
Fuel, Gas, and Oil $37,204 $135 $0.39 $16,997 $92 $0.40 $13,026 $163 $1.20
Utilities $32,780 $119 $0.35 $10,520 $57 $0.25 $7,639 $95 $0.70
Interest Paid -- not included $0 $0 $0
Labor Hired $179,562 $650 $1.91 $63,890 $345 $1.50 $19,996 $250 $1.84
Rent, Lease and Hire $216,123 $782 $2.29 $54,753 $295 $1.28 $38,187 $477 $3.52
Property Taxes $7,439 $27 $0.08 $5,007 $27 $0.12 $5,237 $65 $0.48
Farm Insurance $28,319 $102 $0.30 $10,033 $54 $0.23 $6,390 $80 $0.59
Other Cash Expense $46,326 $168 $0.49 $27,854 $150 $0.65 $19,408 $243 $1.79
Total Cash Expense $1,241,912 $4,495 $13.18 $535,781 $2,890 $12.55 $228,754 $2,859 $21.09
Net Cash Income $278,563 $1,008 $2.96 $170,113 $918 $3.98 $185,574 $2,320 $17.11
Inventory Change -$14,615 -$53 -$0.16 $31,637 $171 $0.74 -$35,059 -$438 -$3.23
Net Farm Income $263,948 $955 $2.80 $201,749 $1,088 $4.72 $150,514 $1,881 $13.88
Equity@ $123,453 $447 $1.31 $85,593 $462 $2.00 $56,663 $708 $5.23
Return to Labor $140,495 $508 $1.49 $116,156 $627 $2.72 $93,852 $1,173 $8.65
Labor Earnings Per Hour $21.65 $30.89 $23.55
Gross Income per Cwt. Eq. $16.82 $17.94 $36.80
Gross Expense per Cwt. Eq. $16.18 $16.16 $32.13
Net Income per cwt. $0.63 $1.78 $4.67
Return to All Labor per FTE Labor...………..$48,156 $67,716 $62,557
Number of Cows per FTE Labor...………..48 68 39
Cwts. of Milk Sold per FTE Labor...………12,321 11,862 4,461
Pounds of Milk Sold per Cow...………..25,877 17,420 11,611
Productive Crop Acres per Cow...………2.2 1.7 3.6
Capital Cost per Cow……… $674 $593 $950
All Labor Costs per Cow...………..$833 $618 $1,124
Fixed Cost per Cow (DIRTI) $1,076 $813 $1,376
Capital Invested per Cow……… $9,155 $11,057 $19,133
Net Farm Income per Crop Acre...……….$454 $801 $671
Lbs. Milk Produced per Crop Acre………..13,732 14,742 3,434
Fert/Chem/Seed Cost/Crop Acre……….$226 $100 $91
All Labor as Percent of Total Costs………15% 17% 24%
Fixed Cost as Percent of Total Cost……….20% 23% 31%
**Net Farm Income From Operations (NFIFO).………... Net Cash Income - Accts Pay Adj+ Prepaid Expense Adj + Feed Inventory Adj + Livestock Inventory Adj - Depreciation = NFIFO$263,948 $201,749 $150,514
**Rate of Return on Assets……….5.89% 6.98% 7.34%
**Operating Profit Margin……….11.75% 21.15% 27.51%
**Asset Turnover Ratio……….. [Efficiency]51.60% 36.41% 31.55%
Dairy TRANS Peformance Rating 69.60% 79.40% 67.55%
Table 2. Financial and Production Comparison of 5 Conventional, 5 Hybrid Grazing and 11 Organic Dairy Farms in Iowa
Iowa Model Dairy Farms Higher Profit Conventional Higher Profit Grazing Higher Profit Organic
2015 Farms (3) /Cow Farms (3) /Cow Farms (6) /Cow
Productive Crop Acres Operated 915 2.65 219 1.23 231 3.17
Average Number of Cows 345 178 73
Total Assets on Farm $4,042,839 $11,730 $1,924,223 $10,790 $1,263,154 $17,323
Milk Price $16.56 $17.40 $38.50
Milk Hundred weight Equiv. 121,476 352 41,540 233 7,894 108
Milk Hundredweights 87,797 255 31,881 179 6,121 84
Milk Sales $1,472,132 $4,271 $550,930 $3,089 $236,845 $3,248
Cull Cow Sales $123,876 $359 $41,851 $235 $13,026 $179
Calf Sales $43,726 $127 $37,364 $210 $11,838 $162
Crop Sales $114,350 $332 $0 $0 $18,091 $248
Other Income $185,898 $539 $16,774 $94 $21,012 $288
Total Cash Income $1,939,983 $5,629 /Cwt.Eq. $646,919 $3,628 /Cwt.Eq. $300,812 $4,125 /Cwt.Eq.
Veterinary, Medicine $49,753 $144 $0.41 $9,701 $54 $0.23 $975 $13 $0.12
Dairy Supplies $59,949 $174 $0.49 $24,310 $136 $0.59 $11,842 $162 $1.50
Breeding Fees $18,355 $53 $0.15 $7,655 $43 $0.18 $730 $10 $0.09
Feed Purchased $416,838 $1,209 $3.43 $254,889 $1,429 $6.14 $36,975 $507 $4.68
Repairs $113,630 $330 $0.94 $19,919 $112 $0.48 $17,145 $235 $2.17
Seed, Chem, Fert $204,418 $593 $1.68 $23,935 $134 $0.58 $13,782 $189 $1.75
Fuel, Gas, and Oil $48,586 $141 $0.40 $11,602 $65 $0.28 $8,790 $121 $1.11
Utilities $37,913 $110 $0.31 $8,976 $50 $0.22 $4,519 $62 $0.57
Interest Paid -- not included $0 $0.00 $0 $0.00 $0 $0.00
Labor Hired $248,537 $721 $2.05 $67,291 $377 $1.62 $10,116 $139 $1.28
Rent, Lease and Hire $279,194 $810 $2.30 $31,557 $177 $0.76 $15,923 $218 $2.02
Property Taxes $9,345 $27 $0.08 $5,107 $29 $0.12 $5,491 $75 $0.70
Farm Insurance $35,643 $103 $0.29 $8,899 $50 $0.21 $4,954 $68 $0.63
Other Cash Expense $46,820 $136 $0.39 $28,744 $161 $0.69 $13,757 $189 $1.74
Total Cash Expense $1,568,981 $4,552 $12.92 $502,584 $2,818 $12.10 $145,001 $1,989 $18.37
Net Cash Income $371,002 $1,076 $3.05 $144,335 $809 $3.47 $155,812 $2,137 $19.74
Inventory Change -$19,475 -$57 -$0.16 $52,583 $295 $1.27 -$5,447 -$75 -$0.69
Net Farm Income $351,527 $1,020 $2.89 $196,919 $1,104 $4.74 $150,365 $2,062 $19.05
Equity@ $157,999 $458 $1.30 $75,399 $423 $1.82 $50,157 $688 $6.35
Return to Labor $193,528 $561 $1.59 $121,520 $681 $2.93 $100,207 $1,374 $12.69
Labor Earnings Per Hour $26.00 $35.47 $26.21
Gross Income per Cwt. Eq. $16.56 $17.40 $38.50
Gross Expense per Cwt. Eq. $15.74 $15.20 $31.82
Net Income per cwt. $0.83 $2.20 $6.68
Return to All Labor per FTE Labor...………..$51,170 $78,674 $65,675
Number of Cows per FTE Labor...………..43 69 41
Cwts. of Milk Sold per FTE Labor...………10,756 11,669 3,641
Pounds of Milk Sold per Cow...………..25,165 16,970 9,741
Productive Crop Acres per Cow...………2.68 1.51 3.51
Capital Cost per Cow……… $699 $546 $845
All Labor Costs per Cow...………..$927 $651 $1,100
Fixed Cost per Cow (DIRTI) $1,164 $750 $1,214
Capital Invested per Cow……… $8,826 $10,428 $17,097
Net Farm Income per Crop Acre...……….$370 $923 $741
Lbs. Milk Produced per Crop Acre……….. 9,424 15,542 2,960
Fert/Chem/Seed Cost/Crop Acre……….$211 $118 $75
All Labor as Percent of Total Costs………16.74% 19.21% 25.54%
Fixed Cost as Percent of Total Cost……….21.16% 22.73% 31.25%
**Net Farm Income From Operations (NFIFO).………... Net Cash Income - Accts Pay Adj+ Prepaid Expense Adj + Feed Inventory Adj + Livestock Inventory Adj - Depreciation = NFIFO$351,527 $196,919 $150,365
**Rate of Return on Assets……….6.53% 8.13% 8.60%
**Operating Profit Margin……….12.83% 24.17% 32.64%
**Asset Turnover Ratio……….. [Efficiency]51.16% 35.96% 27.10%
Dairy TRANS Peformance Rating 69.33% 85.67% 75.00%