A Simulation Based Strategy Using Data Envelope Analysis -
Goal Programming for Increasing Customer Satisfaction in a
Chain Store
Bahareh Vaisi1, Sadigh Raissi2 and Ako Vaisi3
1,2
School of Industrial Engineering, South Tehran Branch, Islamic Azad University, Tehran, Iran
3
Young Researchers & Elite club, Central Tehran Branch, Islamic Azad University, Tehran, Iran
Abstract
This paper introduces an ideas and solutions in deciding how to select an appropriate strategy to minimize customer waiting times using a computer simulation model. This method applied on a real case study on the Refah chain stores in Sanandaj based on data gathered during a period of one year at 2013. Applying full factorial design of experiments technique helped to seek on some feasible scenarios. In addition, data envelopment analysis - goal programming technique applied to select the best strategy. The results show that, the optimum scenarios coded by No. 3, 5, 8, 6 and 2 respectively. Proposing a special checkout for customers with less shopping, the average waiting time in this queue according to scenarios No. 6, 8, 2 and 5 goes to zero which enhances the customer satisfaction.
Keywords: Computer Simulation; Customer satisfaction; Design of Experiments; Data Envelopment Analysis; Goal Programming.
1. Introduction
Nowadays, in many companies ’customer satisfaction index’ is considered as one of the key performance indicators, few of them are aware of the importance of this indicator in the company's profitability, though. According to Singh (2006), one of the fundamentally important drivers of organizational success is that enterprisers must take the needs and wants of their customers into account.
Customer service is not the only factor that involves their decide where to buy, but it is an important one. Quality of service can be a competitive privilege for companies and in this way, other factors might be affected.
Most of the customers are not satisfied with chain stores in terms of the products and services they receive so
improving the quality of servicing has a great effect on their satisfactory. Since waiting in line for clients is very uncomfortable, most of their complaints from service providers related to these categories.
Using simulation as a tool for enriching existing systems might be significant because it allows assessing the effect of alterations on the performance of the overall system.
The Oxford English dictionary describes simulation as: “the technique of imitating the behavior of some situation or system (economic, mechanical, etc.) by means of an analogous model, situation, or apparatus, either to gain information more conveniently or to train personnel”. In simulation, a computer is used because of its speed in mimicking a system over a period of time. Again, most of these simulations could (in theory at least) be performed without a computer. But in most organizations, important problems have to be solved quickly. Computer simulation methods have developed since the early 1960s and may well be the most commonly used of all the analytical tools of management science (Pidd, 1986).
In a study, Maria (1997) answered some critical questions regarding an overview of simulation modeling. The paper includes anyone who is involved in system design and modification such as; system analysts, management personnel, engineers, military planners, economists, banking analysts, and computer scientists. The study may useful for those unfamiliar with the area of discrete event simulation.
addition, a number of key notes related to simulation team and managing a simulation project is presented through some guidelines in this study.
A discrete event simulation study of an emergency department in Moncton (Canada) was modeled, analyzed and improved by Duguay and Chetouane (2007). An analysis of waiting times by patient codes demonstrated high waiting times in comparison with Canadian standards. Thus, the objective of the study was to reduce patient waiting times and to improve overall service delivery and system throughput. Model development was made using Arena software.
Brickner et al. (2010) simulate a queuing model useful in a service system with the help of ARENA simulation software. The service calls (henceforth referred to as customers) arrive to a processing center according to a Markovian arrival process (MAP). They observed that servicing calls that arrive in a positively correlated manner incur the largest expected total cost per hour to the system. A review is done on commercial discrete event simulation software and its models by Cimino et al. (2010). In this survey some critical aspects such as domains of application, 3D and virtual reality potentialities, simulation languages and prices is considered. Moreover, a supply chain order performance simulator (SCOPS, developed in C++) is presented for investigating the inventory management problem along the supply chain under dissimilar supply chain scenarios.
Using simulation optimization, a decision support tool for Supply chain coordination (SCC) with contracts was developed by Eskandari et al. (2010). They propose a new linear demand model in order to represent a real competitive price and effort dependent sensitivity. Due to the stochastic nature of the market demand and the interaction between decision variables, simulation employed to model/analyze the SCC with contracts problem as a tool. Solving such problems with traditional mathematical techniques are usually time consuming and subject to rather restricting assumptions. The use of simulation modeling and optimization in the supply chain contracts problem has allowed them to effectively analyze and solve the problem in order to realize the channel coordination and find the optimum or near optimum set of decision variables in the cases of Centralized SC or coordinated supply chain using contracts.
Ibrahim et al. (2012) review some models proposed for call arrivals to a telephone call center (Gans, Koole,
and Mandelbaum 2003; L’Ecuyer 2006; Aksin, Armony, and Mehrotra 2007). These centers have a huge economic importance. A key aspect of their management is to try to optimize their staffing and the work schedules of agents, to minimize the operating cost while providing a sufficiently good quality of service. These models are used both for simulation and to forecast incoming call volumes to make staffing decisions. They evaluate the forecasting accuracy of selected models in an empirical study with real-life call center data.
A literature review of simulation modeling for the provision of social care services presents by Onggo (2012). The review discusses the gap between findings from the literature and challenges in social care policies. The paper shows that the number of research articles on the application of simulation modeling to the provision of care services is limited, especially in the areas of care supply and care delivery methods. Hence, there are good opportunities for simulation researchers who are interested in contributing to improving the provision of social care services. Potential areas in which simulation modeling work can make a real impact (based on the public engagement discussion organized by the UK Department of Health) have been identified. These include the provision of good quality personalized care services (especially the supply side and the use of assistive technologies), the interface between care services and relevant services, intervention and early prevention, and the sustainable financing of care services.
This paper is presented as follows: in section 2 we present the structure of our conceptual model and the performance measures. Section 3 shows computer simulation model of existing system applying enterprise dynamics8 software. In section 4 results and discussion
are shown. Conclusions and further research
recommendations are presented in section 5.
2. CONCEPTUAL MODEL
cosmetics, home appliances, electronics, clothing, textiles and stationeries.
Using ‘oval’ symbol as an entity symbol which has the roll of input in a system and ‘rectangular’ symbol as an activity symbol, Data flow diagram (DFD) is drawn for customers and is indicated in Figure 1.
Fig. 1 Level one of Logical Data Flow Diagram in Sanandaj Refah chain store
For evaluating performance of the system (our case study), some performance measures (PFMs) defined as output variables. These variables are defined as the outputs of computer simulation model. Table 1 shows such PFMs in the presentchain store.
Table1. Performance Measures of Sanandaj Refah chain store (Times in seconds)
3. COMPUTER SIMULATION MODEL
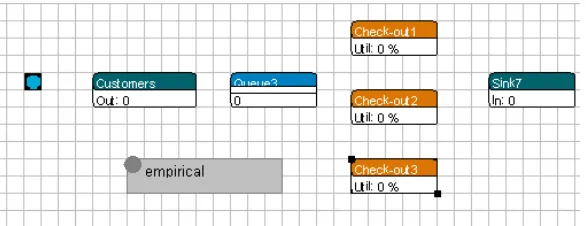
In this section, computer simulation used to model the checkout part of the chain store. Applying Enterprise Dynamics8 (ED) the conceptual model is converted, using the ED routines, and depicted as follows.
Fig. 2 The snap shot of created simulating model using ED software
For modeling the entrance process of Customers, a Source atom was used which is shown in Figure 2 as Customers. Server atom is used to model the mentioned operation related to the Data flow diagram of scanning items and payment process (see Figure 1). Work in process and storage area for work items is indicated as Queue atom like Queue 3.
In Sanandaj Refah hypermarket, there are three checkout lanes available, where after doing shopping the customers go to the checkouts and choose a queue. In each queue, the scanning time per product is 5 seconds and that payment takes 60 seconds.
In order to fully customizing the system in ED, some special 4DScript codes are used to run the simulated current state model accurately. Then, using 4dscript coding in the required atoms, we have these commands in the following Servers, namely Check-out1, Check-out2 and Check-out3. (See figure 2):
Server: Cycle Time= products*5+60.
Initial sampling information is based upon last two months. On Thursdays and Fridays, the days when the study is conducted, the checkouts are open from 9:00 to 20:00 hours. Data of 12:00 to 14:00 were ignored in this study. Each checkout has 1-hour break after working for about 8 hours. An average about 500 shoppers arrive during 8 hours on a random basis. Measurements have shown that the following empirical probability distribution can be used for the number of purchased products. The details are indicated in Table 2.
Table2. Empirical probability distribution for Cycle Times in ED model of Sanandaj Refah chain store
PFMs Description
Y1 Average queue at queue number 3
In addition, based on collected data, statistical characteristics of required atoms are determined and the parameters are recorded in the related atoms. The details are indicated in Table 3.
Table3. Statistical characteristics of required Atoms in Sanandaj Refah chain store (times in seconds)
Input variables
Variable code
Statistical distribution
Parameters
Cycle time of checkout1(in
seconds)
CT1
Cycle time of checkout 2(in
seconds)
CT2
Cycle time of checkout 3(in
seconds)
CT3
Inter-arrival time of customers(in
seconds)
Negative Exponential
λ =1/57.6
Time till first product of customers (in
seconds)
Negative Exponential
λ =1/57.6
Then, the required simulation adjustments for running the model in ED are made.
4. RESULTS AND DISCUSSION
4.1. Applying Simulation of Existing System and
the Validity of Simulation Model
To express the performance of the proposed simulated model, these settings were done in the experimentation
menu. In the experiment wizard the amounts of observation, number of observations and warm up period set on 80, 30 and 8 hours respectively. Afterwards, the results based on the real world situation are taken in to account as follows;
Waiting time in the checkouts is the main problem in this system, which is considered to be decreased.
After the implementation of the current state ED model, it is crucial that the model represents the actual system performance. Accordingly, it is important to validate the simulation model. Chain store Experts and operators in Sanandaj Refah chain store have resolved the graphical difficulties of model and the final model was confirmed by the same key personnel and experts. Additionally, face validation is mainly concerned with making sure our robust model provides useful results by being a close enough approximation to the real system. Here this form of analysis is done by performing a two sample nonparametric Mann-Whitney statistical hypothesis testing on the difference between the mean of
the selected output of the computer simulation model (PFM) and the same data gathered from the real system. Based upon a 23 sample applied in the Minitab TM, p-value of 0.0059 for the Mann-Whitney statistics reject any evidence in mean differences at 10% significance level, consequently the ED model is ready to answer the question for which it was created to answer.
4.2. Design of Experiments
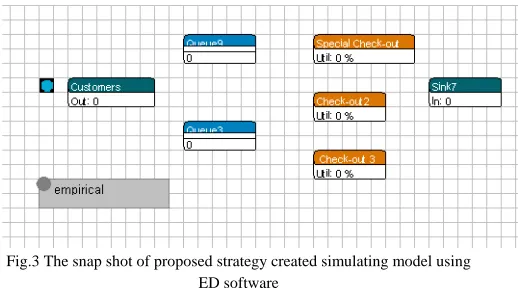
A new strategy is created to improve the situation of Sanandaj Refah chain store based on the expert’s approach. Accordingly, we consider one of the checkouts as a special checkout which is exclusively allocated to those customers who have some specific number of shopping (a defined range of shopping) and other checkouts are assigned to other customers. To implement
PFMs Description
Y1 Average queue at queue3
Y2 Average waiting time at queue3
Y3 Average queue at queue9(special queue)
Y4 Average waiting time at queue9(special queue)
Numb er of produ cts
Probabi lity
Numb er of produ cts
Probabi lity
Numb er of produ cts
Proba bility
this strategy, the following 4DScripts and some other adjustments are made:
Customers: Trigger on creation=
setlabel([items],products,i)
Server: Cycle time= label([items],first(c))*5+60.
In this case, our PFMs are modified and adapted PFMs are shown in Table 4.
Table4. Updated Performance Measures of Sanandaj Refah chain store
An ED model of this strategy is also depicted in Figure 3.
Fig.3 The snap shot of proposed strategy created simulating model using ED software
To design the scenarios based on this new strategy, we use design of experiment (DOE) method and the methodology of full factorial DOE is applied. DOE is a method to identify the important factors in a process then identify and fix the problem in a process. In real engineering settings, there are usually multiple factors involved and it is typically important to consider them together in case they interact.Hence, factorial design is a method to determine the effects of multiple variables on a response. This method reduces the number of experiments one has to perform by studying multiple factors simultaneously. Because factorial design can lead to a large number of trials, which can become expensive and time-consuming, factorial design is best used for a small number of variables with few states (1 to 3). Factorial design works well when interactions between variables are strong and important and where every variable contributes significantly.
Here, input variables called as X1, X2 and X3
respectively for maximum allowable number of shopping in special checkout, breakdowns in each checkout and then repairing time in each checkout.
The following scenarios are defined based on DOE to increase productivity, efficiency and reduce
waiting time in the system. Table 5 presents the coding of ranges in scenarios.
Table5. The coding of ranges in scenarios
Inputs The range
Input variables (X)
Low(-1) High(+1)
X1 5 11
X2 Hr(3) Hr(5)
X3 Hr(0.5) Hr(1)
Then, based on Table 5 and full factorial DOE method, the scenarios are created. Table 6 indicates the results of simulation runs under different scenarios.
Table6. The scenario design based on coded ranges Sce.#
1 2 3 4 5 6 7 8
+1 -1 +1 +1 -1 -1 +1 -1
+1 +1 -1 +1 -1 +1 -1 -1
+1 +1 +1 -1 +1 -1 -1 -1
76.64 146.14 126.57 13.11 147.98 144.46 47.14 146.5
7213.08 12229.57 13142.15 1208.63 13812.1 11086.7 4344.66 11943.94
5.91 0.07 6.16 2.24 0.09 0.04 3.18 0.06
910.96 64.4 1034.72 337.41 111.78 37.96 482.72 57.48
discrimination power for selecting the efficient DMUs will improve.
We here considered each scenario as a DMU, since their inputs and outputs are the same type. Then applying DEAGP model on our data, the efficiency of each scenario is calculated. We have DEAGP model for ‘n’ decision-making unit as follows.
(
)
n j d n j d s r u n j d d x v y u t s d d j j r j j mi i ij rj r s r n j j j ,...., 2 , 1 0 ,...., 2 , 1 0 ,..., 2 , 1 ,...., 2 , 1 1 . . min 1 1 1 = ≥ = ≥ = ≥ = = − + + + − + − = = = + −
∑
∑
∑
ε (1)Where ‘ur’, and ‘vi’ are the weight to be applied to the
outputs and inputs and ‘dj’ be the deviation of efficiency
of decision making unit ‘j’ and ‘Ej’ be the deviation of
ideal efficiency (that is, dj=1-Ej).
Applying model (1) in the Lingo optimization software, this one-stage efficiency computation leads to common set of weights amounts and by using the efficiency scores ‘
∑
∑
= =
m
i i ij rj r s r x v y u 1
1 ’ for each DMU, the relative efficiency of all
DMUs will be evaluated and the results are shown in Table 7.
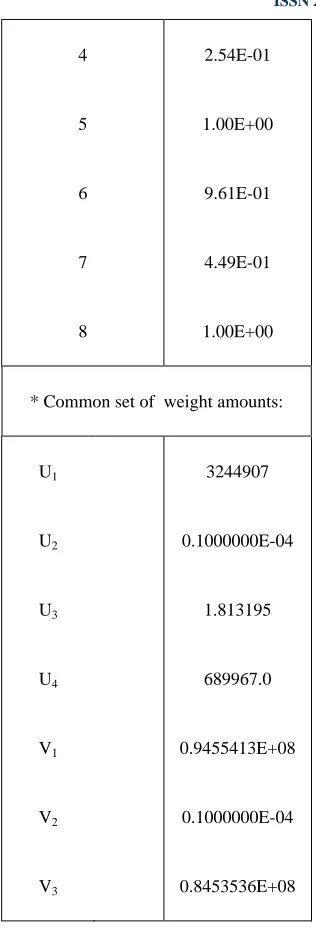
Table7. The performance measurement of scenarios based on DEAGP
Scenario # Efficiency
1 2 3 7.80E-01 9.31E-01 1.00E+00 4 5 6 7 8 2.54E-01 1.00E+00 9.61E-01 4.49E-01 1.00E+00
* Common set of weight amounts:
U1 U2 U3 U4 V1 V2 V3 3244907 0.1000000E-04 1.813195 689967.0 0.9455413E+08 0.1000000E-04 0.8453536E+08
It is clear that, higher efficiency indicates better scenarios, i.e. 1. Therefore, scenarios with numbers ‘3’, ‘5’and also ‘8’ will be helpful in order to improve the situation of this system.
4.3. Results and Discussion
In efficient scenarios:
- Applying scenario ‘8’, the average waiting time at queue number 3 is ‘199’ minutes, which is the minimum waiting time in Q3 out of others.
- Minimum waiting time at queue number 9 is approximately ‘1’ minute, which belongs to the scenarios ‘8’.
- Average number of people in the queue at Q3 based on efficient scenarios are ‘127’, ‘146’ and ‘148’ which is belong to scenarios ‘3’, ‘8’ and ‘5’ respectively.
In all the scenarios:
- Approximately there is not any people who are waiting in the queue of special checkout (Q9), based on scenarios ‘8’, ‘5’, ‘6’ and ‘2’.
- Although minimum stay time in Q9 is about ‘38’ seconds applying scenario ‘6’, minimum stay time in Q3 is ‘20’ minutes applying scenario ‘4’.
- Scenario ‘5’ is one of the efficient scenarios, however average waiting time in the Q3 is ‘230’ minutes which has the maximum amount out of other scenarios.
-Minimum Q3 is ‘13’ people in queue by using scenario ‘4’, while minimum Q9 is about ‘zero’ and this is taken by utilizing scenarios ‘6’, ‘8’, ‘2’ and ‘5’.
5. CONCLUSION
In this study, in order to decrease waiting time in checkouts and improving the service level in the Sanandaj Refah hypermarket, a simulation model proposed, taking into account numerous system constraints and process time logic based on statistical methods. Using some real data, the model validated against waiting time within a 90% confidence interval. Applying Enterprise Dynamics computer simulation model allow us to examine various proposed scenarios virtually without any tray and error in the real world. Significance of time and cost saving seem among the present advantages. This study can be extended for future works in different ways,
- The scenarios will be more complete by extending the defined ranges in DOE.
-The proposed scenarios were focused on decreasing the waiting time in the checkouts, while there are other important factors such as sufficiently good quality of service that affect shopping to be more satisfactory and should be considered.
References
[1] Alhaj Ali, S., Abu Hammad, A., Hastak, M., and Syal, M. “Analysis of a Modular Housing Production System Using Simulation”, Jordan Journal of Mechanical and Industrial Engineering, 2010, 4(2), 256 - 269.
[2] Bourgeois, J., Kravchenko, M., Parsons, N., and Wang, A. 2007. Design of experiments via factorial designs. Date Presented: 12/05/06; Revised: 11/26/07.
[3] Brickner, C., Indrawan, D., Williams, D., and Chakravarthy, S.R. 2010. Simulation of a stochastic model for a service system. In Proceedings of the 2010 Winter Simulation Conference, B. Johansson, S. Jain, J. Montoya-Torres, J. Hugan, and E. Yücesan, eds.
[4] Carson, J. S. 2003. Introduction to modeling and simulation. In Proceedings of the 2003 Winter Simulation Conference, S. Chick, P. J. Sánchez, D. Ferrin, and D. J. Morrice, eds., Piscataway, New Jersey:Institute of Electrical and Electronics Engineers.
[5] Charnes, A., Cooper, W.W., & Rhodes, E. “Measuring the efficiency of decision making units”, European Journal of Operational Research, 1978, 2, 429–444.
[6] Cimino, A., Longo F., and Mirabelli, G. “A General simulation framework for supply chain modeling: State of the Art and Case Study”, IJCSI International Journal of Computer Science Issues, March 2010, 7(3), www.IJCSI.org.
[7] Duguay, C., and Chetouane, F. “Modeling and Improving Emergency Department Systems using Discrete Event Simulation”, SIMULATION, 2007, 83(4), 311–320. [8] Eskandari, H., Darayi, M., and Geiger, C.D. 2010.Using
simulation optimization as a decision support tool for supply chain coordination with contracts. In Proceedings of the 2010 Winter Simulation Conference, B. Johansson, S. Jain, J. Montoya-Torres, J. Hugan, and E. Yucesan, eds., Piscataway, New Jersey:Institute of Electrical and Electronics Engineers.
[9] Ibrahim, R., L’Ecuyer, P., Regnard, N., and Shen, H. 2012. On the modeling and forecasting of call center arrivals. In Proceedings of the 2012 Winter Simulation Conference, C. Laroque, J. Himmelspach, R. Pasupathy, O. Rose, and A. M. Uhrmacher, eds.
[10] Jain, N., and Chaba, Y. “Simulation based performance analysis of zone routing protocol in Manet”. International Journal of Computer Applications, 2014, 88(4).
[11] Kitaw, D., Matebu, A., and Tadesse, S. “Assembly line balancing using simulation technique in a garment manufacturing firm”, Journal of EEA, 2010, 27.
[13] Lora, F., Boff, U., Yurgel, C. C., Folle, L., and Schaeffer, L. “Validation of the computer simulation process applied to the incremental forming process for the evaluation of strain paths”. Key Engineering MaterialsVols,2013, 2453-2461. TransTechPublications,Switzerland.
[14] Maatoug, A., Belalem, G., and Mostefaoui, K. “Modeling and simulation of energy management system for smart city with the formalism DEVS: Towards reducing the energy consumption”. International Journal of Computer Applications, 2014, 90 (18).
[15] Maria, A. 1997. Introduction to modeling and simulation. In Proceedings of the 1997 Winter Simulation Conference, edited by . S. Andradóttir, K. J. Healy, D. H. Withers, and B. L. Nelson.
[16] Moustafa, B.M., and Boumediene, B. “Simulation and optimization of the performance in Hit Solar Cell”. International Journal of Computer Applications, 2013, 80 (13).
[17] Onggo, B.S.S. 2012. Simulation modeling in the social care sector: A literature review. In Proceedings of the 2012 Winter Simulation Conference, C. Laroque, J. Himmelspach, R. Pasupathy, O. Rose, and A.M. Uhrmacher, eds., Piscataway, New Jersey:Institute of Electrical and Electronics Engineers.
[18] Pidd, M. Computer Simulation in Management Science. 1986. Reprinted with corrections, Wiley.
[19] Qayyum, A., and Dalgarno, K. 2012. Improving manufacturing systems through use of simulation. Technical report. School of Mechanical and Systems Engineering, Newcastle University, Newcastle.
[20] Serban, R., and Calin, O. 2012.Developing production strategies using simulation model analysis. Annals of DAAAM for 2012 & Proceedings of the 23rd International DAAAM Symposium, 23(1), Published by DAAAM International, Vienna, Austria, EU.
[21] Simulation Software / TUTORIAL ANNEXES. Enterprise Dynamics® Copyright © 2009 Incontrol Simulation Software B.V. All rights reserved. Papendorpseweg 77, 3528 BJ Utrecht, The Netherlands. www.IncontrolSim.com.
[22] Singh, H. 2006.The Importance of Customer Satisfaction in relation to customer loyalty and retention. UCTI.WP-06-06, Kuala Lumpur, Malaysia.
[23] Vaisi, B., and Raissi, S. “Productivity Improvement in the Pride’s Spare Parts Manufacturing Using Computer Simulation and Data Envelopment Analysis”, International Journal of Computer Applications, 2014, 95(7)..
[24] Vaisi, B. 2009. Achieving common set of weights in data envelopment analysis by using multiple criteria decision making. In Proceeding of the 2th International conference of Iranian Operations Research Society, Babolsar University. [25] Vaisi, B. The superiority of DEAGP in ranking decision
making units over DEA-AHP method: Utilizing relative closeness to ideal decision making units, Management Science Letters, 2012, 2 (8), 2903-2908.
[26] Vonolfen, S., Kofler, M., Beham A., and Affenzeller, M. 2012. Optimizing assembly line supply by integrating warehouse picking and forklift routing using simulation. In Proceedings of the 2012 Winter Simulation Conference, edited by C. Laroque, J. Himmelspach, R. Pasupathy, O. Rose, and A. M. Uhrmacher.
First Author: Bahareh Vaisi. Industrial Engineer, Ph.D.
Candidate.
Second Author: Sadigh Raissi. Associate Prof., IAU-Tehran
South Branch, Ph.D at industrial engineering.
Third Author: Ako Vaisi is a member of the Young