Dynamic Model of Electrical Discharge Machining and Algorithm
of Extreme Control Through Acoustic Signal
Sergey Grigoriev1, Mikhail Kozochkin1, Arthur Porvatov1,Thein Htu M 1, Pavel Zhavoronsky1,Xiaohui Jiang2 and Petr Pivkin1
1
Moscow State Technological University "STANKIN", RU-127055, Moscow, Russia
2
College of Mechanical Engineering, University of Shanghai for Science & Technology, CN-200093, Shanghai, China
Abstract. Electrical discharge machining (EDM) is one of the most accurate methods for machining conductive materials and has a number of important applications. In the EDM process the occurrence of electric charges between cathode and anode is accompanied by vibroacoustic signals, which can be used to develop highly efficient control and diagnostics systems. Experimental studies and modelling of the dynamic system of the EDM process carried out in this study show that parameters of acoustic signals can be used to estimate the current productivity and risks of the tool-electrode breakage and to optimize the tool feed rate. The obtained results of allows using acoustic signals in the control system of the tool electrode feed rate to prevent its breakage, and also setting the interelectrode gap to maximum productivity.
1 Introduction
Electrical discharge machining (EDM) is one of the most high-precision types of machining. Modern CNC machines allow obtaining products with an accuracy of 1 micron at the positioning step of the linear guides being as small as 80-100 nm [1-8]. The field of application of this technology significantly expands in the case, when 4 to 6 independent coordinates are used [9,10]. However, EDM process is married with some issues that lead to unsatisfactory quality of the surface being processed, tool-electrode (TE) breakage and damage of the equipment [11,12]. For example, frequent short circuit leads to increased roughness and decreased performance [13], and, thus, maintaining a stable and high-precision process without a continuous control of the discharge pulses in EDM is impossible [14-17].
Electrical discharge machining occurs in a dielectric medium. The working area is quite small, with the typical size of less than 0.4-0.5 mm, and located at a distance of at least 1-2 mm from the surface of the dielectric medium in the case of full workpiece immersion [18-20] that makes the application of the standard monitoring systems, which are difficult to install in such a way as to have access to the working area, and which cannot deliver critically important information about processes occurring between two electrodes [21-24], pretty much useless.
In the existing EDM equipment, monitoring is usually carried out via the indirect control of electrical parameters, characterizing discharge pulses in the interelectrode gap (IEG) [25-28] such as pattern of the pulses, voltage amplitude, IEG resistivity in the pause between pulses, discharge current, and others [29]. The implementation of such a control system is not an easy
task that involves quite complicated circuitry. In many cases, in order to improve the efficiency of the control system, it is necessary to increase the measuring intervals that in turn leads to the elevated lag of the control system.
Due to the aforementioned difficulties in the monitoring of EDM and its virtually contactless nature, literature contains only a few studies, where non-electric signals are used for the EDM diagnostics. In particular, in [29] temperature of working surfaces of electrodes and hydrodynamic regime in the interelectrode cavity were used as diagnostic parameters.
The temperature of the working surfaces of electrodes is a pretty informative parameter because it adequately reflects multiple processes occurring in IEG. For example, in the case, when the temperature of the electrode surface goes beyond the boiling point of a working fluid, IEG is getting filled with the vapour-gas mixture that increases both the fraction of idle pulses of discharge current and the probability of a short circuit. A significant advantage of this signal is its certainty that allows avoiding corrections in the case of its use in adaptive control systems. This helps to simplify the measurement scheme and the control algorithm. Temperature signal also determines the vector of changes in the working current. The disadvantages of the temperature signal include difficulties with its registration in the die-sinking EDM, which requires measuring the temperature of the hottest spot, and the impossibility of carrying h measurements on machines with wire TE [30-32].
from the pulse generator is spent on the removal of metal from the surface being treated with the EDM. This explains why patents often include estimates of the useful energy of the EDM process based on the coefficient of usage of pulses Cup, defined as the ratio the number of working pulses to the total number generated by the power source. It is assumed that Cup is proportional to the useful fraction of energy. This may be quite a rough estimation because there exist pulses whose energy only partially goes to the removal of material, with the remaining part being spent on the destruction of particles which are a part of the erosion products. In addition, there exist pulses, whose discharges occur in a vapour-gas medium (low-temperature plasma) and, thus, do not perform any useful work [33-36].
In the view of these circumstances, a search for parameters adequately characterizing the efficiency of the EDM process, which can be adjusted to different technological modes, is an important task, the solution of which will make a great contribution to the accuracy and productivity of technologies using electrical erosion processes.
2. The choice of diagnostic parameter
Considering the influence of the electrical parameters of EDM on performance from a formal standpoint, it can be concluded that the performance should increase with increasing amplitude and frequency of supplied voltage pulses and decrease with increasing gap [37-39]. The concentration of erosion products changes in IEG randomly and depends on electrical parameters as well as electrical conductivity and thermal resistance of electrode materials, sublimated particles’ size flushed away by working fluid, velocity and pressure of flushing in IEG.
Fig.1 shows the results of the experiment carried out on the special stand, which allows changing electrical parameters of die sinking EDM process. During the experiment the number of supplying pulses N, and the period of pulse sq. were varying. The performance Q was evaluated based on the volume of the machined hole.
As shown in Fig.1, the dependence of productivityon variable parameters has an extreme nature. It is determined by the rates of receipt and removal of erosion products from the working fluid in the discharge gap
In [40-42], the probability of passage of working pulses at different concentrations of erosion products has been estimated (Fig.2). Another important indicator is the rate, at which productivity decreases with increasing concentration of erosion products. Hence that it is impossible to develop an efficient control system for EDM without accounting for influence of changes in concentrations of erosion products. Under these conditions, a parameter, which is monotonically related to the productivity, is needed for setting the productivity of EDM up to maximum. The vibroacoustic (VA) signal accompanying the technological process can be used as such a parameter.
a)
b)
Fig.1. The dependence of the die-sinking EDM productivity on the number of discharge pulses and the part of the pulse width for the period: a-volumetric graph; b - projection in the plane
Fig. 2.. The dependency of the fraction of working pulses on the percentage concentration of erosion products in the working fluid
A distinctive feature of the edge cutting machining is that the dynamic characteristics of the cutting process are determined by the mutual influence of the parameters of the technological system and the cutting process. This influence significantly complicates the acoustic phenomena occurring during cutting, and makes the dynamic system of the cutting process non-linear that apparently leads to intensive auto oscillations, which alter the interaction between the tool and workpiece, quality of the machined surface and the cutting tool wear rate [43,44].
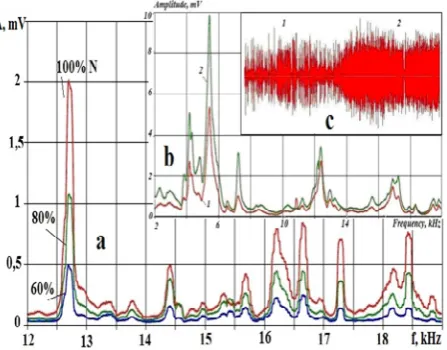
contact between electrode and workpiece, it doesn't cause additional friction of the surfaces. The damping coefficient does not change, do not occur auto oscillations [45]. Experiments carried out for laser machining (LM) and EDM showed that with the increasing power of the energy impact on the workpiece, the amplitude of the VA signal monotonically increases in a wide frequency range [46,47]. In fig. 3 is shown the spectra of the VA signal after LM and EDM effect on the workpiece with different power. The power of the generator changed during the LM, and the frequency of discharge pulses changed during the EDM.
From the spectra shown in Fig. 3, we can conclude that changes in the power of energy flows do not change the position of the spectral maxima of the VA signals, and, accordingly, do not change the amplitude-frequency characteristic of the process. Although the increase in the amplitude of VA signals in different frequency ranges is not strictly proportional, the monotony of the amplitude increases with the increase in the impact power is not disturbed anywhere. For EDM this position is true for the same state of the IEG.
Fig. 3. The spectra of VA signals during laser machining (a) and EDM (b) at different energy deposition powers. In the insert “c”, the sections of recording the VA signal for low (1) and high pulse frequencies are shown
3. The dynamic model of the EDM
process
In Fig. 4, the scheme of the EDM dynamic model, when the accelerometer was set up on the device for fixing the workpiece, is shown. The electrical pulses from the side of TE pass through the working medium by formed discharge channels and impact on the surface of the workpiece. The presence of formed erosion products changes the characteristics of the working medium (that can be in the form of liquid, gas, or even solid-state).
In this model, a complex sequence of impulses coming from the EDM is presented as an accidental process s1(t) with amplitude spectrum S1(f), where f – frequency. The module of working fluid's transfer function H1(f) changes with erosion product’s
accumulation, with changes of distance between electrodes, with changes in temperature.
Fig. 4. Diagram of the dynamic system exposed to EDM
The pulses passed through working fluid and modified within it, (process s2(t)), have a dynamic influence on the elastic system from element having dynamic value with a module of transfer function H2(f). The dynamic effect on the part is mainly due to the reverse of workpiece vapours during the release of erosion products from the crater [37]. The accelerometer is set up on the surface of the part that perceives the vibration (process s3(t)) and results from the impact of the pulse flows, transforms the working fluid, and the flexible system that includes the part. Amplitude spectrum of S3(f) signal received by the acceleration is determined by the following equation (1):
S3(f) = H1(f) H2(f) S1(f). (1)
In Fig. 4 the integrated signal s2(t)+s3в(t) based on the working fluid is shown. The energy of this signal possibly to integrate using signal's energy arising from the interaction of discharges with erosion products and secondary signals s3в(t) entering the working fluid from the vibrations of the workpiece itself. A similar scheme can be built when registering VA signals from the TE. According to this view, when charged beams impact on an elastic system, the form of the signal spectra recorded by the accelerometer changes with changes in the intensity of the impact, which is observed in Fig. 3.
4. Experimental plotting of dynamic
characteristics
comes from CS to the measured current with a constant level having a value of half the supply sensor’s voltage (7.5V).
Meanwhile, the maximal amplitude of the useful signal coming from the sensor is 29, 7 mV (when the measured current was 100 A). It is necessary to synchronize the signal coming from CS with an analogue-to-digital converter (ADC) enter, using information that input band of ADC is ±10 V and 14 bit: 1 – bias the constant level to zero; 2 – increase to +10 V.
For biasing we use differencing amplifier with program gain amplifier and compatible digital resistor, which serve as one of resistance divider’s shoulder. CDR’s value changes discretely from zero to 10 kOhm with 8 bits capacity over the I2C interface. PGA (1) and (2) are made in the form of amplifiers with a controlled amplification factor through a parallel code and provide a amplification factor in the range from 1 to 8000. Microcontroller (MC) from the value of the current signal from the ADC, calculates in real time the necessary bias and amplification factor and generates a control signal for CDR, PGA (1) and (2). A similar automatic control makes possible use input band of ADC and minimizes the impact of digital noise. By the universal serial bus 2.0 (USB 2.0) interface, the signal, which digitized through ADC send to a personal computer (PC) for analysis.
a) b)
Fig. 5. The layout of sensors on EDM machine: а – EDM generator, W – workpiece, TE – tool-electrode, A – accelerometer, CS – current sensor, ADC – analogue-to-digital converter, PC – personal computer; b – scheme of the current sensor
The energy of pulses is a work, which makes pulse in IEG. It is inconvenient to use this parameter in the calculations, therefore, for generators forming voltage pulses regardless of the state of the MEC, it is believed that this energy is proportional to the average current [51,52]. A Hall sensor was used to register the discharge current in experiments. RMS of signals coming from the Hall sensor gave an represent of the energy entering the IEG sensor after amplification and treatment by a high-frequency filter. The signal, depending on the energy, which goes to the removal of the material, came from the accelerometer mounted on the worktable of the machine, where the workpiece was fastened. The signal is filtrated
from low-frequency noise through a high-frequency filter and then its RMS is determined. Its square is proportional to the energy VA of the signal, occurring in an elastic system after the action of perturbations of the working area. Fig. 6 presents the amplitude-frequency response (AFR) of the EDM process: 1 – the beginning of machining; 2 – for a moment before the TE breakage. The graphs show that before the moment of breakage, the value of the dynamic response in the range of 11-13 kHz decreased by almost six times.
Fig. 6.AFR of EDM of cemented carbide at initial machining stage (graph.1) and before the TE breakage (graph. 2).
Fig.7 shows the spectra of the VA signal in the frequency band to 30 kHz at a low concentration of erosion products (graph 1) and the maximum concentration (graph 2).
Fig. 7. Spectra of VA signals over 12 seconds prior to the breakage (1) and over the last second of the operation (2); the inset shows records of VA signal in 2 kHz and 16 kHz octave bands.
5. Monitoring and extreme regulation of
vibroacoustic signal parameters
Until TE breakages, the regulation system can make set up IEG on maximal values. The gap controlling through changings of TE feed rate, but the optimal value depends on the concentration of erosion product. It is possible to regulate the gap by changing the TE feed rate, but the optimal gap’s values depend upon the concentration of erosion products (γ). Fig.8 shows extreme dependences of productivity on the gap and concentration of erosion (γ) [11, 14].
Fig. 8. The spectra of the VA signal 12 seconds before the break (Spectrum 1) and just before the break (Spectrum 2). In the right corner, the examples of VA signal recordings in 2 and 16 kHz octaves are shown
For such type change in the productivity extremum, it is necessary to monitor the situation in the IEG constantly. There should be an observable signal monotonically associated with the productivity of EDM. Such a signal is a VA signal in one of the high-frequency octaves. Experimental researches show that the dependence of the effective (RMS) amplitude of the VA signal (A) on the productivity (Q) in the frequency band of 10-30 kHz can be possibly approximated by the dependence of the form:
А=СQα, (2) where α=0.45-0.55; C-constant, which depends on the location and characteristics of the accelerometer.
Through dependence (2), changing individual steps, the speed applying TE, setting up on extremum of productivity can be changed. Not such type of dependence (2) monotony and uncertainty of the amplitude-performance relationship are important.
At the initial stage of regulation, it is important to determine which side of the optimal value is the value of the IEG. The first step is the feed rate is reduced by one step, and the new value of the signal amplitude VA is compared with the previous one. If it became less, it means that the IEG is more than optimal, and after then the IEG should be increased. There is a start a step-by-step change of TE the feed rate after determining the
direction of the gap's change till the moment when little changes of feed rate don't change the amplitude of VA signal largely. It means that the system is in the area of the extremum.
6 Conclusions
The results of energy flow’s researches using vibroacoustic signals showed that these signals are involved with useful work performed by discharge pulses monotone dependence. This fact allows using them in the control system of the tool electrode feed rate to preventing its breakage and for interelectrode gap setting on maximal productivity. The obtained results show that it is possible to create a multiparametric control system through the vibroacoustic signal. This system will be more efficient compared to similar systems, which based only on the measurement of electrical parameters.
Acknowledgements. The research was supported by the Russian Foundation for Basic Research, grant No. 19-08-00899. This work was carried out using equipment provided by the Center of Collective Use of MSUT "STANKIN".
References
1. J.M. Ali, H.S. Jailani, M. Murugan, Measurement
149, 107029 (2020)
2. T. Muthuramalingam, Journal Of Cleaner
Production 238, 117894 (2019)
3. Z. R. He, C. S. Liu, H. Y. Gao, et al., Applied
Thermal Engineering 162, 114248 (2019)
4. S.N. Grigoriev, M.P. Kozochkin, A.N. Porvatov, et
al., Heliyon 5(10), e02629 (2019)
5. S. Bhattacharya, A. Mishra, N. Keshkar, et al.,
Metallurgical And Materials Transactions A-Physical Metallurgy And Materials Science 50(11), 5336-5355 (2019)
6. E. Uhlmann, D. Oberschmidt, R. Bolz., Procedia
CIRP 68, 649-653 (2018)
7. A.M. Abdul-Rani, A.M. Nanimina, T.L. Ginta,
M.A. Razak, Procedia Manufacturing 7, 510-517 (2017)
8. S.N. Grigoriev, M.P. Kozochkin, S.V. Fedorov, et
al., Measurement Techniques 58(8), 878-884 (2015)
9. Z. Zhao, J. Zhang, Y. Wang, et al., Journal Of
Mechanical Science And Technology 33(7)
3397-3405 (2019)
10. G. Chi, Z. Wang, H. Huang, et al., CIRP
Proceedings, 617 (2010)
11. A.A. Fedorov, A.I. Blesman, D.V. Postnikov, et al., Journal Of Materials Processing Technology 256, 131-144 (2018)
12. M.U. Gaikwad, A. Krishnamoorthy, V.S. Jatti,
13. S.N. Grigoriev, M.P. Kozochkin, E.Yu. Kropotkina, et al. Mechanics & Industry 17(7), 717 (2016)
14. D.S.R. Smart, J.J. Smart, C. Periasamy, et al., IOP
Conference Series-Materials Science and Engineering 346, 012064 (2018)
15. Yu.A. Melnik, M.P. Kozochkin, A.N. Porvatov, et
al., Technologies 6(4), 96 (2018)
16. C. Garcia-Hernandez, R.-M.Gella-Marin,
J.-L.Huertas-Talon, et al., StrojniskiVestnik-Journal Of Mechanical Engineering 62(2), 137-144 (2016)
17. V.N. Gavrin, Yu.P. Kozlova, E.P. Veretenkin, et al.
Physics Of Particles And Nuclei Letters 13(2), 267-273 (2016)
18. M. Zhang, Q. Zhang, G. Zhu, et al., Procedia CIRP
42, 627-631 (2016)
19. A.A.A. Aliyu, J.M. Rohani, A.M.A. Rani, H. Musa,
Jurnal Teknologi 79(1), 119 (2017)
20. M.A. Volosova, A.A. Okunkova, D.E. Povolotskiy,
et al, Mechanics & Industry 16(7), 706 (2015)
21. V. Marrocco, F. Modica, I. Fassi, Journal Of
Manufacturing Processes 43(A), 112-118 (2019)
22. R. Rajeswari, M.S. Shunmugam, International J. Of
Advanced Manufacturing Technology 100(5-8), 1945-1964 (2019)
23. A.V. Isaev, M.P. Kozochkin, Measurement
Techniques 56(10), 1155-1161 (2014)
24. M.P. Kozochkin, F.S. Sabirov, Measurement
Techniques 52, 166 (2009)
25. H. Liu, G. Chi, Z. Wang, et al., International Journal Of Advanced Manufacturing Technology 99(9-12), 2611-2622 (2018)
26. M. Gostimirovic, V. Pucovsky, M. Sekulic, et al.,
Journal Of Mechanical Science And Technology 32(10), 4775-4785 (2018)
27. K.-H. Tseng, C.-Y. Chang, M.-J. Chen, et al.,
Advances In Mechanical Engineering 10(8), (2018) https://doi.org/10.1177/1687814018791705
28. J.F. Liang, Y.S. Liao, J.Y.Kao, et al., International Journal Of Advanced Manufacturing Technology 95(5-8) 1743-1750 (2018)
29. A.K. Sahu, S. Chatterjee, P.K. Nayak,
S.S. Mahapatra, IOP Conf. Ser. Mater. Sci. Eng. 338, 012033 (2018)
30. M.V. Korenblum, M.L. Levit and A.L., Livshits
Adaptivnoe upravlenie electroerozionnimi stankami (Moscow: NIINmash, 1977) [in Russian]
31. B.L. Ovsyannikov, Mathematicheskaya model
electroerozionnogo rezaniya i zadachi upravleniya processom obrabotki. Izvestiya MSTU MAMI, 2(16), 379-385 (2013) [in Russian]
32. M.P. Kozochkin, A.N. Porvatov, F.S. Sabirov,
Measurement Techniques. 555(5), 530-534 (2012)
33. M.K. Sindhu, D. Nandi, I. Basak, Advances In
Manufacturing 6(4), 457-464 (2018)
34. S. Mahanta, M. Chandrasekaran, S. Samanta, et al., J. Of The Brazilian Society Of Mechanical Sciences And Engineering 40, 263 (2018)
35. V.N. Sulakhe, R. Dalu, N. Seth, et al., AIP
Conference Proceedings 2018(1), 020021 (2018)
36. B.P. Mishra, B.C. Routara, Materials And
Manufacturing Processes 33(6), 626-633 (2018)
37. M.P. Kozochkin, A.N.Porvatov, F.S.Sabirov,
Measurement Techniques 56(12), 1414-1420 (2014)
38. V.N.Gavrin, Yu.P. Kozlova, E.P. Veretenkin, et al.
Physics Of Particles And Nuclei 48(1), 5-11 (2017)
39. A.N. Porvatov, M.P. Kozochkin, S.V.Fedorov, et
al. Mechanics & Industry 16(7), 707 (2015)
40. B.A. Artamonov and Yu.S. Volkov, Analiz modelei
elektrokhimicheskoi i elektroerozionnoi obrabotki. Chast’ 2. Modeli protsessov elektroerozionnoi obrabotki. Provolochnaya vyrezka (Moscow: Vseross. Nauchno-issled. Inst. Patent. Inform. 1991) [in Russian]
41. A. Isaev, V.Grechishnikov, P.Pivkin, et al., Procedia CIRP 41, 1023-1026 (2016)
42. M.P. Kozochkin, A.N.Porvatov, Journal Of Friction
And Wear 35(5), 389-395 (2014)
43. N.O. Kavtaradze, A.B. Lipchanskiy, Surface
Engineering and Applied Electrochemistry 2, 3 (1990)
44. M.P. Kozochkin, Russian Engineering Research
29(4), 428-432 (2009)
45. M.P. Kozochkin, Russian Engineering Research
32(4), 387-391 (2012).
46. M. P. Kozochkin, Journal of Friction and Wear
38(4), 333-337 (2017).
47. S.N. Grigor’ev and M.P. Kozochkin, Russian
Engineering Research. 35(11), 801-806 (2015)
48. R. Prathipati, R.Ch, S.P. Dora, the Sn Applied
Sciences 1, 952 (2019)
49. W. Tahir, M. Jahanzaib, A. Raza, Advances In
Production Engineering & Management 14(2), 143152 (2019)
50. S. V. Fedorov, M. D. Pavlov, A. A.Okunkova,
Journal Of Friction And Wear 34(3), 190-198
(2013)
51. E.F. Nemilov, Spravochnik po elektroerozionnoi