Soil Syst. 2018, 2, x; doi: FOR PEER REVIEW www.mdpi.com/journal/soilsystems Article
1
Carbon sequestration and soil restoration potential of
2grazing lands under exclosure management in a
3semi-arid environment of northern Ethiopia
4Tsegay Gebregergs1, Zewdu K. Tessema2, Negasi Solomon3,*and Emiru Birhane3,4 5
1 Shire-Maytsebri Agricultural Research Center, Tigray Agricultural Research Institute, PO Box 81, Shire,
6
Ethiopia; tsegsh690@gmail.com 7
2 Rangeland Ecology and Biodiversity Program, School of Animal and Range Sciences, Haramaya University,
8
PO Box 138, Dire Dawa, Ethiopia Affiliation 2; tessemaz@yahoo.com 9
3 Department of Land Resources Management and Environmental Protection, Mekelle University,
10
P.O. Box 231, 7000 Mekelle, Ethiopia; emibir@yahoo.com & emiru.birhane@mu.edu.et 11
4 Faculty of Environmental Sciences and Natural Resource Management, Norwegian University of Life
12
Sciences, P.O. Box 5003, No-1432 Ås, Norway 13
* Correspondence: solomonnegasi@gmail.com; Tel.: +233279865818 14
Received: date; Accepted: date; Published: date 15
Abstract: Exclosures are used to regenerate native vegetation as a way to reduce soil erosion, 16
increase rain water infiltration and provide fodder and woody biomass in degraded grazing lands. 17
Therefore, this study assessed the impact of grazing exclosure on vegetation biomass, carbon 18
sequestration and soil nutrients under five and ten years of grazing exclosures and freely grazed 19
areas in Tigray, northern Ethiopia. Vegetation biomass, carbon stocks and soil nutrients increased 20
with increasing grazing exclusion. However, open grazing lands and five years of grazing 21
exclosure did not differ in aboveground biomass, above-and-belowground carbon stocks. 22
Moreover, ten years of grazing exclosure had a higher (P<0.01) grass, herb and litter carbon stocks 23
compared to five years exclosure and open grazing lands. The total carbon stock was higher for ten 24
years exclosure (193.3 t C ha-1) than the five years exclosure (154.0 t C ha-1) and in open grazing 25
areas (146.6 t C ha-1). Grazing lands closed for ten years had a higher SOC, organic matter, total N, 26
available P, and exchangeable K+ and Na+ compared to five year’s exclosure and open grazing 27
lands. Therefore, establishment of grazing exclosures had a positive effect in restoring degraded 28
grazing lands, thus improving vegetation biomass, carbon sequestration potentials and soil 29
nutrients under the changing climate and global warming. 30
Keywords: Above-ground carbon stock; Below-ground carbon stock; soil nutrients; exclosure 31
32
1. Introduction 33
Grazing land resources are facing challenges like intense degradation as a consequence of 34
deforestation, agricultural land expansion and continuous heavy grazing [1,2]. In arid and semi-arid 35
grazing lands, overgrazing is one of the most important destructive factors, which causes to the 36
increase of unpalatable species by destroying the most palatable species in the sward and reduce 37
plant cover and biomass, thereby increase erosion hazard and reduce the overall productivity of the 38
land [3,4]. 39
The direct effect of livestock grazing includes consumption of the important plant species and 40
soil trampling, which destroy the structure and composition of plant communities [5]. 41
Determination of herbivore density and proper distribution of livestock in grazing land are the most 42
important issues in grazing land management [6] since vegetation biomass, vegetation height and 43
percentage of plant cover reduced with increasing grazing intensity [7-9]. Accordingly, increasing 44
grazing changes the species composition and endangered the stability of the grazing lands through 45
reducing soil nutrients [10]. Light grazing increases aboveground biomass, canopy cover and height 46
of the species, but from a long-term perspective, moderate grazing would balance the production of 47
different species and livestock production [11]. Vegetation response to different grazing land 48
management practices has been investigated in several studies [5,9,12-14] in which the results 49
indicated that overgrazing of communal grazing lands causes a change in vegetation structure 50
through decreasing the vegetation density and biomass. However, continuous heavy grazing can 51
also affect the carbon sequestration potentials of grazing lands through reduction of carbon 52
accumulation in the soil systems [15-17]. According to Mekuria, et al. [18] soils in areas excluded 53
from gazing had a higher soil organic matter (SOM) contents compared to open grazed areas. Thus, 54
uncontrolled (open) grazing could result in severe degradation of both native vegetation and soil 55
fertility in communal grazing lands in arid and semi-arid environments [13]. 56
Restoration of degraded lands in arid and semi-arid environments often involves excluding 57
livestock from degraded sites [2,13,18,19]. According to Aerts, et al. [20] and [21] exclosures are areas 58
protected from human and domestic animal disturbances with the purpose of regenerating native 59
vegetation and reducing land degradation of the formerly degraded communal grazing lands. 60
Yayneshet, et al. [13] reported that exclosures can be effective in enhancing the composition, 61
diversity, and density of vegetation on degraded grazing lands. Moreover, exclosures can be 62
effective in restoring degraded soils and increase soil carbon in the highlands of Tigray [19]. 63
Accordingly, rehabilitation of degraded communal grazing lands through establishing exclosures 64
has become increasingly important in Tigray region, northern Ethiopia. Hence, approximately 1.5 65
million hectares of land has been excluded from grazing in the last three decades in the highlands of 66
Tigray region [21]. However, information on carbon sequestration and soil restoration potentials of 67
degraded grazing lands after grazing exclusion in semi-arid environments of Tigray region of 68
Ethiopia is lacking under the ever-changing climate and global warming. In the study area, the 69
grazing exclosures were established in 2005 and 2010 in the lowlands of northern Ethiopia. 70
Therefore, we investigated vegetation biomass, above-and-belowground carbon stocks and soil 71
nutrients under five and ten years of grazing exclosures compared to freely (open) grazing areas and 72
along soil depths in semi-arid environment in northern Ethiopia. 73
2. Materials and Methods 74
2.1. Study Area 75
The study site was located in the semi-arid areas of Tselemti district in the northwestern Tigray 76
region of Ethiopia (Figure 1), which is located at 13°05’N Latitude and 38°08’E Longitude. The 77
landscape of the district is characterized with flat plain plateau, mountainous valley and some 78
80
Figure 1: Map of the study area, Tselemti district, in Tigray region, northern Ethiopia 81
82
The mean maximum temperature varied between 33 °C in April to 41.7 °C in May, while the 83
mean minimum temperature is between 15.8 °C in December to 21.7 °C in May. The dry season 84
occurs from November to May, whereas, the main rainy season occurs between June to September. 85
The vegetation cover in the district includes Combretum-Terminalia and Acacia-Commiphora 86
Woodlands which are characterized by small to moderate-sized drought-resistant trees and shrubs 87
with fairly large deciduous leaves. Anogeissus leiocarpus (DC) Guill & Perri, Dichrostachys cinerea (L.) 88
Wight & Am, Dovyalis abyssinica (A. Rich) Warb, Oxythenanthera abyssinica (A. Rich) Munro, Boswellia 89
papyrifera (Del). Hochst, Erytherina abyssinica (DC) and Balanites aegyptiaca (L) Del are some of the 90
dominant woody species in the study area [14]. 91
2.2. Study site selection and field layout 92
A field observation was made throughout the areas to be sampled prior to the field layout for 93
vegetation and soil sampling. Accordingly, sampling sites within five years old exclosures, ten years 94
old exclosures and open grazing lands were selected for data collection. The size/area of the selected 95
sites varied from 60 to 105 ha for open grazing lands and from 72 to 98 ha for grazing exclosures. The 96
exclosures and open grazing lands were assumed to have been on similar conditions before the 97
establishment of the exclosures. To cover the variability in soil and topography, we selected three 98
replicates for each exclosure age and open grazing land throughout the study area. The same site 99
was divided into both exclosure and open grazing land due to the presence of high number of 100
livestock and shortage of grazing land. Hence, the exclosure and the grazing lands were 101
homogenous. To reduce variability as a result of distance, the design for data collection was 102
systematic. We used systematic transect sampling technique to collect the vegetation and soil data 103
within the three sampling sites (Figure 2) under each grazing land management. The first and the 104
last transect lines were laid at least 100 m inside from the edge of the nearest adjacent grazing lands 105
to avoid edge effects. The first sample plot was laid randomly and the others systematically at 100m 106
interval for larger plots (100 m2) and 70m interval for smaller plots(1 m2) along the transect line. At 107
each site, six parallel line transects each with 1000 m long at 200 m intervals from each other was 108
established in each management practice. Plots measuring 10mx10m were systematically taken for 109
grass, herbs and litter (GHL), as well as soil sampling in each transect line, a total of 270 sample 111
quadrats were taken for sampling woody vegetation and 405 sample quadrats for measuring GHL 112
and soil sampling during the study (Figure 2). 113
114 115
Figure 2: Sampling design and plot layout of the experimental site (Key: The small quadrats in the 116
Figure have 1m x 1m size and are allocated for herbaceous species as well as soil sampling. The 117
larger squares in the Figure have 10 m x 10 m size and are allocated for woody species sampling). 118
2.3. Sampling of woody vegetation and carbon stock determination 119
Data on woody vegetation were collected during September to October 2015. In each plot, every 120
tree and shrub having a diameter of ≥2.5 cm at stump height (30 cm from the ground) and breast 121
height (1.30 cm above the ground) circumference were measured with a meter tape and converted to 122
diameter at breast height (DBH). The diameter was measured separately and considered as 123
individual trees when the bole was branched at breast height or below. Moreover, in cases where 124
tree/shrub boles buttressed, DBH was measured from the point just 5 cm above the buttresses. The 125
diameters of multi-stemmed shrubs were measured the same way as single-stemmed trees 126
according to Eshete and Ståhl [25]. The height of woody species was measured using calibrated 127
bamboo stick having 7 m height graduated with 10 cm markings. Trees greater than 7 m in height 128
were measured using clinometers. 129
The biomass and carbon stock of dominant tree/shrub was estimated through allometric 130
equations developed for each tree/shrub species according to previous studies [26,27]. The general 131
allometric equation developed by WBISSP [28] for all woody species were also used for estimating 132
the aboveground woody biomass carbon stocks when species-specific allometric equation is absent. 133
Then, the above-ground woody biomass carbon is calculated from the aboveground biomass using a 134
biomass-carbon conversion factor of 0.5 [29]. Moreover, the below-ground biomass for trees and 135
shrubs was estimated from root-shoot ratios by taking in to account the 27% of above-ground 136
biomass of woody species [30]. 137
2.4. Sampling of herbaceous vegetationand carbon stock determination 138
The aboveground biomass of herbaceous vegetation was measured in a 1 m2 quadrat .from 139
September to October 2015. Destructive sampling method was used for measuring the biomass of 140
grasses and herbs by harvesting the whole fresh vegetation within each quadrat using hand shears. 141
Clipped fresh samples together with litters were well-mixed and weighed in the field using sensitive 142
laboratory to determine an oven-dry-to-wet mass ratio that is used to convert the total wet mass to 144
oven dry mass. The sub-sampled was air dried and latter oven-dried at Mekelle Soil Laboratory at 145
80°C for 24hr according to Rau, et al. [31] until constant weight was obtained and finally re-weighed 146
for their dry weight using a sensitive balance with a precision of 0.1g. Herbaceous vegetation carbon 147
stocks were calculated as 50% of oven-dried herbaceous biomass [32]. 148
2.4. Sampling of soil parameters and laboratory analyses 149
Soil samples were collected in each plot at three soil depths (0-10, 11-20 and 21-30 cm).One soil 150
core sample was also taken from the center of each transect line for soil bulk density (SBD) 151
determination. Equal weights of each sample from a given transect line were pooled and mixed 152
together according to their depth, air dried and passed through a 2 mm sieve to separate debris and 153
gravel. Finally, composite samples were divided into four equal parts, of which one was randomly 154
chosen and stored in plastic bags, labelled, sealed and transported to the soil laboratory for physical 155
and chemical analyses. In the laboratory, soil samples were dried in an oven at 105°C for 24 hours for 156
bulk density analysis. Bulk density was measured using the core method [33] and soil organic 157
carbon was determined by Walkley–black method [34]. Soil texture was analyzed by hydrometer 158
method, pH using a pH-meter in a 1:2.5 soils: water ratio. The percent soil organic matter (SOM) was 159
calculated by multiplying the percent organic carbon by a factor of 1.724 [35]. Total nitrogen was 160
determined by the Kjeldahl method [36], Available K and P were analyzed using ammonium acetate 161
method and Olsen method [37], respectively. Mg and Ca were determined using Atomic Absorption 162
Spectrophotometer and Flame Photometer was used for K and Na [38]. EC was determined using 163
the sodium saturation ratio [39] and cation exchange capacity (CEC) was determined using 164
ammonium acetate method [40]. Soil organic carbon stocks (t C ha-1) in the 0 -10, 11 - 20 and 21 - 30 165
cm depths were calculated according to Pearson, et al. [41]. 166
2.5. Estimation of total carbon stocks 167
The total carbon stock from various carbon pools was calculated by aggregating the carbon 168
stock densities of the individual carbon pools using the equation given by Subedi, et al. [42]. The total 169
carbon stock is then converted to tons of CO2 equivalent by multiplying it by 44/12, or 3.67 [32]. 170
2.5. Estimation of total carbon stocks 171
A General Linear Model (GLM) was applied, to test for differences in all data recorded, with 172
exclosure land management, soil depth and their interactions, as independent factors, and 173
replications, as a random factor. Data were analyzed using SAS Software (SAS Inc., 2002), and 174
results are presented as mean ± S.E. Tukey HSD test was employed to investigate significant 175
differences between means at P ≤ 0.05. However, mean comparison of the interaction effects between 176
exclosure land management and soil depths were not performed for vegetation biomass, 177
above-and-belowground carbon stocks due to the lack of significant effects. Dependent proportional 178
data were arcsine transformed to meet the assumptions of normality and homogeneity of variance. 179
3. Results 180
3.1. Vegetation biomass across grazing land management practices 181
The mean aboveground herbaceous biomass was significantly higher (P<0.001) in the ten years 182
of grazing exclosure than the five years exclosure and the open grazing lands (Table 1). The mean 183
herbaceous dry biomass yield in area exclosures was four times higher than the open grazing lands. 184
However, the lowest GHL biomass was recorded from open grazing land (0.56 dry matter (DM) t 185
ha-1), while the highest biomass (3.08 DM t ha-1) was from the ten years of grazing exclosure (Table 186
1). Age of grazing exclosure had significantly (P<0.001) affected aboveground vegetation biomass as 187
grazing lands excluded from the interference for five years had a lower mean vegetation biomass 188
Woody biomass production varied between 37.2 t ha-1 of DM under ten years of grazing 190
exclosure and 17.6 DM t ha-1 in open grazing lands (Table 1).The mean aboveground woody biomass 191
(AGB) significantly (P<0.001) varied across exclosure land management practices, for instance, the 192
ten years of grazing exclosure had a higher woody biomass (P<0.001) compared to the five years of 193
grazing exclosure and open grazing lands. Belowground biomass significantly differ (P<0.05) 194
between the grazing land management practices being the ten years of grazing exclosure had the 195
highest (10.1 t ha-1) belowground biomass, whereas, the open grazing land had the lowest mean 196
belowground biomass (4.74 t ha-1) in our study. However, belowground biomass did not 197
significantly vary (P>0.05) between the five years grazing exclosure and the open grazing lands in 198
the present study. 199
Table 1: Least square mean of vegetation biomass (DM t ha-1; mean ±SE)under the five and ten 200
years of grazing exclosures and open grazing lands in Tselemti district of Tigray region, northern 201
Ethiopia(n = 270 for woody vegetation aboveground biomass and belowground biomass and n = 202
405 for grasses, herbs and litter biomass). 203
Management practices AGB BGB GHLB TAGB
Open grazing land 17.57±2.46b 4.74±0.67b 0.56±0.38c 18.13±2.22b Five years exclosure 17.83±1.49b 4.82±0.41b 2.67±0.07b 20.50±1.35b
Ten years exclosure 37.23±2.40a 10.10±0.65a 3.08±0.06a 40.31±1.93a P value <0.0001 <0.0001 <0.0001 <0.0001 Means with the same superscripts along columns are not significantly different at P≤0.05. DM = Dry 204
matter; AGB = Aboveground biomass; BGB = Belowground biomass; GHLB = Grasses, herbs and 205
litter biomass; TAGB = Total aboveground biomass; t ha-1 = tone per hectare; SE = Standard error 206
3.2. Aboveground carbon stocks 207
Aboveground carbon stocks increased with duration of grazing exclusion; however, the open 208
grazing lands and five year exclosures did not differ significantly (P>0.05) while the grazing lands 209
closed for ten years differs significantly (P<0.05) with both the five years exclosure and open grazing 210
land (Table 2). The mean aboveground carbon stock under the open grazing lands, five and ten years 211
grazing exclosures were 8.78, 8.92 and 18.62 t C ha-1, respectively. 212
3.3. Belowground carbon stocks 213
The estimated mean belowground carbon stocks for the ten years grazing exclosure (5.05 t C 214
ha-1) was significantly higher (P<0.001) than five year gazing exclosure (2.41 t C ha-1) and open 215
grazing lands (2.37 t C ha-1). However, the mean belowground carbon stocks between the five years 216
grazing exclosure and the open grazing lands did not significantly (P>0.05) differ in the present 217
study (Table 2). 218
3.4. Grasses, herbs and litters carbon stocks 219
Grass, herb and litter (GHL) carbon stocks significantly vary (P<0.001) between open grazing 220
lands, five and ten years grazing exclosures (Table 2). Accordingly, the highest GHL carbon stocks 221
were obtained under the ten years grazing exclosure (1.54 t C ha-1), whereas the lowest GHL carbon 222
stock (0.28 t C ha-1) was recorded under the open grazing lands. 223
3.5. Soil organic carbon stocks 224
Soil organic carbon (SOC) stocks showed a significant variation (P<0.01) between the three 225
grazing land management practices in our study. The highest SOC (168.1 t C ha-1) was obtained 226
grazing lands (Table 2). However, there was no significant (P>0.05) difference in SOC between the 228
five years grazing exclosure and the open grazing lands in our study. 229
3.6. Total carbon stocks across the grazing land management practices 230
The total carbon stock was significantly higher (P<0.001) under the grazing exclosures 231
compared to the open grazing lands. Accordingly, the total carbon stocks for open grazing lands, 232
five and ten years of grazing exclosures were 146.6, 154.0 and 193.3 t C ha-1, respectively (Table 2). A 233
higher total carbon stocks were stored in the soil than in the aboveground vegetation across all 234
management practices. Accordingly, soil carbon stock of open grazing areas, five and ten years of 235
grazing exclosures accounted for 92.2%, 91.8% and 87% of the total carbon stocks, respectively. 236
Hence, the estimated ratios between the mean SOC and aboveground biomass carbon stocks were 237
11.8, 11.2 and 6.7 for open grazing areas, five and ten years of grazing exclosures, respectively. 238
Table 2: Carbon stocks in ton per hectare(mean ±SE) under the five and ten years of grazing 239
exclosures and open grazing lands in Tselemti district of Tigray region, northern Ethiopia(n= 270 240
for woody vegetation aboveground and belowground woody carbon stocks, n =405 for grasses, 241
herbs and litter carbon stocks as well as for soil carbon stock). 242
Management practices AGWCS BGCS GHLCS SOC TCS
Open grazing land 8.78±1.23b 2.37±0.34b 0.28±0.19c 135.18±5.98b 146.6±1.42c
Five years exclosure 8.92±0.75b 2.41±0.20b 1.34±0.35b 141.31±5.95b 154±0.85b Tenyears exclosure 18.62±1.20a 5.05±0.33a 1.54±0.03a 168.12±9.98a 193.33±1.22a
P value 0.0001 0.0001 0.0001 0.0075 0.0001
Means with the same superscripts along columns are not significantly different at P≤0.05. AGWCS = 243
Aboveground woody carbon stocks; BGCS = Belowground carbon stocks; GHLCS = Grasses, herbs 244
and litter carbon stocks; SOC = soil carbon stocks; TCS= total carbon stock; SE = Standard error 245
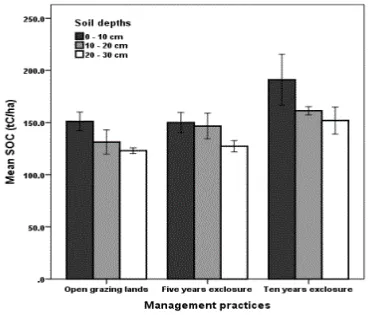
3.7. Soil organic carbon stocks along soil depths 246
The SOC significantly differ (P<0.05) between the three soil depths in each grazing land 247
management practices, as the SOC significantly reduced with increasing soil depths in our study. 248
Accordingly, the higher soil depth (0-10 cm) had a higher SOC compared to the other soil depths (11 249
251
Figure 3: Soil organic carbon stocks (t C ha-1) across grazing land management practices and three 252
soil depths (0 -10, 10 – 20and 20-30 cm) in Tselemti district of Tigray region, northern Ethiopia. 253
3.7. Soil nutrients between land management practices and soil depths 254
The soil textural class for the five and ten years of grazing exclosures was clay loam, while open 255
grazing lands had a sandy clay loam textural classes (Table S1). The mean percentage of sand 256
recorded in open grazing lands, five and ten years of grazing exclosures were 49.1, 41.3 and 41.3, 257
respectively, while their corresponding mean clay and silt values were 25.2, 24.9, 30.3 and 25.7, 33.8, 258
28.3, respectively. The silt and sand particle size fractions were higher in the topsoil layer than in the 259
middle and lower soil depths across the grazing land management practices. In contrast, the clay 260
particle was slightly higher in the middle soil depth compared to the top and lower soil depths 261
across the grazing land management practices (Table S1). 262
Age of exclosure, soil depth and their interactions had no significant (P>0.05) effect on the sand 263
and clay contents of the soil in our study. The silt content was not significantly (P >0.05) affected by 264
the soil depth and its interaction with grazing land management practices, whereas, the silt content 265
in the five years of grazing exclosure had significantly (P<0.05) higher percentage of silt content 266
compared to the ten years of grazing exclosure and open grazing lands (Table S1). Moreover, bulk 267
density had significantly varied (P<0.001) across the soil depths and grazing land management 268
practices in the present study. 269
Available P showed significant variations (P<0.001) with grazing land management practices, 270
soil depths and their interaction (Table S1). Available P across soil depth ranged from 4.69 ppm for 271
the topsoil depth (0-10 cm) to 2.7 ppm for the lower soil depth (21-30cm). Available P varied 272
significantly across management practices from 3.03 ppm in the open grazing lands to 4.68 ppm in 273
the ten years of grazing exclosure. Soil organic carbon and exchangeable K+ were significantly 274
highly significantly varied (P<0.001) between the grazing management practices, as low as to 0.06% 276
in the open grazing lands to as high as 0.15% for the ten years of grazing exclosure (Table S1). Soil 277
pH and EC did not significantly vary (P<0.05) across the soil depths, grazing land management 278
practices and their interactions. 279
However, cation exchange capacity and exchangeable bases varied significantly (P<0.01) across 280
soil depths and management practices in our study (Table S1). Open grazing lands had a lower 281
exchangeable Ca++, Mg++and K+ compared with the five and ten years of grazing exclosures (Table 282
3). Moreover, the ten years of grazing exclosure had a higher exchangeable Na+ (0.41 C mol (+)/kg) 283
compared with five years grazing exclosure (0.31 C mol (+)/kg) and the open grazing lands (0.29 284
Cmol (+)/kg). In terms of soil depth, OC, OM, TN%, AP, exchangeable K+ and Na+ reduced with 285
increasing soil depths, whereas, pH, EC, Ca++, Mg++ and CEC increased with increasing soil depth 286
in the present study (Table S1). 287
4. Discussion 288
4.1. Biomass yield of aboveground vegetation 289
The lowest vegetation biomass in open grazing lands compared to the five and ten years of 290
grazing exclosures in our study could be due to continuous heavy grazing, which negatively affects 291
the growth of plant species. This finding is in line with Yayneshet, et al. [13] who reported that more 292
than double aboveground biomass has been produced under grazing exclosures than open grazing 293
lands in the highlands of Tigray region of Ethiopia. Besides, Snyman [43] and Li, et al. [44] also 294
reported that accumulation of aboveground vegetation biomass declined with grazing land 295
degradation, reduction in basal cover and root biomass, and change in species composition, leading 296
to a less aboveground biomass production at higher grazing pressure compared to a lower grazing 297
pressure. 298
The extent of woody vegetation biomass variation across grazing land management practices in 299
our study could be due to the variation in the size of tree species, as the interference herbivores (both 300
grazers and browsers), as well as human disturbances in the open grazing lands could lead to a 301
significant reduction of total woody plant density. Five years of grazing exclosure had lower woody 302
biomass than the ten years of grazing exclosure due to the difference in the size of trees. Hence, 303
higher distribution and proportion of sapling and seedling stages in the five years of grazing 304
exclosure had a lower contribution for aboveground woody biomass reported in our study [14]. 305
According to Witt, et al. [45], aboveground woody biomass increases with grazing exclusion due to 306
the regeneration potentials of tree and shrub species. Likewise, some studies in semi-arid Kenya 307
[46], in semi-arid Azerbaijan [47], and in southern Mongolian desert steppes [48] showed that 308
aboveground biomass increased following the establishment of grazing exclosure on communal 309
grazing lands, which might be due to the higher abundance and density of woody vegetation, which 310
had more potential to produce larger quantities of above-and-belowground biomass compared to 311
the open grazing lands. 312
4.2. Carbon stocks 313
The highest aboveground carbon stock in ten years exclosures might be due to the availability 314
of higher aboveground biomass in ten year exclosures as compared with five years exclosure and 315
open grazing lands. The lowest aboveground carbon stocks in open grazing lands could be due to 316
loss of carbon stocks as a result overcutting and trimming of trees/shrubs by local people for fences, 317
charcoal production and other purposes. The mean aboveground carbon stocks for the ten years of 318
grazing exclosure recorded in our study is similar within the tropical forests [49] and deciduous 319
woodlands in the north-western lowlands of Ethiopia [15]. However, the aboveground carbon 320
rangelands enclosed for about 20 years in the southern parts of Ethiopia [12]. Moreover, the mean 322
carbon stock in our study was higher than the carbon stocks reported in the Nile basin [5], in 323
highlands of Tigray region of Ethiopia [17] and in the shrublands of northern Kenya [24]. 324
The mean belowground carbon stocks of the ten years of grazing exclosure were higher than the 325
five years of grazing exclosure and open grazing lands, which might be due to the higher biomass of 326
woody species in grazing exclosures. The belowground carbon stock in our study is similar to 327
belowground root carbon stocks reported from the deciduous woodlands in the lowlands of 328
Ethiopia [15]. However, the belowground carbon stocks found in this study was higher compared to 329
the belowground carbon stocks reported in the semi-arid pastoral areas of northern Kenya [24]. 330
A higher grass, herbs and litters (GHL) carbon stocks were found in the ten years of grazing 331
exclosure compared to the five years of grazing exclosures and open grazing lands in our study. This 332
might be due to the fact that continuous heavy grazing in open grazing lands inhibits the growth of 333
herbaceous layers and decrease aboveground herbaceous biomass through direct removal, leading 334
to the depletion of GHL carbon stocks and soil nutrients. Our result is in agreement with previous 335
studies [12,16,17] who reported a significant difference in herbaceous carbon stocks between gazing 336
land exclosures and open grazing lands. Moreover, the herbaceous carbon stocks reported in our 337
study under the open grazing lands is almost similar to herbaceous carbon stocks in the untapped 338
Boswellia woodlands in the north-western lowlands of Ethiopia [15]. Our result indicated that 339
exclusion of eroded and degraded grazing lands from animal interferences had a positive effect on 340
the accumulation of herbaceous vegetation and litter carbon stocks. 341
The ten years of grazing exclosures had the highest SOC, whereas, the lowest SOC was 342
recorded in the open grazing lands (135.2 t C ha-1) in our study. The differences in SOC stocks 343
between the ten years of grazing exclosure and open grazing lands could be as a result of the 344
increased vegetation biomass and the subsequent production and decomposition of litterfall from 345
this vegetation that would add OM into the soil systems. Thus, grazing lands with more 346
aboveground vegetation biomass contribute more to the soil carbon sequestration potential as 347
compared to grazing lands having less aboveground vegetation biomass. This finding is in 348
agreement with Bikila, et al. [12] and Mekuria [17] who reported that SOC was markedly higher for 349
exclosures than the open grazing areas. Sheikh, et al. [50] and Fynn, et al. [51] also reported that high 350
SOC mass was recorded in the protected areas. 351
The contribution of area exclosures to SOC improvement is controlled by several factors that 352
include level of land degradation, composition of plants, climatic factors, duration of grazing 353
exclosures, as well as land use type and management practices of the areas. In our study, the overall 354
belowground carbon pool was greater than the corresponding overall aboveground carbon pool in 355
each grazing land management practice. 356
The total carbon stocks were highest in the ten years of grazing exclosure compared to the five 357
years of grazing exclosure and open grazing lands in this study. Moreover, across the grazing land 358
management practices, a higher total carbon stock was stored in soil than in the aboveground 359
vegetation. According to Girmay, et al. [52] more than 90% of the total carbon stocks were 360
contributed from SOC in wooded grassland of northern Ethiopia. In our study, the ratio between the 361
mean SOC and aboveground carbon stock were 11.81, 11.15 and 6.66 for open grazing areas, five and 362
ten years of grazing exclosure, respectively. This is in agreement with Sheikh, et al. [50] and Fynn, et 363
al. [51] who reported that the soil contains about three times more organic carbon than the 364
aboveground vegetation. The decrease in SOC with increasing soil depths in our study was in line 365
with Bikila, et al. [12]. 366
The lowest silt percentage in the open grazing lands might be due to wind and water erosion as 368
a result of higher bare-ground and low basal cover due to the low aboveground biomass through 369
continuous heavy grazing. However, exclusion of grazing lands from grazing and trampling for five 370
years had a positive effect on silt percentage but not for sand and clay percentage. Areas excluded 371
from grazing had a lower soil bulk density than open grazing lands while there is no significant 372
variation between young and old exclosures in our study, indicating that excluding of livestock from 373
degraded grazing areas had a significant effect on soil bulk density. 374
The higher available P and TN% recorded from the ten years of grazing exclusion could be due 375
to the higher accumulation and decomposition of litters into the soil. The results for the OC, TN% 376
and AP was in agreement with the reports of Yimer, et al. [53] who stated that the relative increase in 377
the soil parameters in exclosures is due to the management establishment and subsequent increased 378
organic matter accumulation derived from litterfall from the trees/shrubs and herbaceous species 379
biomass and from reduced soil erosion through effective ground cover. Besides, the increases in 380
canopy cover with the increase in exclosure duration could decrease soil nutrient losses by reducing 381
the erosive impact of raindrops and soil erosion [54,55]. 382
5. Conclusions 383
The establishment of area exclosures on degraded communal grazing lands had positive effect 384
in restoring vegetation biomass, carbon sequestration potentials and soil nutrients of eroded 385
communal grazing lands. The aboveground biomass and carbon stocks increased with duration of 386
grazing exclusion; however, the open grazing lands and five years of grazing exclosure did not differ 387
significantly in our study. A similar pattern was observed for belowground carbon stocks and soil 388
organic carbon stocks that the grazing lands excluded for ten years from grazing differed 389
significantly with both the five years closed area and the open grazing lands. The grass, herbs and 390
litter carbon stocks were the highest in the ten years of grazing exclosure, amounting almost more 391
than five times the value recorded in the open grazing lands. Similarly, the overall total carbon stock 392
was highest for the ten years of grazing exclosure followed by the five years of grazing exclosure and 393
open grazing areas. In the present study, higher total carbon stock was stored in soil than in the 394
aboveground vegetation across all grazing land management practices. Therefore, establishment of 395
area exclosures needs to be widely practised in the semi-arid areas of the region to enhance 396
vegetation biomass, carbon sequestration potentials and soil nutrient contents. Moreover, further 397
studies on temporal and spatial vegetation biomass and carbon stocks need to be thoroughly 398
investigated to capture the whole dynamics of the grazing land ecosystems under various regimes of 399
grazing exclusions in arid and semi-arid environments. 400
401
Supplementary Materials: The following are available online at www.mdpi.com/xxx/s1, Table S1: 402
Physical and chemical soil properties under the five and ten years of grazing exclosures and open 403
grazing lands (n = 405) in Tselemti district of Tigray region, northern Ethiopia, with statistical 404
results of GLM (F, P values). 405
Acknowledgements: The write-up of the paper was supported by the Steps Toward Sustainable Forest 406
Management with the Local Communities in Tigray, Northern Ethiopia (ETH 13/0018) funded by 407
NORAD/NORHED. We also thank Mekelle University. 408
Author Contributions: T.G. conceived and designed the study; T.G. collected and analyzed the data and wrote 409
the paper; Z.T., E.B. and N.S. critically reviewed the paper and provided comments on the contents and 410
structure of the paper. 411
Conflicts of Interest: The authors declare no conflict of interest. 412
References 414
1. Lemenih, M.; Karltun, E.; Olsson, M. Soil organic matter dynamics after deforestation along a farm 415
field chronosequence in southern highlands of Ethiopia. Agric. Ecosyst. Environ. 2005, 109, 9-19. 416
2. Mengistu, T.; Teketay, D.; Hulten, H.; Yemshaw, Y. The role of enclosures in the recovery of woody 417
vegetation in degraded dryland hillsides of central and northern Ethiopia. J. Arid Environ. 2005, 60, 418
259-281. 419
3. O'Connor, T.G.; Haines, L.M.; Snyman, H.A. Influence of precipitation and species composition on 420
phytomass of a semi‐arid African grassland. J. Ecol. 2001, 89, 850-860. 421
4. Bot, A.; Benites, J. The importance of soil organic matter : key to drought-resistant soil and sustained food and 422
production. Food and Agriculture Organization of the United Nations: Rome, 2005. 423
5. Mekuria, W.; Langan, S.; Johnston, R.; Belay, B.; Amare, D.; Gashaw, T.; Desta, G.; Noble, A.; Wale, A. 424
Restoring aboveground carbon and biodiversity: a case study from the Nile basin, Ethiopia. Forest 425
Science and Technology 2015, 11, 86-96. 426
6. Liang, Y.; Han, G.; Zhou, H.; Zhao, M.; Snyman, H.A.; Shan, D.; Havstad, K.M. Grazing Intensity on 427
Vegetation Dynamics of a Typical Steppe in Northeast Inner Mongolia. Rangeland Ecol. Manage. 2009, 428
62, 328-336. 429
7. Abule, E.; Smit, G.N.; Snyman, H.A. The influence of woody plants and livestock grazing on grass 430
species composition, yield and soil nutrients in the Middle Awash Valley of Ethiopia. J. Arid Environ. 431
2005, 60, 343-358. 432
8. Tessema, Z.K.; de Boer, W.F.; Prins, H.H.T. Changes in grass plant populations and temporal soil seed 433
bank dynamics in a semi-arid African savanna: Implications for restoration. J. Environ. Manage. 2016, 434
182, 166-175. 435
9. Tessema, Z.K.; de Boer, W.F.; Baars, R.M.T.; Prins, H.H.T. Changes in soil nutrients, vegetation 436
structure and herbaceous biomass in response to grazing in a semi-arid savanna of Ethiopia. J. Arid 437
Environ. 2011, 75, 662-670. 438
10. Aghakhani, M.H.; Borj, A.A.N.; Tavakoli, H. The effects of grazing intensity on vegetation and soil in 439
Sisab rangelands, Bojnord, Iran. Iranian Journal of Range and Desert Research 2010, 17, 243-255. 440
11. Wei, L.; Hai-Zhou, H.; Zhi-Nan, Z.; Gao-Lin, W. Effects of grazing on the soil properties and C and N 441
storage in relation to biomass allocation in an alpine meadow. Journal of soil science and plant nutrition 442
2011, 11, 27-39. 443
12. Bikila, N.G.; Tessema, Z.K.; Abule, E.G. Carbon sequestration potentials of semi-arid rangelands 444
under traditional management practices in Borana, Southern Ethiopia. Agric. Ecosyst. Environ. 2016, 445
223, 108-114. 446
13. Yayneshet, T.; Eik, L.O.; Moe, S.R. The effects of exclosures in restoring degraded semi-arid 447
vegetation in communal grazing lands in northern Ethiopia. J. Arid Environ. 2009, 73, 542-549. 448
14. Gebregerges, T.; Tessema, Z.K.; Birhane, E. Effect of exclosure ages on woody plant structure, 449
diversity and regeneration potential in the western Tigray region of Ethiopia. Journal of Forestry 450
Research 2017, 10.1007/s11676-017-0512-6. 451
15. Alemu, B. Carbon Stock Potentials of woodlands and land use and land Cover changes in north 452
16. Solomon, N.; Birhane, E.; Tadesse, T.; Treydte, A.C.; Meles, K. Carbon stocks and sequestration 454
potential of dry forests under community management in Tigray, Ethiopia. Ecological Processes 2017, 6, 455
20. 456
17. Mekuria, W. Changes in regulating ecosystem services following establishing exclosures on 457
communal grazing lands in Ethiopia: a synthesis. Journal of Ecosystems 2013, 2013, 12. 458
18. Mekuria, W.; Veldkamp, E.; Haile, M.; Nyssen, J.; Muys, B.; Gebrehiwot, K. Effectiveness of exclosures 459
to restore degraded soils as a result of overgrazing in Tigray, Ethiopia. J. Arid Environ. 2007, 69, 460
270-284. 461
19. Mekuria, W.; Veldkamp, E.; Corre, M.D.; Haile, M. Restoration of Ecosystem Carbon Stocks Following 462
Exclosure Establishment in Communal Grazing Lands in Tigray. Soil Sci. Soc. Am. J. 2011, 75. 463
20. Aerts, R.; Nyssen, J.; Haile, M. On the difference between “exclosures” and “enclosures” in ecology 464
and the environment. J. Arid Environ. 2009, 73. 465
21. Seyoum, Y.; Birhane, E.; Mengistu, T.; Esmael, N.; Hagazi, N.; Kassa, H. Enhancing the role of the 466
forestry sector in Ethiopia forest management practices in Tigray region with emphasis on area exclosure; 467
Center for international Forestry Research (CIFOR): 2015. 468
22. Mannetje, L.t.; Jones, R.M. Field and laboratory methods for grassland and animal production research. CABI 469
Pub.: Wallingford, Oxon, UK; New York, NY, USA, 2000, 470
http://dx.doi.org/10.1079/9780851993515.0000.
471
23. Hasen-Yusuf, M.; Treydte, A.C.; Abule, E.; Sauerborn, J. Predicting aboveground biomass of woody 472
encroacher species in semi-arid rangelands, Ethiopia. J. Arid Environ. 2013, 96, 64-72. 473
24. Dabasso, B.H.; Taddese, Z.; Hoag, D. Carbon stocks in semi-arid pastoral ecosystems of northern 474
Kenya. Pastoralism 2014, 4, 5. 475
25. Eshete, G.; Ståhl, G. Functions for multi-phase assessment of biomass in acacia woodlands of the Rift 476
Valley of Ethiopia. For. Ecol. Manage. 1998, 105, 79-90. 477
26. Brown, S. Estimating biomass and biomass change of tropical forests : a primer. Food and Agriculture 478
Organization of the United Nations: Rome, 1997. 479
27. Henry, M.; Picard, N.; Trotta, C.; Manlay, R.; Valentini, R.; Bernoux, M.; Saint André, L. Estimating 480
tree biomass of Sub-Saharan african forests: a review of available allometric equations. Silva Fenn. 481
2011, 45, 477-569. 482
28. WBISSP. Manual for woody biomass inventory. Woody Biomass Inventory and Strategic Planning 483
Project, Ministry of Agriculture: Addis Ababa, Ethiopia, 2000. 484
29. Liu, X.; Ekoungoulou, R.; Loumeto, J.J.; Ifo, S.A.; Bocko, Y.E.; Koula, F.E. Evaluation of carbon stocks 485
in above- and below-ground biomass in Central Africa: case study of Lesio-louna tropical rainforest of 486
Congo. Biogeosciences Discuss. 2014, 2014, 10703-10735. 487
30. Penman, J.; Gytarsky, M.; Hiraishi, T.; Krug, T.; Kruger, D.; Pipatti, R.; Buendia, L.; Miwa, K.; Ngara, 488
T.; Tanabe, K., et al. Good practice guidance for land use, land-use change and forestry. Institute for Global 489
Environmental Strategies: Kanagawa Prefecture, 2003, p v + 593 pp. 490
31. Rau, B.M.; Johnson, D.W.; Blank, R.R.; Chambers, J.C. Soil carbon and nitrogen in a Great Basin 491
pinyon–juniper woodland: Influence of vegetation, burning, and time. J. Arid Environ. 2009, 73, 492
472-479. 493
32. Pearson, T.; Walker, S.; Brown, S. Sourcebook for land use, land-use change and forestry projects. Winrock 494
33. Klute, A. Methods of Soil Analysis: Part 1—Physical and Mineralogical Methods. Soil Science Society of 496
America, American Society of Agronomy: Madison, WI, 1986; 10.2136/sssabookser5.1.2ed.frontmatter. 497
34. Walkley, A.; Black, I.A. An examination of the degtjareff method for determining soil organic matter, 498
and a proposed modification of the chromic acid titration method. Soil Sci. 1934, 37, 29-38. 499
35. Brady, N.C.; Weil, R.R. The Nature And Properties Of Soils. 10* Edition. Macmillan Publishing 500
Company. p: New Delhi, India 1990. 501
36. Bremner, J.M.; Mulvaney, C.S. Nitrogen—Total1. In Methods of Soil Analysis. Part 2. Chemical and 502
Microbiological Properties, Page, A.L., Ed. American Society of Agronomy, Soil Science Society of 503
America: Madison, WI, 1982; 10.2134/agronmonogr9.2.2ed.c31pp 595-624. 504
37. Olsen, S.R.; Sommers, L.E. Phosphorus. In Methods of Soil Analysis. Part 2. Chemical and Microbiological 505
Properties, Page, A.L., Ed. American Society of Agronomy, Soil Science Society of America: Madison, 506
WI, 1982; 10.2134/agronmonogr9.2.2ed.c24pp 403-430. 507
38. Jackson, M.L. Soil chemical analysis. Prentice-Hall, Inc.; Englewood Cliffs: New Delhi, India, 1958. 508
39. Van Reeuwijk, L. Procedures for Soil Analysis, 3rd edition. International Soil Reference Centre 509
Wageningen (ISRIC): Wageningen, Netherlands, 1992; Vol. 3. 510
40. Chapman, H.D. Cation-Exchange Capacity1. In Methods of Soil Analysis. Part 2. Chemical and 511
Microbiological Properties, Norman, A.G., Ed. American Society of Agronomy, Soil Science Society of 512
America: Madison, WI, 1965; 10.2134/agronmonogr9.2.c6pp 891-901. 513
41. Pearson, T.R.; Brown, S.L.; Birdsey, R.A. Measurement guidelines for the sequestration of forest carbon. US 514
Department of Agriculture, Forest Service, Northern Research Station: Washington, D.C, 2007. 515
42. Subedi, B.P.; Pandey, S.S.; Pandey, A.; Rana, E.B.; Bhattarai, S.; Banskota, T.R.; Charmakar, S.; 516
Tamrakar, R. Forest Carbon Stock Measurement: Guidelines for measuring carbon stocks in 517
community-managed forests; Asia Netw Sustain Agric Bioresour Fed Community For Users, Int Cent 518
Integr Mt Dev Katmandú: Nepal, 2010; p 69. 519
43. Snyman, H.A. Rangeland degradation in a semi-arid South Africa—I: influence on seasonal root 520
distribution, root/shoot ratios and water-use efficiency. J. Arid Environ. 2005, 60, 457-481. 521
44. Li, W.; Cao, W.; Wang, J.; Li, X.; Xu, C.; Shi, S. Effects of grazing regime on vegetation structure, 522
productivity, soil quality, carbon and nitrogen storage of alpine meadow on the Qinghai-Tibetan 523
Plateau. Ecol. Eng. 2017, 98, 123-133. 524
45. Witt, G.B.; Noël, M.V.; Bird, M.I.; Beeton, R.J.S.; Menzies, N.W. Carbon sequestration and biodiversity 525
restoration potential of semi-arid mulga lands of Australia interpreted from long-term grazing 526
exclosures. Agric. Ecosyst. Environ. 2011, 141, 108-118. 527
46. Verdoodt, A.; Mureithi, S.M.; Van Ranst, E. Impacts of management and enclosure age on recovery of 528
the herbaceous rangeland vegetation in semi-arid Kenya. J. Arid Environ. 2010, 74, 1066-1073. 529
47. Peper, J.; Jabbarov, A.S.; Manthey, M. Short-time effects of grazing abandonment on semi arid 530
rangelands in Azerbaijan. Annals of Agrarian Science 2014, 8, 11-14. 531
48. Wesche, K.; Ronnenberg, K.; Retzer, V.; Miehe, G. Effects of large herbivore exclusion on southern 532
Mongolian desert steppes. Acta Oecol. 2010, 36, 234-241. 533
49. Chaiyo, U.; Garivait, S.; Wanthongchai, K. Carbon storage in above-ground biomass of tropical 534
deciduous forest in Ratchaburi Province, Thailand. International Journal of Environmental, Chemical, 535
50. Sheikh, M.A.; Kumar, M.; Bussmann, R.W. Altitudinal variation in soil organic carbon stock in 537
coniferous subtropical and broadleaf temperate forests in Garhwal Himalaya. Carbon Balance Manag. 538
2009, 4, 6. 539
51. Fynn, A.J.; Alvarez, P.; Brown, J.R.; George, M.R.; Kustin, C.; Laca, E.A.; Oldfield, J.T.; Schohr, T.; 540
Neely, C.L.; Wong, C.P. Soil carbon sequestration in US rangelands. Environmental Defense Fund, 541
Sacramento, CA 2009. 542
52. Girmay, G.; Singh, B.R.; Mitiku, H.; Borresen, T.; Lal, R. Carbon stocks in Ethiopian soils in relation to 543
land use and soil management. Land Degradation & Development 2008, 19, 351-367. 544
53. Yimer, F.; Alemu, G.; Abdelkadir, A. Soil property variations in relation to exclosure and open 545
grazing land use types in the Central Rift Valley area of Ethiopia. Environmental Systems Research 2015, 546
4, 17. 547
54. Girmay, G.; Singh, B.R.; Nyssen, J.; Borrosen, T. Runoff and sediment-associated nutrient losses under 548
different land uses in Tigray, Northern Ethiopia. Journal of Hydrology 2009, 376, 70-80. 549
55. Mekuria, W.; Veldkamp, E.; Haile, M.; Gebrehiwot, K.; Muys, B.; Nyssen, J. Effectiveness of exclosures 550
to control soil erosion and local community perception on soil erosion in Tigray, Ethiopia. Afr J Agric 551
Res 2009, 4, 365-377. 552
© 2018 by the authors. Submitted for possible open access publication under the terms 553
and conditions of the Creative Commons Attribution (CC BY) license 554