THE
DETERMINANTS OF MOBILE PHONE TECHNOLOGY ADOPTIONIN KENYA
LUKAS MUKOMA MUSEMBI
A RESEARCH PROJECT SUBMITTED TO THE DEPARTMENT OF APPLIED ECONOMICS IN THE SCHOOL OF ECONOMICS IN PARTIAL
FULFILMENT OF THE REQUIREMENT FOR THE AWARD OF THE
DEGREE OF MASTER OF ECONOMICS OF KENYA TTA UNIVERSITY
JUNE 2015
DECLARATION
This research project is my original work and has not been presented for a degree award inany other university or for any other award
Signature ~.~ Date
~~/
.
.
f
!
.
.
~!)~
.
LUKAS MUKOMA MUSEMBI
Bachelor of Arts (Economics) Kenyatta University K102IPT112064/2009
This research project has been submitted for presentation with our approval as university supervisors
Signature ~ Date..
j
0:
.
~
.
~I.s
:
.
Mr. Patrick M. Kuuya
Department of Applied Economics
Kenyatta University
Signature
Czy
.
.
! Date'l>J
.
1
.
\)
.ll!?1[
.
~ Dr. Emmanuel Manyasa
Department of Applied Economics
ACKNOWLEDGEMENT
First, am sincerely grateful tothe almighty God who has granted me opportunity and good health throughout this study period. I would like to thank my supervisor Mr. Kuuya and Dr. Manyasa for their commitment, support and guidance in the preparation ofthis document. I am sincerely thankful to them for taking time to work with me through this endeavor and ensuring successful realisation of this research project. Special thanks to various members of the School of economics for their invaluable insights and moral support. Finally Iwish to extend my appreciation to my wife Mercy for her support and prayers.
DEDICATION
I dedicate this project to my wife Mercy and daughter Brianna.
TABLE OF CONTENTS
DECLARATION ii
ACKNOWLEDGEMENT iii
DEDICATION , iv
TABLE OF CONTENTS v
LIST OF TABLES viii
LIST OF FIGURES ix
ABBREVIATIONS ANDACRONYMS x
OPERATIONAL DEFINITION OF TERMS xi
ABSTRACT xii
CHAPTER ONE 1
INTRODUCTION 1
1.1 Background 1
1.1.1 Historical Background 1
1.1.2 Technology specific factors 6
1.1.3 Economic factors and policies 8
1.1.4 Human/ adopter characteristics : 12 1.1.5 Channels of Communication and other factors 14
1.2 Statement of the Problem 15
1.3 Research questions 16
1.4 Objective ofthe study 17
1.5 Significance of the study 17
1.6 Scope of the study 18
CHAPTER TWO 19
LITERATURE REVIEW 19
2.1. Introduction 19
2.2. Theoretical Literature 19
2.3. Empirical Literature 24
2.4. Overview of the literature 28
CHAPTER THREE 30
RESEARCH METHODOLOGY 30
3.1. Introduction 30
3.2. Research Design 30
3.3. Theoretical framework 30
3.4. Model Specification 35
3.5. Description and measurement of variables 36
3.6. Study area 38
3.7. Target population 38
3.8. Sampling technique 39
3.9. Research instrument 40
3.10. Pilot study 40
3.11. Data collection procedure .41
3.12. Data entry and cleaning 41
3.13. Data analysis 41
3.14. Multicollinearity test 41
3.15. Diagnostic Tests 42
3.14.1 Goodness offit test .42
3.14.2 Overall evaluation of the model using likelihood ratio test.. 42
CHAPTER FOUR 43
EMPIRICAL FINDINGS 43
4.1 Introduction 43
4.2 Response Rate 43
4.3 Descriptive statistics 43
4.3.1 Human/adopter characteristics 44
4.3.2 Economic factors 45
4.3.3 Technology Specific factors .49
4.4 The regression analysis 50
4.4.1 Multicollinearity test 50
4.4.2 The regression Results 51
4.5 Results interpretation 53
4.5.1 Technology specific characteristic 53
4.5.2 Human/adopter characteristics 54
4.5.3 Economic factors 55
4.6 Diagonistic Test of the logit model 56
4.6.1 Goodness of Fit test.. 56
4.6.2 Overall evaluation ofthe model using the likelihood ratio test.. 57
CHAPTER FIVE 59
SUMMARY, CONCLUSIONS AND RECOMMENDATIONS 59
5.1 Introduction 59
5.2 Summary 59
5.3 Conclusions 60
5.4 Policy Implications 61
5.5 Contribution to Knowledge 62
5.6 Limitation of the study 62
5.7 Suggestions for further research 62
REFERENCES 64
APPENDICES 70
LIST OF TABLES
Table 3.1: Definition and measurement ofYariables 36 Table 3.2: Nairobi County population per constituency 40
Table 4.1: Sex of the Respondents 44
Table 4.2: Age bracket of the Respondent 44
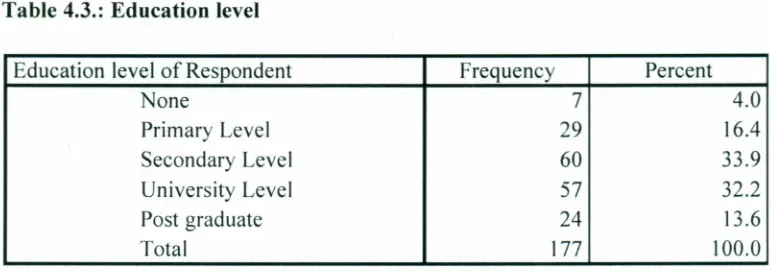
Table 4.3: Education level .45
Table 4.4: Level of income 45
Table 4.5: Period acquired current phone .46
Table 4.6: Purchaser of the Phone 46
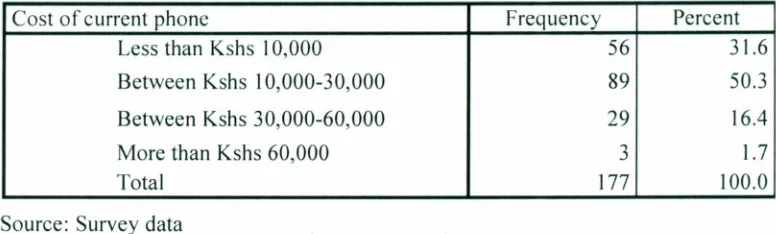
Table 4.7: Cost of the current phone .47 Table 4.8: Cross-tabulation of income level and current phone cost.. 47 Table 4.9: Cross-tabulation of age bracket and cost of mobile phone 48 Table 4.10: Preference of mobile phone size 49 Table 4.11: Technical Specifications Considerations 49
Table 4.12: Pairwise matrix 51
Table 4.13: Regression Results of log of odd ratios estimates 52
Table 4.14: Marginal effect results 53
Table 4.15: Analysis of human/adopter characteristic 54 Table 4.16: Analysis of economic factors 55 Table 4.17: Goodness of fit test results 56 Table 4.18: Likelihood-ratio test results 58
LIST OF FIGURES
Figure 1.1: Mobile subscriber growth 3
Figure 1.2: Subscriber Vs SIM Penetration rates in selected countries 4
Figure 1.3: Mobile network operators market shares 11
CA GDP GSM GSMA ICT ITU MNO MTR NRA PSTN SIM SMS IG 2G 3G
ABBREVIA TIONS AND ACRONYMS
Communication Authority of Kenya
Gross Domestic Product
Global system for mobile communication
Global system for mobile communication association
Information and Communications Technologies
International Telecommunication Union
Mobile Network Operator
Mobile Termination Rate
National Regulatory Authorities
Public Switched Telephone Network
Subscriber Identity Module
Short Message service
I st Generation mobile Services
2nd Generation mobile Services yd Generation mobile services
OPERA TIONAL DEFINITION OF TERMS
Adoption: Adecision tomake full use of an innovation asthe best course of action available.
GSM (Global Systemfor Mobile communication): is adigital mobile telephony system that is widely used in Europe and other parts of the world. GSM uses a variation of time division multiple access (TDMA) and is the most widely used of the three digital wireless telephony technologies.
Mobile phone technology adoption: This isdefined as the decision tomake full use of mobile phone technology as the best course of action available.
Mobile phone technology subscriber: Refers to the subscriptions to a public mobile telephone service and provides access to Public Switched Telephone Network (PSTN) using cellular technology, including number of pre-paid SIM cards active during the past three months.
Perceived ease-ofuse (PEOU): This is defined as the degree to which a person believes that using a particular system would be free from effort.
Perceived usefulness (PU): This isdefined as the degree to which a person believes that using a particular system would enhance his or her job performance.
Subscriber: This refers to an entity or person that contract to receive or pay for a mobility service.
Unique mobile subscribers: Refers tothe number of people who subscribe tomobile services and can actively use multiple connections.
ABSTRACT
Even though mobile phone technology has brought new possibilities to the country suchas mobile money transfer services, the unique mobile subscriber penetration rate in Kenya is below 50 percent. This means that Kenya is below the global level of optimization of mobile phone technology adoption that can act as an engine for economic growth. The economic importance of mobile phone technology as a communication tool, facilitator of financial transfer and a medium for access to information cannot be over-empasized. Indeed, timely adoption and appropriate use of easily and widely available mobile phone technology is one opportunity that may helpthe country in realizing the digital mobile phone platform opportunities that exist. It is against this background that this study aimed to bridge the knowledge gap by investigating the primary determinants of mobile phone technology adoption. The main objective ofthis study was to establish the main determinants of mobile adoption in Kenya. The specific objectives were: To determine mobile phone technology characteristics that influences its adoption in Kenya; to determine the human characteristics that drive adoption of mobile phone technology in Kenya and to determine the economic factors that drive adoption of mobile phone technology. The study was guided by non-experimental research design. Cross sectional data drawn from a randomly selected sample of 177 respondents was used in the study. The descriptive statistics show that adopters were keen onanumber of technology specific characteristic, namely the ability of the mobile phone to access internet and the memory size of the mobile phone. The logit model was used to estimate the determinants ofmobile phone technology adoption. The regression results ofthe study indicate that all economic factors i.eincome level of the adopter and cost ofthe mobile phone device, were important determinants of mobile phone adoption, while sex was the only significant human/adopter characteristic. All technology specific factors were found not to be statistically significant.
CHAPTER ONE
INTRODUCTION
1.1 Background
1.1.1 Historical Background
Mobile phone technology adoption began on 3rd April, 1973 when a Motorola employee, Mr. Martin Cooper, using prototype Motorola DynaTAC made the first publicly recorded mobile phone call during apress conference in New York City. This innovation would later evolve into an integral component of the social and economic development of people across the globe. Soon after, production of mobile phone became commercialized in the early 80's with the first adopters being male executives whose companies provided the phone as an office perk. These early mobile phones were not very mobile as most were car mounted. They allowed the user to talk on a telephone during dead time such as when stalled in traffic. Among the innovative businessmen who adopted the mobile phones were building contractors for whom the cell phone fitted well with their highly mobile nature of work (Gruber and Verboven, 2001).
Telecommunication Union (ITU) in 2003 suggested that the world would continue to
add mobile lines faster than fixed lines; indeed, the next billion new phone users
would use primarily mobile phones.
Rogers (2003) defines adoption as a decision to make full use of an innovation as the
best course of action available and the rate of adoption as the relative speed with which
an innovation is adopted by members of a social system. There has been a rapid
adoption of mobile phone technology which has generated a great deal of speculation
and optimism regarding its effect on economic development in the country and in the
continent at large. Indeed, the rapid adoption of mobile phones in developing
countries in the world has far exceeded expectations.
In 1999, for example, the Kenyan service provider Safaricom projected that the
mobile phone market in Kenya would reach three million subscribers by 2020.
However, Safaricom, alone, had over 19 million subscribers by the end of 2013
(Communication Authority of Kenya (CA), 2013). Mobile phone services were launched in Kenya in I992.However, adoption of mobile phone technology in Kenya
was not smooth. When mobile phones services were first introduced to the country in
1992, a single device cost about USD 3995 (Techhive, 20 15).This was sufficient to
guarantee that the mobile phone would remain a product for the elite. In fact, in the
first seven (7) years of mobile history in Kenya, the industry only gained 15, 000
subscriptions. The tipping point came in 1998 when the communications sector was
liberalised through an Act of Parliament. Until then, the Kenya Posts and
Telecommunication Corporation (KPTC) had dominated the communications sector.
Figure 1.1 shows mobile phone subscriber growth in Kenya since 1999 to 2013.
2011
2013 "1-1
---...o!--- ..•..
---""""'----!'" 30,549,422 1!
---~
....
---129,430,072--- •••••---" 25,279,768
'
---
..
1
•
---...
1 20•
,118,363I 17,67[7,321
12,933,653 I I
2001 2009
2003
I i
~'-_____ ~r,304,818
c 6.484,7"1 , [4,611,970
~ 2,546,157
F
'
1,590,785 1,187,122Ir
585,131 IJ
114,000 ' I 15,000o
5,000,000 10,000,000 15,000,000 20,000,000 25,000,000 30,000,000 35,000,000 •...2007III CII > 2005
1999
-~
---L~--- ,
Subscription
Figure 1.1: Mobile subscriber growth
Source: Communication Authority of Kenya (CA)
Mobile subscriber base has grown from a mere 15,000 to a staggering 30.6 million subscribers byJune 2013 (CA, 2013). Noteworthy, most subscribers in Kenya are on the pre-paid option with 99 percent ofthe 30.6 million subscribers or less than 450,000 on post-paid subscription. As at the end of June 2013 the number of mobile phone subscriptions in Kenya stood at 30.6 million. However, these figures potentially overestimate or underestimate the actual number of mobile phone users, because many individuals own several handsets or have multiple subscriber identity module (SIM) cards. At the same time, there could be potentially more than 30.6 million mobile phone users, as sharing mobile phones is a common practice in Africa and indeed in Kenya. Nonetheless, these figures indicate that mobile phone technology adoption has grown significantly inthe country.
Despite the phenomenal growth in mobile telecommunication in African countries, there is still untapped market as evidenced bylow number ofunique mobile subscriber
penetration per 100 inhabitants in most countries. Figure 1.2 shows Unique Subscriber
Penetration and SIM penetration rates as at June 2013.
140,0% ~-,,,
I 120,0%
r
100,0% -,,- 1)IT,711To" -. 96.7%
Nigeria
---, ---
=r-«
!South Africa
Unique Subscriber Penetration • Sim Penetration
Figure 1.2: Subscriber Vs SIM Penetration rates inselected countries Source: GSMA Intelligence
As atJune 2013, despite the relatively high SIM penetration of over 70percent, Kenya
had a low unique subscriber penetration rate of 30.5 percent, while Nigeria and
Tanzania had 28.6 and 31.0 percent penetration respectively. South Africa was the
only country that recorded SIM penetration of more than 100 percent and unique
subscriber penetration of more than 50 percent. The rapid adoption of mobile phones
has generated a great deal of speculation and optimism regarding its effect on
economic development in Africa. Policymakers, newspapers, and mobile phone
companies have all touted the poverty reduction potential ofmobile phones (Corbett,
2008).One way mobile phone adoption can have positive effect on poverty reduction
is through improving labour productivity in day-to-day economic activities of low
income earners who have not yet adopted the phone.
A study by David (1990) showed that in the US, it was only when the adoption level
of ICT hit the 50 percent mark that ICT had a positive impact on national labour
productivity. If it is assumed that the mobile phone component of ICT is to Kenya
today what the computer was tothe US in the 1970's and 1980's, a case can be made
for increasing the level of the unique subscriber penetration from its current 30.5
percent to over 50 percent and thereby increase labour productivity in the country.
This begs thequestion as to what factors determine mobile phone adoption in Kenya.
Anumber of studies to determine the determinants ofmobile adoption in Kenya have
been carried out and most of them have utilized the Technology Acceptance Model
(TAM) as a tool of analysis (Mwasaa, 20I0 and Meso, Musa and Mbarika, 2005).
TAM is an information systems adoption theory that models how users come to accept
and use a technology. The model suggests that when users are presented with anew
technology, a number of factors influence their decision about how and when they
will use it,notably: Perceived usefulness (PU), which was defined as the degree to
which a person believes that using a particular system would enhance his or her job
performance, and perceived ease-of-use (PEOU) which he defined as the degree to
which a person believes that using a particular system would be free from effort
(Davis,1989:1993).
Mobile phone technology is rapidly evolving both globally and in the country.
Certainly, it can be observed that 'mobile phones in Kenya are evolving from simple
communication tools into service delivery platforms. The current evolution was not
envisaged by previous studies in Kenya by Mwasaa (20I0) and Meso e.tal (2005) in
their respective studies on consumer use of mobile Information and Communication
Technology. A proper understanding of the determinants ofmobile phone technology
5
adoption is critical if Kenya is to grow its unique mobile subscriber levels of 30.5
percent (as atthe end of June 2013) to at least 50 percent.
1.1.2 Technology specific factors
Technology usually has two components: a hardware aspect, consisting of the tool
that embodies the technology as a material or physical object, and a software aspect,
consisting of the information base for the tool (Rogers, 2003). Getting knowledge on
a new technological innovation creates thoughts of its consequences in minds of
potential adopters; such as if the innovation will solve an adopter's current problem
(Rogers, 2003). For the potential user of the phone, the problem to solve would be
something in the lines of how to enable quicker access to Internet or how many
applications are available.
Technological characteristic can be considered as a factor that can affect the mobile
services adoption. Technological improvement could lead to a better user experience
in using the mobile services (Hyvonen and Repo, 2004). The interest in technology
has been identified as a factor that leads to the adoption of mobile services (Hyvonen
and Repo, 2004). Improvement in technology contributes to reduction in cost of
production (hence the steep drop in the price of cellular phone), improved service
quality bythe mobile handset produced and ultimately the attitude towards use.
For something to be an innovation, it doesn't matter whether the idea is objectively
new, but how the innovation isperceived. Aphone may not have any truly new ideas,
butif the potential adopters perceive itas new, then itcan be counted as aninnovation.
A new product may be based on a technological advance that results inareduced cost
of production for the product leading to a lower selling price to consumers. In fact
consumers might even question whether an innovation has the same features as it was
originally (Rogers, 2003). In Kenya for example as recent as 2010 the cheapest 3G
enabled phone was going for KES 25,000. However, by the end of 2013 3G phones,
such as Android powered Samsung's Erica and Huawei's U5130 models were going
for KES 2,999 (Safaricom website, 2014).
Mobile telecommunication technology generations can be distinguished by specific
improvements in service capabilities. First generation (1 G-analogue) mobile
telecommunication technologies were introduced in the early 1980s for voice services
which was relatively inefficient and unreliable. There was a relatively large number
of different first generation systems (based on seven mutually incompatible national
standards) installed globally
As soon as digital technology (second generation, 2G) had matured enough to present
a credible alternative to analogue cellular, itwas introduced gradually across the world
(Dekimpe, Parker and Sarvary, 2000). Second generation mobile telecommunication
technologies were introduced during the first half of the 1990s. These technologies
provided capabilities for improving voice services and the capabilities of developing
improved and new data services. The GSM standard was the first mobile technology
to be used ina large number of countries and became the most widespread system by
a substantial margin, both interms of adopting countries and subscribers.
Second generation telephony displayed significant technological progress, with
handsets becoming smaller and containing an increasing number of additional
functions (Koski and Kretschmer, 2007). In addition to ongoing technological
innovations on the product side, pricing and services became increasingly sophisticated. 20 phones also had SMS functionality, which enabled users to send short text messages to each other and was a huge success among younger users age 18-24, especially in Asia and Europe (Koski and Kretschmer, 2007). Following the success of20, a third generation (30) with more advanced data transmission facilities was developed and has been widely adopted in major cities in Kenya. The improvement in technology that has changed the character and usage of mobile phones has been a contributory factor to the adoption of mobile phone technology.
1.1.3 Economic factors and policies
One of factor that has led to faster adoption of mobile phone technology adoption in Kenya is the relatively cheaper cost of rolling out mobile phone networks as compared to the cost of installing fixed networks. Whereas the telecommunications industry in the United States, Canada and Europe invested in landlines before moving to mobile phone networks, the mobile phone technology has effectively leapfrogged the landline in Africa.This might be attributed to the fact that landlines require transmission wires be installed along every road reserve and into every community, with smaller transmission lines into every household which can be economically limiting, especially in countries with poor road networks, vast distances and low population densities. Mobile phone coverage in sub-Saharan Africa, by contrast, is primarily provided via a network of specialized base stations, which can provide service to a
5-10 kilometer radius.
Over the years the rise in disposable income of the consumer population has been contrasted by the reduction in the cost of mobile handset. This could also have been a
major contributor tothe adoption of mobile phone technology in Kenya. For instance,
in 1999 the minimum monthly wage in the cities of Nairobi, Kisumu and Mombasa
for an unskilled worker was KES 2,886 (Economic Survey, 2004) while the cost of
the cheapest handset was costing over KES 300,000. Conversely, in 2013 the
minimum monthly wage for an unskilled worker in the cities of Nairobi, Kisumu and
Mombasa was KES 9,780.95 (Economic survey, 2014) while the cost of a mobile
phone handset was as low as KES 999 (Midcomstore, 20 14).lndeed, with the current
prices of mobile handset most of the Kenyan population can easily afford a phone
given theprevailing minimum monthly wage rate for employees and relatively higher
incomes of low income earners.
Usage remains a factor of disposable income and as mobile phone adopters from
different social classes behave in different ways; their income influences their
acquisition of cellular products and the level of spending on such services. Status
plays an important role and adopters might acquire cellular phones to enhance their
status. Madden et al., (2004) conclude that higher income and a large user base tend
topromote mobile diffusion. Indeed, this study will investigate the level of income as
adeterm inant of mobile phone technology adoption.
Economic factors include cost of technology considerations. Low cost of mobile
handsets as aresult of improvement in technology has also been an important factor
inadoption of mobile phone technology in the country. When mobile phones services
were first introduced to the country in 1992, asingle device cost approximately KES.
343,570 (unadjusted for inflation)-(Tech-hive, 20 15).This was sufficient to guarantee
that the mobile phone would remain a product for the elite. In fact, in the first seven
(7) years ofmobile history in Kenya, the industry only gained 15,000 subscriptions.
The first mobile phone adopters in Kenya were primarily male, educated, young,
wealthy and urban populations, as the initial costs of handsets and services were
relatively high. As adoption rate increased secondary adopters spanned the
demographic spectrum which included more poor, elderly and rural individuals, in
part facilitated bythe introduction of lower-priced handsets.
Higher household income could also represent, simultaneously, greater time-saving
motivations to use mobile phone services, as well as upturn opportunities for
accessing updated devices, such asmobile ones (Meuter et al., 2005)
The adoption ofmore market friendly economic policies has been a major pillar in the
mobile phone technology adoption process. One ofthe key factors inthedevelopment
and expansion of mobile phone technology in Kenya was the liberalization of the
telecommunication market that started in 1999. The process started with the splitting
ofthenational public operator, the Kenya Post and Telecommunications Corporation
(KPTC), into three different units: The Postal Corporation of Kenya, Telkom Kenya
Ltd. (later privatized) and the Communications Commission of Kenya (CA), which
took on the role of regulator of ICT services. This shift involved an important
reorganization ofthe public ICT policy from emphasis being put on scale economies
achieved through government monopolies to competition and the use of Private
-Public Associations (PPAs) to increase the reach of existing ICTs.
Competition amongst the mobile service providers seems to have contributed to
mobile phone technology adoption. Mobile services were first offered in Kenya in
1992, by the Government owned mobile operator, then KPTC. It was after the
enactment of the Kenya Communication Act in 1998 (which came into effect in July
1999)that other mobile operators were allowed to enter into the market. In2004; the
monopoly of Telkom Kenya Ltd came to an end with the entrance of new private
mobile operators, although it remained the sole fixed network operator in the country.
In 2007, almost half of the shares of its mobile filial, Safaricom, were sold to
Vodafone (the largest mobile operator in the world) becoming the largest private
operator in the country. The other three mobile operators, Celtel Kenya (Now Airtel
Networks Kenya Ltd), Econet Wireless Kenya (Now Essar Telecom Kenya Ltd) and
Telkom's Orange started in2000, 2006 and 2008 respectively. Competing marketing
strategies seem to have nudged some potential adopters into adoption. Figure 1.3
shows quarterly evolution of operators' market share between December 2013 and
March 2014.
~o0 -</
60 0
I-50.0
rr
I
~
~I
~----~
>
~---
~q
~---
E,'
---
~~
---l0.0 300
20n / 9
I 100
r
0.0
-l<:k
~
"~~~
~~
~
~
~~~~
~
~
:
;::=~~
~
~""'::':~~~~~~~~~
Dec-l2 1\Inr-U JUIl-13 Sep-U Dec-l3 Mnr-l-l
_Snfaricom _Airtel Essar _ Orange
Figure 1.3: Mobile network operators market shares
Datasource: Communication Authority ofKenyas'<sector statistics report, 2013
A PricewaterhouseCoopers (PWC) report produced in 2012 argues that, in order to
increase mobile phone penetration inthe country, operators in Africa should adopt
business models that can result in profitability at low average revenue per user
(ARPU) through cooperation with competitors asa way of sharing infrastructure costs
andoverheads.
The economic environment in Kenya has also been very favourable for the expansion
and penetration of mobile phone technology. Data from Kenya Economic survey
shows that between 2002 and 2012, Kenyan Real Gross Domestic Product (GDP) per
capita increased from $13billion in 2002 to $ 37.23 billion in 2012 experiencing
growth every year except for 2008, when the country experienced post- election
violence. This was the same time as the international financial crisis of 2007-2009
thatadversely affected the country's economy. The high GDP per capita growth led
to greater demand for goods and services (including mobile phone technology). Over
this period, the Kenyan telecoms sector generally experienced impressive, albeit
mixed, growth. The mobile phone sector in particular has grown considerably; with
mobilephone penetration now at 75.06 percent as at June 2013. The actual number of
mobile subscribers has since grown from 15,000 subscribers in 1999 to 30.6 million
subscribers as at the end of June 2013.The growth in income must have contributed
toincrease in subscribers.
1.1.4 Human/ adopter characteristics
Legris, Ingham and Collerette (2003) suggest that factors other than technology itself
affect the successful use of ICT. However, not much research effort in Kenya has
delved into understanding adopter characteristics that influence adoption. Munnukka
(2007) argued that age, income and education remain good and accurate predictors of
buyingbehaviour and indeed adoption. He argues that elements such as age, gender,
social class and reference groups affect consumers' values and lifestyles which
influence consumption patterns.
Mobile technology users are predominantly the educated young generation (Tan and
Ouyang, 2003). For young people, adoption of mobile phone technology can be
influenced by social factors which are affected by social interactions. Their adoption
ofthemobile services can be encouraged by a "theory offashion" which isinfluenced
by social environment (Ling, 2001). For this reason, it is necessary to determine the
characteristics of each age group so as to get a clear indication as to the extent to
which Age has impacted on the adoption of mobile phone technology inKenya.
In boththeir studies in Kenya, Meso, Musa and Mbarika (2005) and Mwasaa (2010)
found that cultural influences significantly influenced perceived ease of use while
perceived technology reliability significantly influenced socializing use and business
use ofmobile phone technology.
Carlsson, Hyvonen, Puhakainen and Walden (2006), argued that enjoyment that
comes with technological improvement could be a possibility that influence the
adoption of mobile services. Carlsson etal., 2006 re-emphasized this point when they
state that users will use the services ifthey find it useful or enjoyable, and argue that
mobile services should be improved in everyday life in order for adoption to take
place. For instance, mobile phone features such as screen sizes (visual factors) is quite
important as it improves resolution and color and ultimately leads to higher adoption
rate (Dunlop and Brewster, 2002).
1.1.5 Channels of Communication and other factors
The Communication channels which potential adopters In Kenya use to access
information about mobile phone technology range from mass media tomass mailings,
from print media to electronic media and from telephone contacts to face-to-face
contacts. According to Rodgers (2003) no one channel of communication is sufficient.
Sometimes the interplay among the varied channels of communication generates
awareness and interest to adopters simultaneously or sequentially. Potential adopters
may hear of an innovation via mass media but pursue it only after a friend or
acquaintance has introduced them to itina comfortable setting
Communication in the context of adoption isthe process by which participants create
and share information with one another in order to reach a mutual understanding
(Rogers 2003). A communication channel is ameans by which amessage moves from
one individual to another. Rogers (2003) affirms that mass media channels are more
effective in creating knowledge of innovations, whereas interpersonal channels are
more effective in forming and changing attitudes toward a new idea, and thus in
influencing the decision to adopt or reject a new idea. He adds that most individuals
evaluate an innovation, not on the basis of scientific research by experts, but through
the subjective evaluations of near-peers who have adopted the innovation.
14
Visibility of an innovation stimulates word of mouth and helps increase the adoption
rate. In the Kenyan market different mobile phone models have been widely
advertised and notified to potential adopters in the press thereby easing the initial
presentation tothe public. Word-of-mouth is in itself a very important component, as
Advertising through mass media and promotional activities such as using direct sale
representatives has been widely adopted by Mobile phone technology companies in
Kenya. In addition, companies have invested heavily in branding and marketing of
mobile phone technology services through promotional initiatives such asroad shows.
However it is not clear as to how these activities among other communication
channels have influenced adopters' decision to adopt mobile phone technology in
Kenya.
1.2Statement of the Problem
Eventhough mobile phone technology has brought new possibilities to the country,
the unique mobile subscriber penetration rate in Kenya is below 50 percent. This
means that Kenya isbelow the global optimization of mobile phone technology as an
engine for economic growth. InUSA, ittook the adoption level of 50 percent for the
leT tohave apositive impact on labour productivity (David, 1990; Economist, 2000).
Kenya being a developing country, 30.5 percent level of adoption might be
insufficient for the mobile phone technology to have a positive impact on the
country's labour productivity. The economic importance of mobile phone technology
as a communication tool, facilitator of financial transfer and a media for access to
information cannot be over-ernpasized. Indeed, timely adoption and appropriate use
of easily and widely available mobile phone technology is one opportunity that may
help the country in realizing the digital opportunities that exist.
In support of regular researches in tandem with the rapid evolution of mobile phone
technology, Kim and Garrison (2008) suggest that researchers should add more
15
constructs tothe existing acceptance models related to mobile technology asthis kind
oftechnology is constantly evolving and new factors are emerging every time.
From the discussion above it is apparent that technology specific factors, economic
factors, human/ adopter characteristics and communication channels used among
other factors are important in the decision to adopt mobile phones technology.
However,thelevel of their significance in Kenya has yet tobe established with alevel
of certainty.
Against this background, this study aimed to bridge the knowledge gap by
investigating the primary determinants of mobile phone technology adoption taking
into account the current technology specific factors, economic factors and
human/adopter characteristics that potential adopters are currently relying upon.
1.3 Research questions
The research questions were:
I. What are the mobile phone technology specific characteristics that influence
its adoption rate in Kenya?
II. What human characteristics drive adoption of mobile phone technology in
Kenya?
iii. What economic factors drive adoption of mobile phone technology in Kenya?
1.4 Objective of the study
The general objective of this study was to establish the determinants of mobile
adoption in Kenya. The specific objectives were:
I. Todetermine mobile phone technology specific characteristics that influences
its adoption in Kenya.
ii. To determine the human characteristics that drive adoption of mobile phone
technology in Kenya.
III. To determine economic factors that drive adoption of mobile phone
technology.
1.5Significance of the study
It is apparent that determining the level of significance of the determinants of mobile
phone technology adoption isimportant ashas been shown instudies elsewhere (Vesa,
2005; Carlsson, et al., 2006). Exposing these determinants will shed light on the
adoptioncriteria of consumers, their perception regarding possible benefits and any
possibledrawbacks of mobile technology that telephony ismoving to. Understanding
of these determinants will also help mobile service providers and mobile phone
producers design their strategies taking into consideration the findings of this study.
Giventhe rapid evolution of innovation in mobile phone technology, it isparamount
to come up with the determinants of mobile phone technology adoption that
accompany this rapid evolution from time to time and thus the significance of
undertaking this study.
1.6Scope of the study
The study was carried out in Nairobi County owing to the fact that there is a good
demographic representation and reflection of the various social-economic profiles in
the country. It will rely on primary data collected through a questionnaire.
CHAPTER TWO
LITERATURE REVIEW
2.1. Introduction
This chapter will discuss the literature review in three parts: theoretical literature,
empirical literature and overview of the literature. Theoretical literature will focus on theory specific to technology adoption models and theory specific to various variables that have been cited as determinants of mobile phone technology adoption. Empirical
literature will focus on researches done by others and findings reported. The third part will give an overview of both theoretical and empirical literature.
2.2. Theoretical Literature
One of the most salient models in mobile phone technology adoption studies is the Technology Acceptance Model (TAM, henceforth) proposed by Davis (1989) and latervalidated by many other researchers ina variety of academic disciplines. TAM as proposed by Davis (1989) consists of two constructs; perceived usefulness (PU) and perceived ease of use (PEOU). Perceived Usefulness refers tothe degree to which a person believes that using a particular system would enhance their performance,
whilst perceived ease of use is defined as the degree to which a person believes that using a particular system would be free of physical and mental effort (Davis, 1989). Perceived ease of use construct plays an important role and gets more attention from researchers (Venkatesh and Davis, 1996), while the perceived usefulness is believed as equally important as ease of use and lean toward service-dependent (Venkatesh and Davis, 2000). Technology Acceptance Model (TAM) has been used as a conceptual tool to identify central issues revolving around feT's adoption.
Technology Acceptance Model (TAM) proposes that usefulness and ease of use are
important factors in determining user attitude towards adopting a new technology
(Malhotra and Galletta, 1999). Technology Acceptance model has been used in a
number of studies on mobile phone technology adoption which focus on users (Amberg, 2004; Pagani, 2004; Samtani et al., 2003, Teo and Pok, 2003). Other,
researchers studying adoption and use of leT have also extended the TAM by
including other external variables while measuring determinants of technology
adoption. These variables include prior use and experience and gender (Venkatesh
and Morris, 2000), age and education (Pijpers et al., 200 I), knowledge about
technology (Pijpers et al., 2001), and others.
Gender was not included in the original TAM, but empirical evidence demonstrates
that males and females have different perceptions about ease of use and usefulness
toward information systems and thus have different system usage behavior (Gefen
andStraub, 1997). Research ongender differences indicates that men tend tobehighly
task-oriented (Minton and Schneider, 1980) and, therefore, performance expectancies, which focus on task accomplishment, are likely to be especially sapient to men.
According to Morrow, Presll and McElroy (1986) women typically experience high
levels of anxiety in using a given technology which could lead to lower level of
perceived ease ofuse. Gefen and Straub (1997) argue that men have relative tendency
to feel more at ease with computerized gadgets as compared to women. However,
researchers inKenya are yet to ascertain the significance of gender inthe adoption of
mobile phone technology in Kenya.
On the other hand, age was recurrently found to have moderating effect on performance expectancy (usefulness), effort expectancy (ease of use), social
influence, and as a facilitating condition in many TAM-related studies. Morris and
Venkatesh's study (2000) found a direct effect of age on usefulness perceptions for
both short-term and long-term usage. Subsequent studies by Venkatesh and his colleagues (2003) found age effect greater for older workers in terms of weaker
willingness to adopt new ITproducts. Morris, Venkatesh, and Ackerman (2005) used Theory of Planned Behavior to examine age as a moderator of the determinants of technology use. They found older workers influenced more byattitude toward using technology, subjective norm (social influence), and perceived behavioral control
(facilitating conditions).
One of theimportant modifications brought toTAM isbyVenkatesh and Davis (2000) who proposed the TAM 2 model. Venkatesh and Davis recognised that TAM had some limitations inexplaining the reasons for which aperson would perceive agiven
system useful, and so they proposed that additional variables could be added as antecedents to the perceived usefulness variables in TAM. They called this new
model,the TAM 2.
TAM 2 model was extended to explain perceived usefulness and usage intentions in terms of social influence (subjective norms, voluntariness, image) and cognitive instrumental processes Gob relevance, output quality, result demonstrability,
perceived ease of use). The extended model was tested in both voluntary and mandatory settings. The results strongly supported TAM-2 (Venkatesh and Davis
2000). Similar to TAM-I, TAM-2 posit individual (e.g., ease of use, usefulness) and
behavioral intention to use (i.e., acceptance) and/or actual use ofa new technology in
an organization. The model proposes that usefulness and ease of use are important
factors in determining user attitude towards adopting a new technology (Malhotra and
Galletta, 1999). The model has indeed been used in anumber of studies on adoption
ofmobile services which focus on users (Amberg, 2004; Pagani, 2004; Samtani et al.,
2003, Teo and Pok, 2003). The constructs of the model are actually meant to be
general and universal.
In 2008 Venkatesh and Bala proposed TAM 3. In TAM 3 the determinants of
perceived usefulness (PU) include perceived ease of use, subjective norm, image, job
relevance, output quality and result demonstrability. As in many other areas of life, an individual's perception of IT can be colored by social influences separate from the
objective characteristics of the technology being considered. InTAM 3, these social
influences are represented by subjective norm and image. Subjective norm is defined
as "the degree to which an individual perceives that most people who are important tohim think he should or should not use the proposed IT" and image is"the degree to whichan individual perceives that use of an innovation will enhance his or her status in a social system" (Venkatesh and Bala, 2008).
Another model that has been used in mobile phone technology adoption studies is the
unified theory of acceptance and use of technology (UTA UT). The UTA UT model
whichaims to explain technology acceptance, isbased oneight technology acceptance
theories or models. In particular, the UTA UT draws on the Theory of Reasoned
Action (TRA), the Technology Acceptance Model (TAM), the Motivational Model,
the Theory of Planned Behaviour (TPB), and the model of Personal Computer
Utilization, the Innovation Diffusion Theory and the Social Cognitive Theory
(Venkatesh etal., 2003). At itscore, the UTAUT model uses behavioural intention as
apredictor of the technology use behaviour. The included predictors of behavioural
intention are based on the components the eight technology adoption models
reviewed.
In the UTAUT model, performance expectancy, effort expectancy, and social factors
havedirect effects on behavioural intention, which along with facilitating conditions
have direct effects on use behaviour. The effects of interactions of each of
performance expectancy, effort expectancy and social factors with each of age and
gender; interactions of experience with each of effort expectancy and social factors;
andan interaction of voluntariness of use and social factors on behavioural intention
are also included. Finally, there are effects of interactions of age and facilitating
conditions and experience and facilitating conditions on use behaviour (Venkateshet
ai.,2003).
Studies by Rahm and Huffman (J 984) and Heres and Mante-Meijer (200 I) have
utilized utility functions to study the determinants of adoption of technology. Intheir
work they expressed utility functions as a lexicographic ordering of elements that
provide the decision maker with utility. They posit that an individual ranks the
elements in the utility function by order of importance and then chooses a particular
action depending upon a satisfying criterion. Each element ofthe utility function must
be satisfied in order of rank so that the highest level of utility is achieved when the
greatest number of elements has been satisfied. The construct of their models included
social factors like income level, social network, age, mobility and level of education.
2.3. Empirical Literature
In Slovenia Turk (2003) studied the adoption of mobile telephony using
multi-attribute utility model. By developing a cross-section model for utility estimation, he
empirically tested determinants of mobile phone adoption with dataset about mobile
telephony usage, which was collected in nine countries in Europe. His samples
comprised; Czech Republic (389), Denmark (730), France (813) Germany (880), Italy
(675), Netherlands (596), Norway (912) Spain (675) and UK (562). Using the logit
regression his study concluded that Income levels, Social network, Age, Mobile
enjoyment and level of education were all significant factors in determining adoption
ofmobile telephony.
Hyvonen and Repo (2004) in their study titled "Diffusion of Mobile services in
Finland"used Technology Acceptance Model (TAM) and modified it to include other
variables such as the elements of enjoyment and new possibilities, which are mobile
services such as ringtones, icons and logos, and games. The survey was a traditional
empiricalstudy with random sampling. A sample of 1,000 consumers was randomly
selectedfrom the Population Register Centre of Finland by using age, mother tongue
and residence as criteria. Their study concluded that that technology and its
continuous improvement could lead to a better user experience in using the mobile
services and subsequent adoption of mobile phone technology. Technology
Improvement was found to contribute to reduction in cost of production, improved
service quality by the mobile handset produced and ultimately the attitude towards
use.
In Kenya,Meso et al.,(2005) using theories of technology acceptance and technology
transfer studied factors affecting the use of mobile information and communication
technology (mobile ICT). Using 150 samples they tested the TAM model using partial
least squares (PLS) structural modeling technique, their findings indicated that
cultural influences significantly influenced perceived ease of use of mobile phone
technology with at-value of2.6485, technology reliability influenced socializing use
witha t-value of 14.6031 while accessibility of mobile ICT had a significant influence
on business use of mobile phone technology. However, unlike other studies carried
out inother parts of the world, their study concluded that age, gender and education
level had no effect on mobile ICT use. In conclusion of their study they recommended
that Firms conducting business insub-Saharan African needed to pay attention to the
factors that explain individual mobile ICT use because these factors will most likely
determine the market segmentation, business development and customer service
strategies for leveraging rn-comrnerce operations in the region.
InChina, Park, Yang and Lehto (2007) conducted an online survey of 221 Chinese
nationals and tested a conceptual framework based on the Unified Theory of
Acceptance and Use of Technology (UTAUT) which was developed by Venkatesh et
aI.,(2003)with moderating variables of users' personal factors: gender, education, and
pastinternet experiences. Their study used a two-step process. The first step included
testing ofthe core attitudinal model, followed by the test of moderating effects using
structuralequation modeling (SEM). While social influence was the most important
factor influencing mobile device use, male users tend tobe influenced byperformance
expectation when forming their attitude toward mobile phone technology usage. The
results from their analysis also indicated that gender and education level were the
significant factors in the adoption of mobile phone technologies for the Chinese
consumer.
A survey in 17 African countries by Chabossou, Stork,
c
.
,
Stork, M and Zahonogo(2008) using data from nationally representative household surveys revealed that
African countries differ in their levels of ICT adoption and usage and also in the
factors that influence adoption and usage. In their study income and education was
foundto vastly enhance mobile adoption but gender, age and membership in social
networks had little impact. Income was the main explanatory variable for usage. In
terms of mobile expenditure the study found that mobile expenditure proofs to be
inelastic with regard to income, i.e as income increases mobile expenditure increases
to a lesser extent indicating its importance in individual budgets.
In USA, Phan and Daim (2011) utilized Analytical Hierarchical Process (AHP) and
Cluster analysis to identify the factors that influence the adoption of mobile services
using a sample of 15people aged between 20 to 60years old. The variables analysed
in their study included; Service Quality, Simplicity, Innovativeness, Visual Factor,
Speed,Time Efficiency, Enjoyment, Cost, Mobility, Content, Habits, Technology,
SocialFactors, Usefulness and Ease of Use. The result of their study showed that ease
of use and usefulness are top two factors that influence the adoption of mobile
services. Social Factors were found to be the least important among all other factors.
In Nigeria, Nwagwu (2012) used Roger's innovation adoption theory to explain the
penetration of mobile phone technology in Nigeria's premier higher educational
institution. Using a sample of 370 students andacquisition of a mobile phone as a
proxy for adoption, he examined thedeterminants ofmobile adoption using regression
analysis. He used technology characteristics such as relative advantage, complexity,
trialability and compatibility as factors that could explain adoption. His study
concluded that there was a relationship between adoption of mobile phones and
characteristics of the technology, all the characteristics except observability had
significant relationship with whether students would embrace the mobile phone
technology or not.
InPakistan, Kabeer and Adeel (2013) investigated the determinants likely to influence the adoption of mobile banking services, with a special focus on low-income
population of Pakistan. Technology Acceptance Model (TAM) was used, with
additional determinants of perceived risk and social influence. Data was collected by
surveying 372 respondents from the two largest cities (Karachi and Hyderabad) of the
province Sindh, in Pakistan usingjudgment sampling method. Their study empirically
concluded that consumers' intention to adopt mobile banking services was
significantly influenced by social influence, perceived risk, perceived usefulness, and
perceived ease ofuse. The most significant positive impact was of social influence on
consumers' intention to adopt mobile banking services.
Chitungo and Munongo (2013) used a sample of 275 individuals in rural Zimbabwe
to study determinants of Mobile phone Banking Adoption using an extended
Technology Acceptance Model. They used the Pearson correlation analysis to
examine thebivariate relationships among variables and found that the extended TAM
could predict consumer intention to use mobile banking. Specifically, perceived
usefulness, perceived ease of use, relative advantages, personal innovativeness and
socialnorms had a significant effect on user's attitude thus influencing the intention
toward mobile banking, whilst perceived risks and costs deterred the adoption of the
service.
2.4. Overview of the literature
As examined in literature review, there are human/adopters characteristic, technology
specific factor and economic factors that playa role in determining whether mobile
phone technology is adopted. Some of these variables are included in the empirical
work for this research.
Most of the previous studies have utilized the Technology Acceptance Model (TAM)
to unearth determinants of technology adoption as well as the adoption of mobile
phone technology. However, few studies have also used utility functions in their work.
From the literature reviewed some of the variables that have been found to be
significant in determining technology adoption include; Age, gender, Income level,
level of education, technology specific factors, social factors among others. Most of
the studies reviewed used cross-section data and estimation methods that include
partial least squares (PLS) structural modeling technique, probit and logit.
Despite the fact that anumber of studies on mobile phone technology adoption have
been done, a major shortcoming of previous research is the use of TAM model to
make conclusion about adoption despite the fact that the model was designed to
measure acceptance rather than adoption. In addition, literature reveals that not much
work has been done on mobile phone technology adoption especially insub-Saharan
Africa and in Kenya in particular. Further, Donner's (2008) survey shows, very little of research on adoption has been conducted by economists, and economic studies of
the subject have often focused on diffusion rather than individual adoption.
Based on the knowledge gap revealed bythe literature review, this study adopted the
utility maximization model of Rahm and Huffman (1984) and Heres and Mant
Meijer (20II) and aimed to bridge the identified gap by investigating the primary
determinants of mobile phone technology adoption taking into account the current
technology specific factors, economic factors, human/adopter characteristics and the
communication channels that potential adopters are currently relying upon in Kenya.
CHAPTER THREE
RESEARCH METHODOLOGY
3.1. Introduction
This section discusses the methodology to be adopted for the study. It includes the
research design, the theoretical framework, the model specification, estimation
techniques,the definition and measurement of variables, data sources, collection and
analysis.
3.2.Research Design
The studyused non- experimental cross sectional research design since the variables
were not be deliberately manipulated or the setting controlled. Data was collected
withoutmaking changes or introducing treatments. The study will utilized regression
analysis to investigate the determinants of mobile phone technology adoption.
3.3. Theoretical framework
Thedeterminants ofmobile phone technology adoption have been explored by various
studies such as Carlsson et al., (2006), Park et al., (2007) and Meso et al., (2005).
Most of these studies have utilized Technology Acceptance Model. However, this study adopted autility maximization model of estimation to identify the determinants
ofmobilephonetechnology adoption as proposed by Rahm and Huffman (1984) and
Heresand Maute-Meijer (200 I)
Analysis of determinants of mobile phone technology adoption was based on the
utilitytheory. Utility isdefined as the (perceived) ability ofsomething to satisfy needs
or wants. Following the work of Heres and Mante-Meijer (200 I) this study assumes
that where the utility of the first product is greater than the utility of the second
product,the consumer chooses the first product. Similar, when consumer wants to replacean old mobile phone for a new one, he considers their utilities and he might
buy anew one, ifhe finds:
Unew mobile Phone>Uold mobilephone
A consumeradopts new mobile phone technology when utility gained from the usage
ofanew phone is higher than utility emerging from the usage of the existing (old)
phone. When auser doesn't own a mobile phone (he considers to buy one), he tries
to getsome information about it and this way he tries to estimate the utility he could
gain with it.The above formula becomes
U'new mobile phone> Uold mobilephone
U'new mobile phone is expected utility, estimated according to the user's knowledge about
new mobile phone and his experiences. The consumer estimates his utility by
consideringdifferent characteristics of the mobile phone technology.
WhereAis amobile phone, p, nand ware characteristics, or attributes ofA, and kare
weights. Weights we can express different importance of particular attributes for
different people. One user may consider size of the mobile phone screen, while for
another user it ismore important for a mobile phone to have internet connectivity. The
overall utility is a sum of partial utilities, which are derived from different attributes.
Everyattribute has its own utility function.
Thistaskrequires anempirical estimation of utility functions and weights, according
to equation 3.1. The utility functions can be estimated for a group of users with
statistical tests, while weights are different for different users. The utility functions
can be estimated on the basis of samples for relatively small groups of users with
specific characteristics (e.g. older persons, high educated persons).
Intheproposed framework, the utility of a product or service can be observed also
fromthe variables, which describe persons (their social status, education etc.). Model
3.1can be further empirically explored on the level of an individual user.
Inthe view ofthe utility concept and users' decision-making, the observed response
categoriesmay reflect the actual choices made by individuals ina sample. Underlying
eachchoice at the population level is the utility, which represents the difference
between the costs and the benefits of a particular choice made by an individual
decisionmaker (Powers and Xie, 2000).
Assume binomial dependent variable, which describes some users' decision (e.g.
whether to adopt an leT product or not) and replace the usual linear model
whereEiisdistributed normally
withamodelwith the Bernoulli distribution
where the function Fhas the property that it maps f30
+
f31xi+
Cionto the interval (0,I).Iftheprobability that, for example, Yi = 1, given the outcome off3o
+
f31xi+
ci'This can be written also as
Pr[Yi llXi] 1- Pr[Yi °IXi]
Xi collects the intercept and observed independent variables Xi, while Yi denotes a
random variable with realization Yi (lor 0), which takes values conditional on the
values ofXi(Franses and Paap, 200 I).
The latent variable (in our case utility) is continuous in nature. In case of a single
explanatory variable we can describe itas
Utility
v;
ismapped onto the binomial variable Yi according to the ruleThis is a "cost-benefit" approach of decision-making. Threshold value of utility is
chosen as equal to zero. The user explores the expected utility gained from using a
particular service; when this value is positive, the user prefers the service, and the
value of observed variable Yfor user iis set to I.
If user i is making a choice between two products (or two brands of a product),
denoting the products as A and B, then his evaluation of expected utilities can be
written as
.I--
---
-3
.
4
Theuser prefers brand A ifthe utility ofA exceeds that of E, that is
Pr[Yi
Where ciequals cA,i - cB,i'
P
o
equals UA- UB and ~lis ~A- ~B' The individualparametersin3.4 cannot be identified; one can only identify the differences between
them.Parameters poand ~1can be seen as measurements of the effect of Xion the
choice for brandA relative to brand E, which isin accordance with the understanding
of theutility concept.
Equation3.3hastwo interpretations. The first interpretation ishelpful if we consider
different factors, which influence the decision process i.e. human/adopter and
economic factors. On the other hand, the second possible interpretation can be used
when there are two or more products or brands of the same product to compare
technological characteristics. However, this study will only deal with the first
interpretation and in particular estimation of the utility of becoming an owner of a
mobilephone,considering factors related to users.
From the description of the framework, some of the economic factors and
human/adopter factors, which we can include in the equation 3.3, are derived. From
the literature review the following have been identified: Income category, Cost of
acquiringmobile phone, age, and sex and education level.
3.4. Model Specification
In the analysis of the determinants mobile phone technology adoption this study
followed the work ofRahm and Huffman (1984) and Heres and Mante-Meijer (200 I).
This studyused logit model to explain the determinants of mobile phone technology
adoption. This study specifies the following model
Yl
=
{Jo+
Xl P1+
X2 P2+······ .. ····· +Xn Pn+
c1----- (3.5)Where Yl is the dependent variable (Mobile phone technology adoption), Po is the
constant, X's are the vector of the independent variables. They represent
human/adoptercharacteristic, economic and technological factors. P1 and P2 are the
setofparameters to beestimated and C1 is the stochastic error term.
Subsequently,the following equation was estimated:
MTi,j
=
{Jo+
{J1INCCAT+
P1COST+
P2ACE+
{J3SEX+
P4EDUC+
PsTECHADV+
c1 - - - -(3.6)3.5.Description and measurement of variables
Table 3.1: Definition and measurement of Variables
variable
Definition of the variable Nature of Measurement of Scale
variable
Mobile phone technology Endogenous Measured by 1-Adopter
adoption defined as the variable ownership of a
O-Non Adopter
decision to make full use of mobile phone
an mobile phone technology
as the best course of action
available
Income of the adopter is Exogenous Adopter specific Absolute
monthly variable characteristic number defined as
household income in Kenya
Shillings.
Cost of the mobile phone Exogenous Adopter specific 0-0-\ 0,000
handset defined as the characteristic 1-\0-000
-30,000
2-
30,000-60,000
3-60,000
+
amount of money paid to
acquire the mobile phone
handset.
Education level of the Exogenous Adopter specific O-No education
characteristic 1-Primary education
adopter defined as deliberate variable and systematic activities
Nature of Measurement of Scale Definitionofthevariable
variable variable
designed to meet learning
needs within the context of
the education system In
Kenya.
2-Secondary
education
3-Higher
education
Age of the adopter-defined Exogenous Adopter specific 0-18-24
as the length of time In variable
completed years, that a given
person has been alive,
measured at the beginning of
birth.
characteristic 1-25-34
2-35-44
3-54-54
4-55+
Sex-defined as biological Exogenous Adopter specific 0- Male
status and is typically variable characteristic I-Female
categorized as male or
female.
phone 5 Point likert Technology specific factors Exogenous Mobile
scale ranging
from: defined as hardware and variable
software components of a
mobile phone gadget
characteristic
Measured by size
of the phone, I-Strongly
screen size, battery Agree
Definition of the variable Nature of Measurement of Scale
variable variable
life, access to 5-Strongly
internet, size of disagree
memory and phone
camera.
3.6. Study area
This study was carried out inNairobi County, which is one of the 47 counties in the
Republic ofKenya and the Capital City. The county has a total area of 696.1 Km2.
According to theKenya Bureau of Statistics (2013) in2013 the county population was
projected tobe3,517,325 and was expected to rise to 3,942,054 in 2015. This study
was carried out in Nairobi County since it is the county with the highest mobile
network coverage compared to other parts in the country and therefore potential
adopters are not likely to be constrained by lack of mobile network signals. In
addition,the county also has a good demographic representation ofthe various
social-economicprofiles in the country.
3.7.Target population
The target population for this study was owners of mobile phones and potential
adopters of mobile phones aged above 18 years and who live within the County of
Nairobi.The choice of adopters whose age is above 18years was arrived at based on
the average age at which most of the population in Kenya complete their secondary
level education and begin to actively use mobile phones.