P R O C E E D I N G S
Open Access
Application of collapsing methods for continuous
traits to the Genetic Analysis Workshop 17 exome
sequence data
Yun Ju Sung
*
, Treva K Rice, Dabeeru C Rao
From
Genetic Analysis Workshop 17
Boston, MA, USA. 13-16 October 2010
Abstract
Genetic Analysis Workshop 17 used real sequence data from the 1000 Genomes Project and simulated phenotypes
influenced by a large number of rare variants. Our aim is to evaluate the performance of various collapsing methods
that were developed for analysis of multiple rare variants. We apply collapsing methods to continuous phenotypes Q1
and Q2 for all 200 replicates of the unrelated individuals data. Within each gene, we collapse (1) all SNPs, (2) all SNPs
with minor allele frequency (MAF) < 0.05, and (3) nonsynonymous SNPs with MAF < 0.05. We consider two tests when
collapsing variants: using the proportion of variants and using the presence/absence of any variant. We also compare
our results to a single-marker analysis using PLINK. For phenotype Q1, the proportion test for collapsing rare
nonsynonymous SNPs often performed the best. Two genes (
FLT1
and
KDR
) had statistically significant results. A
single-marker analysis using PLINK also provided statistically significant results for some SNPs within these two genes. For
phenotype Q2, collapsing rare nonsynonymous SNPs performed the best, with almost no difference between
proportion and presence tests. However, neither collapsing methods nor a single-marker analysis provided statistically
significant results at the true genes for Q2. We also found that a large number of noncausal genes had high
correlations with causal genes for Q1 and Q2, which may account for inflated false positives.
Background
Statistical power to identify rare variants is limited
because of the small number of observations for any
given variant. As Dering et al. [1] summarized, several
collapsing methods for identifying rare variants have
focused on testing the combined effect of multiple rare
variants. For continuous traits, we apply the two tests
from Morris and Zeggini [2] that accumulate minor
alleles within the same functional unit. The first test
uses the proportion of rare variants at which an
indivi-dual carries a minor allele, whereas the second test uses
the presence or absence of a minor allele at any rare
variant within an individual.
The Genetic Analysis Workshop 17 (GAW17)
simula-tion uses real sequence data from the 1000 Genomes
Project and simulated phenotypes influenced by a large
number of rare variants [3]. Our main goal in this paper is
to investigate the performance of various collapsing
meth-ods on the GAW17 exome sequence data set. Also, we
compare the gain in power of collapsing methods relative
to single-marker analysis using PLINK [4]. Analyses were
performed without knowledge of the underlying
simula-tion model. However, we use the GAW17 answers in
pre-senting the results.
Methods
Data and covariate adjustment
We use all 200 replicates of phenotypes Q1 and Q2 for
the unrelated individuals data set provided by GAW17.
The GAW17 exome sequence data include 24,487
single-nucleotide polymorphisms (SNPs) in 3,205 genes. Out of
3,205 genes, 1,218 genes have only a single SNP, for
which a collapsing method is identical to a single-SNP
analysis. We exclude 15 genes because all SNPs in these
* Correspondence: [email protected]
Division of Biostatistics, Washington University School of Medicine, 660 S.
Euclid Ave., St. Louis, MO 63110, USA
genes are classified neither synonymous nor
non-synon-ymous. We apply collapsing methods to the remaining
1,972 genes.
To adjust for possible covariates, we run a single-marker
analysis using PLINK for the first replicate with three
pos-sible covariates (Age, Sex, and Smoking status); this
analy-sis corresponds to a multiple linear regression that
regresses continuous phenotypes Q1 and Q2 on the
addi-tive coding of SNP effect and three covariates. Age and
Smoking status are significant covariates for Q1. The
aver-age
−
log(
P
) across all 24,487 SNPs is 18.6 for Age and 9.9
for Smoking status. However, there is no significant
cov-ariate for Q2. These findings are consistent with the
GAW17 simulation answers. Significant covariates are
included for the remaining analysis for both single-marker
and collapsing methods for all 200 replicates.
Collapsing and single-marker methods
We run collapsing methods using R for the 1,972 genes
that include more than 1 SNP and a single-marker analysis
using PLINK for 24,487 SNPs. Within a gene, we consider
three different collapsing methods: (1) collapsing all
var-iants, (2) collapsing variants with minor allele frequency
(MAF) < 0.05, and (3) collapsing nonsynonymous SNPs
with MAF < 0.05. For each collapsing method, we apply
both the proportion and presence/absence tests of Morris
and Zeggini [2].
To evaluate the performance of various collapsing
meth-ods, we compute true-positive (power) and false-positive
(type I error) rates for each level
a
and plot the receiver
operating characteristic (ROC) curve using these true- and
false-positive rates across
a
. The true-positive rate is
com-puted by averaging the proportion of replicates with
P
≤
a
over 200 replicates across true genes; the false-positive
rate is computed similarly.
In addition to power and type I error rates, we also
use
−
log(
P
) values to compare collapsing methods to
single-marker analysis. In a single-marker analysis, the
Manhattan plot that shows
−
log(
P
) across the genome is
commonly used to visually assess statistical significance
of association. To summarize results from all 200
repli-cates, we use
−
log(
P
) averaged across 200 replicates.
Note that the average of
−
log(
P
) can linearly correspond
to Fisher’s method of combining
p
-values across studies
in a meta-analysis. From single-marker analysis, we use
the highest value among the average
−
log(
P
) values
across 200 replicates of all SNPs within each gene.
Results
Collapsing methods: proportion vs. presence tests
Overall performance of collapsing methods is presented
as ROC curves (Figure 1), showing true- and
false-posi-tive rates for phenotypes Q1 and Q2. Collapsing rare
nonsynonymous SNPs provided the best results for both
phenotypes, providing the highest power for every type I
error rate. The advantage of collapsing nonsynonymous
SNPs was more pronounced for Q2 than for Q1. Results
of proportion and presence/absence tests were similar,
and their ROC curves were hardly distinguishable. As
shown in Table 1, collapsing methods performed better
for phenotype Q1 than for Q2.
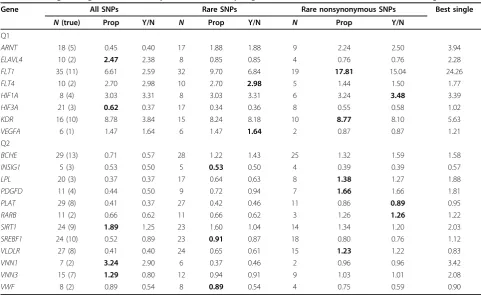
A more detailed performance of the collapsing
meth-ods at the true causal genes is presented in Table 1 for
phenotypes Q1 and Q2. The Bonferroni-corrected
threshold for 1,972 genes is
−
log(0.05/1,972) = 4.59. For
Q1, in the first replicate, the highest signal was 21.39 at
the
FLT1
gene from the proportion test for collapsing
rare nonsynonymous SNPs. In 200 replicates, all tests
except the presence test for collapsing all variants gave
statistically significant results (Table 1). However, the
proportion test for collapsing rare nonsynonymous SNPs
gave the most significant results, with
−
log(
P
) ranging
from 8.29 to 25.24 (mean 17.76) across 200 replicates.
This was particularly interesting because the causal SNP
C13S523 had MAF = 0.07 and was excluded from
collap-sing. The next highest signal was 10.38 at the
KDR
gene,
also from the proportion test for collapsing rare
nonsy-nonymous SNPs. In contrast to the
FLT1
gene, all tests
except the presence test for collapsing all SNPs gave
similar results for the
KDR
gene. We suspect that this
happened because the
KDR
gene has the causal SNP
C4S1878 with MAF = 0.16 and also because noise from
noncausal SNPs for the
KDR
gene was relatively lower
than that for the
FLT1
gene. No other genes were
statisti-cally significant.
For phenotype Q2, no true gene was statistically
signifi-cant for the first replicate and also across 200 replicates
on average (Table 1). The highest signal was 3.24 at the
VNN1
gene from the proportion test for collapsing all
SNPs, ranging from 0.38 to 7.41 across 200 replicates.
The signal was dramatically reduced when collapsing
only rare SNPs. We suspect that this happened because
the
VNN1
gene had only two causal SNPs and one of
them had MAF = 0.17. Hence there was less gain in
power for the collapsing methods relative to a
single-marker analysis.
Single-marker analysis using PLINK
replicates, the most significant SNPs among causal SNPs
were C13S523, C13S522, C13S524, C4S1877, and
C4S1889; their mean
−
log(
P
) values were 24.26, 13.84,
6.55, 5.63, and 5.63, respectively.
For Q2, no SNP was statistically significant in the first
replicate, as shown in Figure 2. The highest signal was
3.76, which occurred at the causal SNP C6S5449 (MAF =
0.01) in the
VNN3
gene; across all 200 replicates, its
−
log
(
P
) value ranged from 0.00 to 9.74, with a mean of 2.08.
The next highest signal among causal SNPs was 3.45,
which occurred at the most common causal SNP,
C6S5380 (MAF = 0.17), in the
VNN1
gene; across 200
Figure 1
ROC curves of collapsing methods for Q1 and Q2
. The
y
-axis shows power (true-positive rate) and the
x
-axis shows type I error rate
(false-positive rate) for significance level between 0 and 1. Prop is the proportion test; Y/N is the presence test.
Table 1 Averaged
−
log(
P
) across 200 replicates from collapsing methods for Q1 and Q2 at the true causal genes
Gene
All SNPs
Rare SNPs
Rare nonsynonymous SNPs
Best single
N
(true)
Prop
Y/N
N
Prop
Y/N
N
Prop
Y/N
Q1
ARNT
18 (5)
0.45
0.40
17
1.88
1.88
9
2.24
2.50
3.94
ELAVL4
10 (2)
2.47
2.38
8
0.85
0.85
4
0.76
0.76
2.28
FLT1
35 (11)
6.61
2.59
32
9.70
6.84
19
17.81
15.04
24.26
FLT4
10 (2)
2.70
2.98
10
2.70
2.98
5
1.44
1.50
1.77
HIF1A
8 (4)
3.03
3.31
8
3.03
3.31
6
3.24
3.48
3.39
HIF3A
21 (3)
0.62
0.37
17
0.34
0.36
8
0.55
0.58
1.02
KDR
16 (10)
8.78
3.84
15
8.24
8.18
10
8.77
8.10
5.63
VEGFA
6 (1)
1.47
1.64
6
1.47
1.64
2
0.87
0.87
1.21
Q2
BCHE
29 (13)
0.71
0.57
28
1.22
1.43
25
1.32
1.59
1.58
INSIG1
5 (3)
0.53
0.50
5
0.53
0.50
4
0.39
0.39
0.57
LPL
20 (3)
0.37
0.37
17
0.64
0.63
8
1.38
1.27
1.88
PDGFD
11 (4)
0.44
0.50
9
0.72
0.94
7
1.66
1.66
1.81
PLAT
29 (8)
0.41
0.37
27
0.42
0.46
11
0.86
0.89
0.95
RARB
11 (2)
0.66
0.62
11
0.66
0.62
3
1.26
1.26
1.22
SIRT1
24 (9)
1.89
1.25
23
1.60
1.04
14
1.34
1.20
2.03
SREBF1
24 (10)
0.52
0.89
23
0.91
0.87
18
0.80
0.76
1.12
VLDLR
27 (8)
0.41
0.40
24
0.65
0.61
15
1.23
1.22
0.83
VNN1
7 (2)
3.24
2.90
6
0.37
0.46
2
0.96
0.96
3.42
VNN3
15 (7)
1.29
0.80
12
0.94
0.91
9
1.03
1.01
2.08
VWF
8 (2)
0.89
0.54
8
0.89
0.54
4
0.75
0.59
0.90
replicates, its
−
log(
P
) value ranged from 0.37 to 8.09, with
a mean of 3.42.
Private mutations and inflated false positives
Many GAW17 investigators have observed inflated false
positives for various collapsing methods. We found in the
GAW17 data that 9,433 (out of 24,487) SNPs were private
mutations, having only a single copy in the entire group of
697 subjects. These private mutations occurred in 685
subjects. Each subject had an average of 14 private
muta-tions. The extreme cases were subject NA19327 with 155
private mutations and subject NA19319 with 77 private
mutations. Because genotypes for private mutations that
occurred in the same subject were identical, their
correla-tions were 1; hence a causal variant that is a private
muta-tion has correlamuta-tion 1 with the other private mutamuta-tions in
the same subject. We found that 386 private mutations
were perfectly correlated with one of 23 causal private
mutations for Q1, and 738 private mutations were
per-fectly correlated with one of 37 causal private mutations
for Q2. These mutations were in 266 and 504 other
non-causal genes for Q1 and Q2, respectively. Because a large
number of these noncausal genes were highly correlated
with causal genes, they are suspected of inflating type I
errors.
Discussion and conclusions
We applied several collapsing methods to the GAW17
exome sequence data. For phenotype Q1, the proportion
test for collapsing rare nonsynonymous SNPs often
per-formed the best. Two causal genes,
FLT1
and
KDR
, had
statistically significant results. A single-marker analysis
using PLINK also provided statistically significant results
for some SNPs within these two genes. For phenotype Q2,
collapsing rare nonsynonymous SNPs provided much
better performance than other collapsing methods (as
shown by the ROC curves). However, neither collapsing
methods nor single-marker analysis provided statistically
significant results at the true causal genes.
We observed several important findings from applying
collapsing methods to the GAW17 exome sequence data.
First, collapsing methods did not seem to provide
addi-tional power over the single-marker analysis. Second,
var-ious collapsing methods appeared to be similar. Third,
their performance for phenotypes Q1 and Q2 was a bit
disappointing. Many GAW17 investigators have observed
inflated type I error rates for these collapsing methods.
Luedtke et al. [5] identified 695 spuriously associated
genes that showed consistent association with the discrete
phenotype Affected, which is consistent with our findings
about noncausal genes having high correlations with
cau-sal genes.
GAW17 provided an opportunity to evaluate collapsing
methods using sequence data. We would like to emphasize
two observations. First, 38% of genes (1,218 out of 3,205)
have only a single SNP, for which a collapsing method is
identical to a single-SNP analysis. Because the GAW17
data were based on the real targeted exome sequence data
from the pilot3 study of the 1000 Genomes Project, other
exome sequence data are likely to have a similar feature.
Here, we simply excluded these genes from consideration.
However, collapsing variants across multiple genes might
be a better approach. This approach might also work for
other sequence data that include a large number of SNPs
that do not belong to any gene. Second, 38.5% of SNPs
(9,433 out of 24,487) were private mutations, having only
a single copy in the entire set of 697 subjects. Some of
these may be sequence errors. These mutations create
cor-relations across multiple chromosomes. Even though these
rare variants can be causal, as simulated in the GAW17
Chromosome
−
log(P)
5
101
52
Chromosome
−
log(P)
12345
Q2
data, it is not possible to identify which variants are causal
among multiple private mutations in a single subject. The
1000 Genomes Project recently released sequence data
that contain more than 16 million SNPs for 629 subjects.
Their sequence data are also likely to contain a large
num-ber of private mutations, which would raise similar issues.
Acknowledgments
We appreciate the constructive and insightful comments of two anonymous
reviewers; their suggestions substantially improved the manuscript. We also
appreciate Jack Kent for encouraging us to present details about private
mutations. The work was sponsored by National Institutes of Health (NIH)
grants HL54473, HL45670, and GM28719. The Genetic Analysis Workshops
are supported by NIH grant R01 GM031575.
This article has been published as part of
BMC Proceedings
Volume 5
Supplement 9, 2011: Genetic Analysis Workshop 17. The full contents of the
supplement are available online at
http://www.biomedcentral.com/1753-6561/5?issue=S9.
Authors
’
contributions
YJS conceived of the study, carried out the analysis, and drafted the
manuscript. TKR conceived of the covariate adjustment scheme and
summarized the results. DCR participated in the design of the study and
helped to draft the manuscript. All authors read and approved the final
manuscript.
Competing interests
The authors declare that they have no competing interests.
Published: 29 November 2011
References
1.
Dering C, Pugh E, Ziegler A:
Statistical analysis of rare sequence variants:
an overview of collapsing methods.
Genet Epidemiol
2011,
X(suppl X)
:X-X.
2.
Morris AP, Zeggini E:
An evaluation of statistical approaches to rare
variant analysis in genetic association studies.
Genet Epidemiol
2010,
34
:188-193.
3.
Almasy LA, Dyer TD, Peralta JM, Kent JW Jr., Charlesworth JC, Curran JE,
Blangero J:
Genetic Analysis Workshop 17 mini-exome simulation.
BMC
Proc
2011,
5(suppl 9)
:S2.
4.
Purcell S, Neale B, Todd-Brown K, Thomas L, Ferreira MAR, Bender D,
Maller J, Sklar P, de Bakker PIW, Daly MJ,
et al
:
PLINK: A tool set for
whole-genome association and population-based linkage analysis.
Am J Hum
Genet
2007,
81
:559-575.
5.
Luedtke A, Powers S, Peterson A, Sitarik A, Bekmetjev A, Tintle NL:
Evaluating methods for the analysis of rare variants in sequence data.
BMC Proc
2011,
5(suppl 9)
:S119.
doi:10.1186/1753-6561-5-S9-S121
Cite this article as:
Sung
et al
.:
Application of collapsing methods for
continuous traits to the Genetic Analysis Workshop 17 exome sequence
data.
BMC Proceedings
2011
5
(Suppl 9):S121.
Submit your next manuscript to BioMed Central
and take full advantage of:
•
Convenient online submission
•
Thorough peer review
•
No space constraints or color figure charges
•
Immediate publication on acceptance
•
Inclusion in PubMed, CAS, Scopus and Google Scholar
•