P R O C E E D I N G S
Open Access
Detecting functional rare variants by collapsing
and incorporating functional annotation in
Genetic Analysis Workshop 17 mini-exome data
Xiting Yan
1, Lun Li
1,2, Joon Sang Lee
1, Wei Zheng
3, John Ferguson
1, Hongyu Zhao
1*From
Genetic Analysis Workshop 17
Boston, MA, USA. 13-16 October 2010
Abstract
Association studies using tag SNPs have been successful in detecting disease-associated common variants. However, common variants, with rare exceptions, explain only at most 5–10% of the heritability resulting from genetic factors, which leads to the common disease/rare variants assumption. Indeed, recent studies using sequencing technologies have demonstrated that common diseases can be due to rare variants that could not be systematically studied earlier. Unfortunately, methods for common variants are not optimal if applied to rare variants. To identify rare variants that affect disease risk, several investigators have designed new approaches based on the idea of collapsing different rare variants inside the same genomic block (e.g., the same gene or pathway) to enrich the signal. Here, we consider three different collapsing methods in the multimarker regression model and compared their performance on the Genetic Analysis Workshop 17 data using the consistency of results across different simulations and the cross-validation
prediction error rate. The comparison shows that the proportion collapsing method seems to outperform the other two methods and can find both truly associated rare and common variants. Moreover, we explore one way of incorporating the functional annotations for the variants in the data that collapses nonsynonymous and synonymous variants separately to allow for different penalties on them. The incorporation of functional annotations led to higher sensitivity and specificity levels when the detection results were compared with the answer sheet. The initial analysis was performed without knowledge of the simulating model.
Background
Genome-wide association studies (GWAS) have success-fully identified thousands of common variants associated with the risk of common diseases [1,2]. To date, GWAS have been mostly conducted under the common disease/ common variants (CDCV) hypothesis, which asserts that common diseases are mostly caused by common variants with small to modest effects [3-6]. Typically, only variants with a minor allele frequency (MAF) greater than 1–5% are considered in these studies. However, despite the identification of thousands of common variants that affect common disease risk, with rare exceptions these common variants can explain at most 5–10% of the
heritable component of disease [7]. Theoretical studies based on evolutionary theories suggest that less common variations are more likely to be functional than common variations [8,9]. Recent studies using sequencing technol-ogy have also detected many rare variants that are asso-ciated with disease [7], providing empirical evidence for the common disease/rare variant (CDRV) hypothesis. All these studies suggest that the complex disease etiology can be a mixture of common variants and rare variants.
Typical GWAS detect disease-associated variants using indirect linkage disequilibrium (LD) mapping, which cap-tures the information of correlated single-nucleotide poly-morphisms (SNPs) using a set of tag SNPs to reduce the number of testing. However, this strategy is not efficient when applied to rare variants because the correlation between the rare variants and the tag SNPs is often weak as a result of the low MAF of the rare variants. Alternative
* Correspondence: [email protected]
1
Department of Epidemiology and Public Health, Yale University, New Haven, CT 06520, USA
Full list of author information is available at the end of the article
LD measures for fine mapping have been developed and offer some advantages over the traditional LD mapping [10]. In addition, direct mapping through exhaustive geno-typing or sequencing is more appropriate for identifying functional rare variants.
To analyze the sequencing data, many investigators have developed association tests to detect disease-associated rare variants. These tests fall into three main types: (1) multiple univariate single-marker tests, (2) multiple-marker tests, and (3) collapsing methods. The univariate single-marker tests assess the significance of association for every rare variant independently. The multiple-marker tests instead test for the association of a set of variants simultaneously [11]. Both single-marker and multiple-marker tests have reduced power because of the multiple testing correction. In addition, the power of single-marker tests for low-fre-quency variants is sensitive to the effect size [12]. The col-lapsing methods combine information across multiple variants in the same genomic block (e.g., the same gene or pathway) so that the association signals can be enriched and the test’s degrees of freedom can be reduced [11-14].
Here, we consider three different collapsing methods for rare variants in the same gene. Regression with a LASSO (least absolute shrinkage and selection operator) penalty is then used to choose the significant collapsed rare variants or common variants. The three collapsing methods are compared based on the consistency across replicates, the cross-validation error rate of the fitted model, and the list of true causal variants. The most significant common var-iants and collapsed rare varvar-iants are shown. We also explore the incorporation of the functional annotation information of all the variants in the regression model. By comparing the results with the list of true causal variants, we find that incorporation of the functional annotation leads to higher sensitivity and specificity levels.
Methods
Collapsing rare variants
All the variants are divided into two groups. Variants with MAF > 5% fall into the common variants group, and all the other variants form the rare variants group. Note that this definition of rare variants is specific to this paper. We also considered a more common definition of
rare variants with MAF≤1% and came to the same
con-clusions (results not shown). The rare variants in the same gene are collapsed using the proportion coding (PROP), the data-adaptive sum (DAS), and the weighted-sum (WS) methods. Details and asweighted-sumptions of these collapsing methods can be found in Dering et al. [15].
Multiple regression model
We used a multiple regression model to assess the associa-tion of variants with the phenotype after the collapsing. Suppose that in individualithe collapsed genetic score is
xij( )c for geneland x( )ijc for common variantvj. Note that
for the weighted sum collapsing method, xij( )c =0 for all the common variants because common and rare variants are collapsed into one single term. LetG= (g1,g2,…,gL)
denote the set of all the genes andCV= (v1,v2,…,vM)
denote the set of all common variants. IfYiis the disease
status or the trait value of individuali, then the multiple regression model is:
whereEiis the vector of the environmental variables
for individuali, bEis the vector of coefficients for these
variables, g(·) is the link function, andμiis the mean of Yi. For binary disease status we use the logit link
func-tion, and for the other three quantitative trait models we use the identity link function. For parameter estima-tion, we use a least absolute shrinkage and selection operator (LASSO) [16], which penalizes the likelihood function by adding the sum of the absolute value of the coefficients (L1 penalty function). Many of the coeffi-cients will be shrunk to 0 as a result of the property of the L1 penalty function.
Comparing collapsing methods
The Genetic Analysis Workshop 17 (GAW17) data con-tain 200 simulations, and we treat them as replicates. We use each of the replicates to fit the regression model using a LASSO. Genes with nonzero estimated coefficients are taken to be identified. The consistency of the identified genes across replicates by each method is measured in the following way. Suppose that in the fitted model for replicate i,sij = 1 if genejhas a
non-zero coefficient and 0 otherwise. Then the consistency of the method across different replicates is measured by:
C
each of the 199 validation replicates and the average AUC score is returned, whereas for quantitative traits the mean-square error is used as the measure of predic-tion error.
Incorporating functional annotation
Mutations in the coding region that change the function of the encoded proteins or that fall into highly conserved regions tend to affect the biological function significantly. For each SNP in the data, the functional annotation describes whether the SNP is nonsynonymous or synon-ymous. We try to incorporate this functional annotation information by collapsing the nonsynonymous and synon-ymous SNPs separately and shrinking their parameters to different extents to allow different probabilities of associa-tion. The modified model can be formulated as:
g i Ei E xijc x x lapsed nonsynonymous and synonymous rare variants in gene gl, respectively. To shrink the parameters for the
synonymous and nonsynonymous variants to different extents, the penalized log-likelihood function is set as:
l ns j
cates that the corresponding variant is nonsynonymous, andaj=sindicates that the variant is synonymous. The
two penalty parameterslnsandlsare chosen based on the
cross-validation error rate within each replicate data set.
Results
Comparison of collapsing methods
Two hundred simulations in the GAW17 data set [17] provide values of four traits, including disease, Q1, Q2, and Q4. We treat these 200 simulations as replicates. For each replicate, we fit a multiple regression model using a LASSO. We measure the consistency of the sig-nificant features across the 200 replicates by using the score defined in Eq. (2); the comparison of the consis-tency between the three collapsing methods is shown in Table 1. For the disease model, the proportion collap-sing method achieves the most consistent results across replicates. For the other three traits, the proportion col-lapsing method also has the best consistency.
Alternatively, we fit one model for each replicate and use the fitted model to predict the trait values of the other 199 replicates. The improvement in the prediction accuracy resulting from the genetic features is thus obtained and is shown in Table 2. The comparisons
show that the proportion collapsing method again has the best prediction accuracy for all traits except Q4. In fact, the prediction accuracy for Q4 decreases if the genetic features are included; this is due to the structure of the simulation model. Although Q4 has a heritability of 0.7, none of the heritability is due to genes in the data set. Based on the comparisons, we conclude that the proportion collapsing method achieves the most consistent results and the lowest prediction errors.
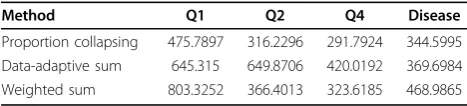
In addition, we rank genes and variants based on the number of replicates that provide nonzero parameter estimates for them. For a given threshold, the set of sig-nificant genes or variants can be defined. By comparing this list of genes with the true causal variants and genes for disease, Q1, and Q2, we calculate the sensitivity and specificity to draw the receiver operating characteristic (ROC) curves, which are shown in Figure 1. Note that sensitivity and specificity reflect the type I and II error of the method, respectively. The area under the ROC curves, defined as the AUC score, is also calculated for each method. The higher the AUC score is, the better performance the method has. Comparison of the ROC curves and AUC scores for different methods shows that for Q2 and disease, the data-adaptive collapsing method performs better than the other two methods. For Q1, however, the proportion collapsing method has the best performance.
Identifying associated variants by incorporating functional annotations
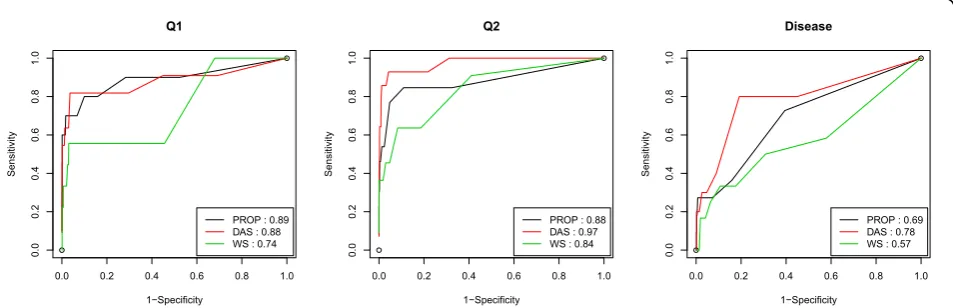
Intuitively, mutations in a gene that change the function of the corresponding encoded protein tend to be more dele-terious. Therefore we collapse the nonsynonymous and synonymous rare variants into two different terms and allow different shrinkage for them in the LASSO model. We use the proportion collapsing method to do the col-lapsing because of its consistently good performance for most of the criteria and trait models. Results before and after incorporating the functional annotation information are compared with the list of truly associated SNPs to gen-erate the ROC curves and their AUC scores, which are shown in Figure 2. The AUC score increases the most for Q2, from 0.51 to 0.67. For disease and Q1, the improve-ments are 0.01 and 0.02, respectively. The improveimprove-ments in the AUC scores suggest that incorporating functional
Table 1 Consistency scores of the selected features from the 200 replicates using the three different collapsing methods
Method Q1 Q2 Q4 Disease
annotation improves the detection accuracy of the asso-ciated variants. This is consistent with the fact that in the simulation model all functional variants are nonsynonymous.
In Table 3, we show the 10 most significant features associated with the four traits. According to the table, there seem to be no environmental effects for Q2, whereas Q4 seems to be affected mostly by the Age, Sex, and Smoke covariates. The population information is included as one of the covariates. But as shown in Table 3, none of the traits rank the population variable as the top 10 most significant feature. All traits except Q4 seem to be significantly associated with variants inside some genes. Compared with the list of true causal variants and genes in the answer sheet, the LASSO regression model detects both true causal common and rare variants for Q1 and Q2 but not for disease. This is because the disease liability is decided by the three quantitative traits and a set of variants. However, in the generalized linear model, none of the quantitative traits are included as predictors, reducing the performance of the model significantly, especially when these traits are actually also decided by the variants included in the model.
Discussion and conclusions
We compared three different collapsing methods using the GAW17 data and explored one way to incorporate
the functional annotation information. The analysis shows that for the GAW17 data, the proportion collap-sing method tends to have the best performance in terms of consistency across different simulations and cross-validation error rate. Furthermore, incorporation of the functional information leads to higher specificity and sensitivity levels. Finally, by comparing the identi-fied genes with the true causal genes, we show that the LASSO method in combination with the rare-variants collapsing method is able to detect most of the true cau-sal variants and genes for the three quantitative traits.
However, several issues need to be addressed with regard to the analysis. First, note that, based on both the consistency score and the cross-validation error rate, the performance of the proportion collapsing method drops when applied to Q2 and disease trait compared to Q1. In fact, Q1 is affected by the covariates Age and Smoke, which can be consistently detected easily and which cause the consistency score to be the best. For disease and Q2, this effect of the covariates is much weaker and thus leads to worse consistency. These results suggest that the consistency score may not be optimal to evaluate the performance of the collapsing methods.
Second, the improvement in the AUC score achieved by incorporating the functional annotation was not impress-ive for disease and Q1, gimpress-iven that all the functional var-iants in the simulation model are nonsynonymous. This again can be related to the higher residual heritability of
Table 2 Improvement in the prediction accuracy of the fitted regression model in the testing replicates using the three collapsing methods
Method Q1 (mean-square error) Q2 (mean-square error) Q4 (mean-square error) Disease (average AUC score)
Proportion collapsing 0.1226466 0.0116719 −0.0068168 0.0023503
Data-adaptive sum 0.1193559 0.0027142 −0.0080903 0.0015294
Weighted sum 0.0779981 0.0080481 −0.0060441 0.0013407
●
Q1 resulting from variants not included in the data set. It also suggests that our current way of incorporating the functional annotation is not optimal.
Third, many important questions are not answered in this analysis. They include how to detect the interac-tions between genes and environmental variables, alter-native ways to incorporate the functional annotation such as Bayesian methods with different prior probabil-ities for the synonymous and nonsynonymous variants, adding the quantitative traits in the disease models as predictors, and applying the generalized additive model.
Acknowledgments
We thank the Yale University Biomedical High Performance Computing Center and the National Institutes of Health (NIH), which funded the instrumentation through grant RR19895. This research was supported in part by NIH grants R01 GM59507 and T15 LM07056 and by a fellowship award from the China Scholarship Council. The Genetic Analysis Workshop is supported by NIH grant R01 GM031575.
This article has been published as part ofBMC ProceedingsVolume 5 Supplement 9, 2011: Genetic Analysis Workshop 17. The full contents of the
supplement are available online at http://www.biomedcentral.com/1753-6561/5?issue=S9.
Author details
1
Department of Epidemiology and Public Health, Yale University, New Haven, CT 06520, USA.2Hubei Bioinformatics and Molecular Imaging Key
Laboratory, Huazhong University of Science and Technology, Wuhan, Hubei, China.3Keck Laboratory, Yale University, New Haven, CT 06511, USA.
Authors’contributions
XY conceived of the study, performed the data analysis and wrote the manuscript. LL, JSL and WZ participated in the data preprocessing and analysis. JF helped to draft the manuscript. All authors participated in design of the study. HZ conceived of the study, coordinated the analysis and wrote the manuscript. All authors read and approved the final manuscript.
Competing interests
The authors declare that they have no competing interests.
Published: 29 November 2011
References
1. Donnelly P:Progress and challenges in genome-wide association studies in humans.Nature2008,456:728-731.
2. Hindorff LA, Sethupathy P, Junkins HA, Ramos EM, Mehta JP, Collins FS, Manolio TA:Potential etiologic and functional implications of genome-●
●
0.0 0.2 0.4 0.6 0.8 1.0
0.0
0.2
0.4
0.6
0.8
1.0
Q1
1íSpecificity
Sensitivity
Before : 0.89 After : 0.90
●
●
0.0 0.2 0.4 0.6 0.8 1.0
0.0
0.2
0.4
0.6
0.8
1.0
Q2
1íSpecificity
Sensitivity
Before : 0.51 After : 0.67
●
●
0.0 0.2 0.4 0.6 0.8 1.0
0.0
0.2
0.4
0.6
0.8
1.0
Disease
1íSpecificity
Sensitivity
Before : 0.74 After : 0.76
Figure 2ROC curves and AUC score of results before and after incorporating the functional annotation
Table 3 The 10 most significant features selected for the disease model and the three quantitative traits when rare variants are collapsed using the proportion collapsing method
Feature Q1 Q2 Q4 Disease
1 Age (200) C6S5380 (108) Sex (200) Age (200)
2 Smoke (200) C6S5441 (51) Age (200) Smoke (180)
3 FLT1(n) (200) PDGFD(n) (50) Smoke (200) C13S523 (39)
4 C13S523 (200) LPL(n) (38) C1ORF122(s) (8) FLT1(n) (25)
5 KDR(n) (175) VLDLR(n) (32) C3S4667 (8) PTK7(s) (16)
6 C4S1878 (76) BCHE(n) (31) FLJ16793(s) (8) ADCY5(s) (12)
7 ARNT(n) (72) SIRT1(n) (28) RY1(s) (8) HOXD11(s) (12)
8 MAP2K7(s) (62) TXNL1(n) (24) ACOX3(s) (7) TFDP1(s) (12) 9 NT5C2(s) (50) RARB(n) (24) OR13A1(s) (7) OR8D4(s) (11) 10 FOXO3(s) (35) C9S3419 (22) C14S697 (7) CCNT1(s) (11)
wide association loci for human diseases and traits.Proc Natl Acad Sci USA2009,106:9362-9367.
3. Hirschhorn JN, Daly MJ:Genome-wide association studies for common diseases and complex traits.Nat Rev Genet2005,6:95-108.
4. Iyengar SK, Elston RC:The genetic basis of complex traits: rare variants or “common gene, common disease”?Meth Mol Biol2007,376:71-84. 5. Reich DE, Lander ES:On the allelic spectrum of human disease.Tr Genet
2001,17:502-510.
6. Smith DJ, Lusis AJ:The allelic structure of common disease.Hum Mol Genet2002,11:2455-2461.
7. Schork NJ, Murray SS, Frazer KA, Topol EJ:Common vs. rare allele hypotheses for complex disease.Curr Opin Genet Dev2009,19:212-219. 8. Pritchard JK:Are rare variants responsible for susceptibility to complex
diseases?Am J Hum Genet2001,69:124-137.
9. Pritchard JK, Cox NJ:The allelic architecture of human disease genes:
common disease-common variant…or not?Hum Mol Genet2002,
11:2417-2423.
10. Graham J, Thompson EA:Disequilibrium likelihoods for fine-scale mapping of a rare allele.Am J Hum Genet1998,63:1517-1530. 11. Han F, Pan W:A data-adaptive sum test for disease association with
multiple common or rare variants.Hum Hered2010,70:42-54. 12. Li B, Leal SM:Methods for detecting associations with rare variants for
common diseases: application to analysis of sequence data.Am J Hum Genet2008,83:311-321.
13. Madsen BE, Browning SR:A groupwise association test for rare mutations using a weighted sum statistic.PLoS Genet2009,5:e1000384.
14. Morris AP, Zeggini E:An evaluation of statistical approaches to rare variant analysis in genetic association studies.Genet Epidemiol2010,
34:188-193.
15. Dering C, Pugh E, Ziegler A:Statistical analysis of rare sequence variants: an overview of collapsing methods.Genet Epidemiol2011,X:X-X. 16. Tibshirani R:Regression shrinkage and selection via the lasso.J R Stat Soc
B1996,58:267-288.
17. Almasy LA, Dyer TD, Peralta JM, Kent JW Jr, Charlesworth JC, Curran JE, Blangero J:Genetic Analysis Workshop 17 mini-exome simulation.BMC Proc2011,5(suppl 9):S2.
doi:10.1186/1753-6561-5-S9-S27
Cite this article as:Yanet al.:Detecting functional rare variants by collapsing and incorporating functional annotation in Genetic Analysis Workshop 17 mini-exome data.BMC Proceedings20115(Suppl 9):S27.
Submit your next manuscript to BioMed Central and take full advantage of:
• Convenient online submission
• Thorough peer review
• No space constraints or color figure charges
• Immediate publication on acceptance
• Inclusion in PubMed, CAS, Scopus and Google Scholar
• Research which is freely available for redistribution